
A carbon sink is anything, natural or otherwise, that accumulates and stores some carbon-containing chemical compound for an indefinite period and thereby removes carbon dioxide from the atmosphere. These sinks form an important part of the natural carbon cycle. An overarching term is carbon pool, which is all the places where carbon can be. A carbon sink is a type of carbon pool that has the capability to take up more carbon from the atmosphere than it releases.

Global warming potential (GWP) is an index to measure of how much infrared thermal radiation a greenhouse gas would absorb over a given time frame after it has been added to the atmosphere. The GWP makes different greenhouse gases comparable with regards to their "effectiveness in causing radiative forcing". It is expressed as a multiple of the radiation that would be absorbed by the same mass of added carbon dioxide, which is taken as a reference gas. Therefore, the GWP is one for CO2. For other gases it depends on how strongly the gas absorbs infrared thermal radiation, how quickly the gas leaves the atmosphere, and the time frame being considered.

There is a strong scientific consensus that the Earth has been consistently warming since the start of the Industrial Revolution, and the rate of recent warming is largely unprecedented. This warming is mainly caused by the rapid increase in atmospheric carbon dioxide (CO2) since 1750 from human activities such as fossil fuel combustion, cement production, and land use changes such as deforestation, with a significant supporting role from the other greenhouse gases such as methane and nitrous oxide. This human role in climate change is now considered "unequivocal" and "incontrovertible".

Global dimming is a decline in the amount of sunlight reaching the Earth's surface, a measure also known as global direct solar irradiance. It was observed soon after the first systematic measurements of solar irradiance began in the 1950s, and continued until 1980s, with an observed reduction of 4–5% per decade, even though solar activity did not vary more than the usual at the time. Instead, global dimming had been attributed to an increase in atmospheric particulate matter, predominantly sulfate aerosols, as the result of rapidly growing air pollution due to post-war industrialization. After 1980s, reductions in particulate emissions have also caused a "partial" reversal of the dimming trend, which has sometimes been described as a global brightening. This reversal is not yet complete, and it has also been globally uneven, as some of the brightening over the developed countries in the 1980s and 1990s had been counteracted by the increased dimming from the industrialization of the developing countries and the expansion of the global shipping industry, although they have also been making rapid progress in cleaning up air pollution in the recent years.

Climate sensitivity is a measure of how much Earth's surface will warm for a doubling in the atmospheric carbon dioxide concentration. In technical terms, climate sensitivity is the average change in global mean surface temperature in response to a radiative forcing, which drives a difference between Earth's incoming and outgoing energy. Climate sensitivity is a key measure in climate science, and a focus area for climate scientists, who want to understand the ultimate consequences of anthropogenic global warming.

A carbon footprint (or greenhouse gas footprint) is a calculated value or index that makes it possible to compare the total amount of greenhouse gases that an activity, product, company or country adds to the atmosphere. Carbon footprints are usually reported in tonnes of emissions (CO2-equivalent) per unit of comparison. Such units can be for example tonnes CO2-eq per year, per kilogram of protein for consumption, per kilometer travelled, per piece of clothing and so forth. A product's carbon footprint includes the emissions for the entire life cycle. These run from the production along the supply chain to its final consumption and disposal. Similarly an organization's carbon footprint includes the direct as well as the indirect emissions that it causes. The Greenhouse Gas Protocol that is used for carbon accounting of organizations calls these Scope 1, 2 and 3 emissions. There are several methodologies and online tools to calculate the carbon footprint. They depend on whether the focus is on a country, organization, product or individual person. For example, the carbon footprint of a product could help consumers decide which product to buy if they want to be climate aware. For climate change mitigation activities, the carbon footprint can help distinguish those economic activities with a high footprint from those with a low footprint. So the carbon footprint concept allows everyone to make comparisons between the climate impacts of individuals, products, companies and countries. It also helps people devise strategies and priorities for reducing the carbon footprint.
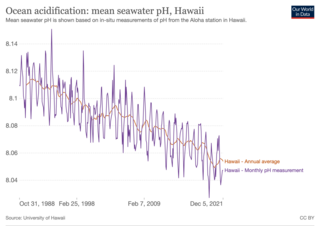
Ocean acidification is the ongoing decrease in the pH of the Earth's ocean. Between 1950 and 2020, the average pH of the ocean surface fell from approximately 8.15 to 8.05. Carbon dioxide emissions from human activities are the primary cause of ocean acidification, with atmospheric carbon dioxide levels exceeding 410 ppm. CO2 from the atmosphere is absorbed by the oceans. This produces carbonic acid which dissociates into a bicarbonate ion and a hydrogen ion. The presence of free hydrogen ions lowers the pH of the ocean, increasing acidity. Marine calcifying organisms, such as mollusks and corals, are especially vulnerable because they rely on calcium carbonate to build shells and skeletons.
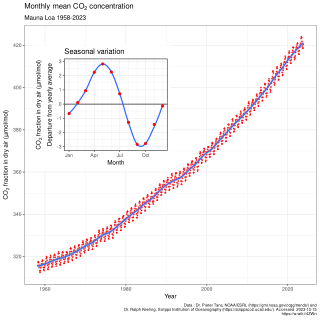
In Earth's atmosphere, carbon dioxide is a trace gas that plays an integral part in the greenhouse effect, carbon cycle, photosynthesis and oceanic carbon cycle. It is one of several greenhouse gases in the atmosphere of Earth. The current global average concentration of CO2 in the atmosphere is 421 ppm as of May 2022 (0.04%). This is an increase of 50% since the start of the Industrial Revolution, up from 280 ppm during the 10,000 years prior to the mid-18th century. The increase is due to human activity. Burning fossil fuels is the main cause of these increased CO2 concentrations and also the main cause of climate change. Other large anthropogenic sources include cement production, deforestation, and biomass burning.

Arctic methane release is the release of methane from seas and soils in permafrost regions of the Arctic. While it is a long-term natural process, methane release is exacerbated by global warming. This results in a positive feedback cycle, as methane is itself a powerful greenhouse gas.

Climate change feedbacks are effects of global warming that amplify or diminish the effect of forces that initially cause the warming. Positive feedbacks enhance global warming while negative feedbacks weaken it. Feedbacks are important in the understanding of climate change because they play an important part in determining the sensitivity of the climate to warming forces. Climate forcings and feedbacks together determine how much and how fast the climate changes. Large positive feedbacks can lead to tipping points—abrupt or irreversible changes in the climate system—depending upon the rate and magnitude of the climate change.

The permafrost carbon cycle or Arctic carbon cycle is a sub-cycle of the larger global carbon cycle. Permafrost is defined as subsurface material that remains below 0o C for at least two consecutive years. Because permafrost soils remain frozen for long periods of time, they store large amounts of carbon and other nutrients within their frozen framework during that time. Permafrost represents a large carbon reservoir, one which was often neglected in the initial research determining global terrestrial carbon reservoirs. Since the start of the 2000s, however, far more attention has been paid to the subject, with an enormous growth both in general attention and in the scientific research output.

A Representative Concentration Pathway (RCP) is a greenhouse gas concentration trajectory adopted by the IPCC. Four pathways were used for climate modeling and research for the IPCC Fifth Assessment Report (AR5) in 2014. The pathways describe different climate change scenarios, all of which are considered possible depending on the amount of greenhouse gases (GHG) emitted in the years to come. The RCPs – originally RCP2.6, RCP4.5, RCP6, and RCP8.5 – are labelled after a possible range of radiative forcing values in the year 2100. The higher values mean higher greenhouse gas emissions and therefore higher global temperatures and more pronounced effects of climate change. The lower RCP values, on the other hand, are more desirable for humans but require more stringent climate change mitigation efforts to achieve them.

There are many effects of climate change on oceans. One of the main ones is an increase in ocean temperatures. More frequent marine heatwaves are linked to this. The rising temperature contributes to a rise in sea levels. Other effects include ocean acidification, sea ice decline, increased ocean stratification and reductions in oxygen levels. Changes to ocean currents including a weakening of the Atlantic meridional overturning circulation are another important effect. All these changes have knock-on effects which disturb marine ecosystems. The main cause of these changes is climate change due to human emissions of greenhouse gases. Carbon dioxide and methane are examples of greenhouse gases. This leads to ocean warming, because the ocean takes up most of the additional heat in the climate system. The ocean absorbs some of the extra carbon dioxide in the atmosphere. This causes the pH value of the ocean to drop. Scientists estimate that the ocean absorbs about 25% of all human-caused CO2 emissions.

Deforestation is a primary contributor to climate change, and climate change affects forests. Land use changes, especially in the form of deforestation, are the second largest anthropogenic source of atmospheric carbon dioxide emissions, after fossil fuel combustion. Greenhouse gases are emitted during combustion of forest biomass and decomposition of remaining plant material and soil carbon. Global models and national greenhouse gas inventories give similar results for deforestation emissions. As of 2019, deforestation is responsible for about 11% of global greenhouse gas emissions. Carbon emissions from tropical deforestation are accelerating. Growing forests are a carbon sink with additional potential to mitigate the effects of climate change. Some of the effects of climate change, such as more wildfires, insect outbreaks, invasive species, and storms are factors that increase deforestation.

A carbon budget is a concept used in climate policy to help set emissions reduction targets in a fair and effective way. It looks at "the maximum amount of cumulative net global anthropogenic carbon dioxide emissions that would result in limiting global warming to a given level". When expressed relative to the pre-industrial period it is referred to as the total carbon budget, and when expressed from a recent specified date it is referred to as the remaining carbon budget.

A climate target, climate goal or climate pledge is a measurable long-term commitment for climate policy and energy policy with the aim of limiting the climate change. Researchers within, among others, the UN climate panel have identified probable consequences of global warming for people and nature at different levels of warming. Based on this, politicians in a large number of countries have agreed on temperature targets for warming, which is the basis for scientifically calculated carbon budgets and ways to achieve these targets. This in turn forms the basis for politically decided global and national emission targets for greenhouse gases, targets for fossil-free energy production and efficient energy use, and for the extent of planned measures for climate change mitigation and adaptation.
Kirsten Zickfeld is a German climate physicist who is now based in Canada. She is a member of the United Nations' Intergovernmental Panel on Climate Change, and was one of the authors on the Intergovernmental Panel on Climate Change's (IPCC) Special Report on Global Warming of 1.5 °C (SR15).Zickfeld completed a Master of Science degree in physics at the Free University of Berlin in 1998, followed by a doctorate in physics at the University of Potsdam in 2004.[7]
Joeri Rogelj is a Belgian climate scientist working on solutions to climate change. He explores how societies can transform towards sustainable futures. He is a Professor in Climate Science and Policy at the Centre for Environmental Policy (CEP) and Director of Research at the Grantham Institute – Climate Change and Environment, both at Imperial College London. He is also affiliated with the International Institute for Applied Systems Analysis. He is an author of several climate reports by the Intergovernmental Panel on Climate Change (IPCC) and the United Nations Environment Programme (UNEP), and a member of the European Scientific Advisory Board for Climate Change.

