Jammu district | |
|---|---|
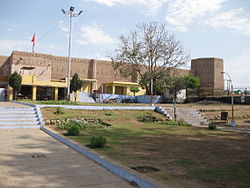
| Bahu Fort, Jammu, India | |
Interactive map of Jammu district | |
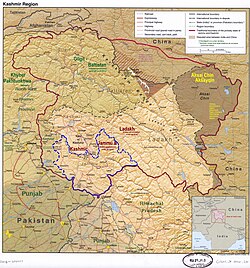
| Jammu district is in the Jammu division (shown with neon blue boundary) of Indian-administered Jammu and Kashmir (shaded in tan in the disputed Kashmir region [1] | |
| Coordinates(Jammu): 32°44′N74°52′E / 32.73°N 74.87°E | |
| Administering country | India |
| Union territory | Jammu and Kashmir |
| Division | Jammu Division |
| Headquarters | Jammu |
| Government | |
| • District Magistrate | Sachin Kumar Vaishya(IAS) |
| • Lok Sabha constituencies | Jammu (Lok Sabha constituency) |
| • Vidhan Sabha constituencies | 11 |
| Area | |
• Total | 2,342 km2 (904 sq mi) |
| • Urban | 252.13 km2 (97.35 sq mi) |
| • Rural | 2,089.87 km2 (806.90 sq mi) |
| Population (2011) [3] | |
• Total | 1,529,958 |
| • Density | 653.3/km2 (1,692/sq mi) |
| • Urban | 765,013 |
| • Rural | 764,945 |
| Demographics | |
| • Literacy | 83.45% |
| • Sex ratio | 880 |
| Time zone | UTC+05:30 (IST) |
| Vehicle registration | JK-02 |
| Website | http://jammu.nic.in/ |
Jammudistrict is an administrative district of the Jammu division of Indian-administered Jammu and Kashmir in the disputed Kashmir region. [1] It is the most populous district in the Jammu division. [4]
Jammu District has 7 Sub-Divisions:
There are 21 tehsils: [5]
There are 20 Blocks:
| Year | Pop. | ±% |
|---|---|---|
| 1901 | 291,399 | — |
| 1911 | 279,051 | −4.2% |
| 1921 | 285,361 | +2.3% |
| 1931 | 316,647 | +11.0% |
| 1941 | 364,253 | +15.0% |
| 1951 | 401,532 | +10.2% |
| 1961 | 438,810 | +9.3% |
| 1971 | 616,396 | +40.5% |
| 1981 | 792,490 | +28.6% |
| 1991 | 1,043,302 | +31.6% |
| 2001 | 1,357,077 | +30.1% |
| 2011 | 1,529,958 | +12.7% |
| † 1951 and 1991 populations are estimated Source: Census of India [6] | ||
According to the 2011 census Jammu district has a population of 1,526,406, roughly equal to the nation of Gabon [8] or the US state of Hawaii. [9] This gives it a ranking of 326th in India (out of a total of 640). [10] The district has a population density of 596 inhabitants per square kilometre (1,540/sq mi) . Its population growth rate over the decade 2001-2011 was 12.48%. Jammu has a sex ratio of 871 females for every 1000 males, and a literacy rate of 83.98%. 50.00% of the population lives in urban areas. The Scheduled Castes and Scheduled Tribes account for 24.71% and 4.52% of the population of the district. [10] [11]
| Jammu district: religion, gender ratio, and % urban of population, according to the 2011 Census. [3] | |||||||||
|---|---|---|---|---|---|---|---|---|---|
| Hindu | Muslim | Christian | Sikh | Buddhist | Jain | Other | Not stated | Total | |
| Total | 1,289,240 | 107,489 | 12,104 | 114,272 | 470 | 1,987 | 321 | 4,075 | 1,529,958 |
| 84.27% | 7.03% | 0.79% | 7.47% | 0.03% | 0.13% | 0.02% | 0.27% | 100.00% | |
| Male | 685,679 | 56,927 | 6,455 | 61,098 | 266 | 1,038 | 171 | 2,187 | 813,821 |
| Female | 603,561 | 50,562 | 5,649 | 53,174 | 204 | 949 | 150 | 1,888 | 716,137 |
| Gender ratio (% female) | 46.8% | 47.0% | 46.7% | 46.5% | 43.4% | 47.8% | 46.7% | 46.3% | 46.8% |
| Sex ratio (no. of females per 1,000 males) | 880 | 888 | 875 | 870 | – | 914 | – | 863 | 880 |
| Urban | 621,495 | 54,157 | 9,599 | 75,307 | 361 | 1,949 | 156 | 1,989 | 765,013 |
| Rural | 667,745 | 53,332 | 2,505 | 38,965 | 109 | 38 | 165 | 2,086 | 764,945 |
| % Urban | 48.2% | 50.4% | 79.3% | 65.9% | 76.8% | 98.1% | 48.6% | 48.8% | 50.0% |
The most widely spoken language of Jammu is Dogri. Other languages spoken are Punjabi, Urdu, Hindi, Kashmiri, Gojri and English. Hindi is widely spoken as a second language. Punjabi is mainly spoken by the Sikhs and some descendants of Partition refugees from West Punjab, while Kashmiri is mainly spoken by the refugee Kashmiri Pandits in Jammu city.
Gabon 1,576,665
Hawaii 1,360,301