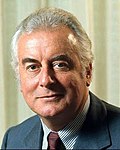
Results of the 1975 Australian federal election (House of Representatives)

Last updated

This is a list of electoral division results for the Australian 1975 federal election. [1]

Contents

Overall

This section is an excerpt from 1975 Australian federal election § House of Representatives results
Government (91)
Coalition

.mw-parser-output .legend{page-break-inside:avoid;break-inside:avoid-column}.mw-parser-output .legend-color{display:inline-block;min-width:1.25em;height:1.25em;line-height:1.25;margin:1px 0;text-align:center;border:1px solid black;background-color:transparent;color:black}.mw-parser-output .legend-text{}
Liberal (68)

NCP (22)

CLP (1)

Opposition (36)

Labor (36)

.mw-parser-output .reflist{font-size:90%;margin-bottom:0.5em;list-style-type:decimal}.mw-parser-output .reflist .references{font-size:100%;margin-bottom:0;list-style-type:inherit}.mw-parser-output .reflist-columns-2{column-width:30em}.mw-parser-output .reflist-columns-3{column-width:25em}.mw-parser-output .reflist-columns{margin-top:0.3em}.mw-parser-output .reflist-columns ol{margin-top:0}.mw-parser-output .reflist-columns li{page-break-inside:avoid;break-inside:avoid-column}.mw-parser-output .reflist-upper-alpha{list-style-type:upper-alpha}.mw-parser-output .reflist-upper-roman{list-style-type:upper-roman}.mw-parser-output .reflist-lower-alpha{list-style-type:lower-alpha}.mw-parser-output .reflist-lower-greek{list-style-type:lower-greek}.mw-parser-output .reflist-lower-roman{list-style-type:lower-roman} Australian House of Representatives elected members, 1975.svg
Government (91)
Coalition
  Liberal (68)
  NCP (22)
  CLP (1)

Opposition (36)
  Labor (36)
    House of Reps (IRV) – 1975–77—Turnout 95.39% (CV) – Informal 1.89%
    1975 Australian House.svg
    PartyVotes %SwingSeatsChange
      Liberal–NCP coalition 4,102,07853.05+7.3291+30
      Liberal 3,232,15941.80+6.8568+28
      National Country  853,94311.04+0.2822+1
      Country Liberal 15,9760.21+0.211+1
      Labor 3,313,00442.84−6.4636−30
      Democratic Labor 101,7501.32−0.1000
      Workers 60,1300.78+0.7800
      Liberal Movement 49,4840.64–0.1400
      Australia 33,6300.43−1.8900
      Communist 9,3930.12+0.1100
      Independent 63,1090.82+0.4200
     Total7,732,578  127 
    Two-party-preferred (estimated)
      Liberal–NCP coalition Win55.70+7.4091+30
      Labor  44.30−7.4036−30
    Popular vote
    Labor
    42.84%
    Liberal
    41.80%
    National
    11.25%
    DLP
    1.32%
    Other
    2.79%
    Two-party-preferred vote
    Coalition
    55.70%
    Labor
    44.30%
    Parliament seats
    Coalition
    71.65%
    Labor
    28.35%

    New South Wales

    1975 Australian federal election (New South Wales)
    Flag of New South Wales.svg
      1974 13 December 1975 1977  

    All 45 NSW seats in the House of Representatives
    23 seats needed for a majority
     First partySecond party
      Fraser Malcolm BANNER.jpg Gough Whitlam headshot.jpg
    Leader Malcolm Fraser Gough Whitlam
    Party Coalition Labor
    Seats before2025
    Seats won2817
    Seat changeIncrease2.svg 8Decrease2.svg 8
    Popular vote1,426,7961,260,335
    Percentage51.5%45.5%
    SwingIncrease2.svg 7.5ppDecrease2.svg 7.2pp
    TPP 53.2%46.8%
    TPP swingIncrease2.svg 8.1ppDecrease2.svg 8.1pp

    Banks

    This section is an excerpt from Electoral results for the Division of Banks § 1975
    1975 Australian federal election: Banks [2]
    PartyCandidateVotes%±%
    Labor Vince Martin 30,61751.7−9.2
    Liberal Maxwell Gibson26,03543.9+10.2
    Independent Denise Arrow1,9393.3+3.3
    Workers Ralph Skelton6811.1+1.1
    Total formal votes59,27297.9−0.5
    Informal votes1,2492.1+0.5
    Turnout 60,52196.7+0.3
    Two-party-preferred result
    Labor Vince Martin 53.1−10.4
    Liberal Maxwell Gibson46.9+10.4
    Labor hold Swing −10.4

    Barton

    This section is an excerpt from Electoral results for the Division of Barton § 1975
    1975 Australian federal election: Barton
    PartyCandidateVotes%±%
    Liberal Jim Bradfield 34,20953.5+9.5
    Labor Murray Gainsford28,17944.1−9.6
    Workers Maxwell Shean8681.4−0.9
    Australia Clifford Willard7061.1−1.2
    Total formal votes63,96298.7
    Informal votes8721.3
    Turnout 64,83496.0
    Two-party-preferred result
    Liberal Jim Bradfield 54.9+10.0
    Labor Murray Gainsford45.1−10.0
    Liberal gain from Labor Swing +10.0

    Bennelong

    This section is an excerpt from Electoral results for the Division of Bennelong § 1975
    1975 Australian federal election: Bennelong [2]
    PartyCandidateVotes%±%
    Liberal John Howard 39,86760.5+8.8
    Labor Noel Welsman23,31935.4−6.6
    Australia Brian Johnson1,5272.3−1.9
    Independent John Anlezark1,1951.8−0.3
    Total formal votes65,90898.4
    Informal votes1,0941.6
    Turnout 67,00295.4
    Two-party-preferred result
    Liberal John Howard 62.8+8.3
    Labor Noel Welsman37.2−8.3
    Liberal hold Swing +8.3

    Berowra

    This section is an excerpt from Electoral results for the Division of Berowra § 1975
    1975 Australian federal election: Berowra
    PartyCandidateVotes%±%
    Liberal Harry Edwards 45,35568.4+5.9
    Labor Michael Ross18,53028.0−4.2
    Workers Robert Howard2,4063.6+3.6
    Total formal votes66,29198.7
    Informal votes8761.3
    Turnout 67,16797.4
    Two-party-preferred result
    Liberal Harry Edwards 71.3+6.6
    Labor Michael Ross28.7−6.6
    Liberal hold Swing +6.6

    Blaxland

    This section is an excerpt from Electoral results for the Division of Blaxland § 1975
    1975 Australian federal election: Blaxland [2]
    PartyCandidateVotes%±%
    Labor Paul Keating 36,33859.8−7.0
    Liberal Joseph Touma22,95737.8+9.1
    Workers Robert Symes1,4632.4+2.4
    Total formal votes60,75897.5
    Informal votes1,5842.5
    Turnout 62,34296.2
    Two-party-preferred result
    Labor Paul Keating 60.3−9.5
    Liberal Joseph Touma39.7+9.5
    Labor hold Swing −9.5

    Bradfield

    This section is an excerpt from Electoral results for the Division of Bradfield § 1975
    1975 Australian federal election: Bradfield [2]
    PartyCandidateVotes%±%
    Liberal David Connolly 53,13577.9+5.6
    Labor John Carmody12,37418.2−5.4
    Workers Christopher Brown2,6623.9+3.9
    Total formal votes68,17198.9
    Informal votes7301.1
    Turnout 68,90196.4
    Two-party-preferred result
    Liberal David Connolly 80.2+6.3
    Labor John Carmody19.8−6.3
    Liberal hold Swing +6.3

    Calare

    This section is an excerpt from Electoral results for the Division of Calare § 1975
    1975 Australian federal election: Calare
    PartyCandidateVotes%±%
    Labor Francis Hall18,84536.8−6.3
    National Country Sandy Mackenzie 18,10635.3−20.2
    Liberal James Ashton14,30927.9+27.9
    Total formal votes51,26098.4
    Informal votes8131.6
    Turnout 52,07395.9
    Two-party-preferred result
    National Country Sandy Mackenzie 30,41359.3+1.5
    Labor Francis Hall20,84740.7−1.5
    National Country hold Swing +1.5

    Chifley

    This section is an excerpt from Electoral results for the Division of Chifley § 1975
    1975 Australian federal election: Chifley
    PartyCandidateVotes%±%
    Labor John Armitage 48,76761.8−9.0
    Liberal Shirley Sookee30,20638.2+11.8
    Total formal votes78,97396.6
    Informal votes2,7733.4
    Turnout 81,74695.9
    Labor hold Swing −10.7

    Cook

    This section is an excerpt from Electoral results for the Division of Cook § 1975
    1975 Australian federal election: Cook
    PartyCandidateVotes%±%
    Liberal Don Dobie 34,33456.0+7.3
    Labor Ray Thorburn 24,85740.5−8.0
    Workers Robert Schollbach9241.5+1.5
    Australia Marjorie Gray7141.2−1.4
    Independent Marc Aussie-Stone3760.6+0.6
    Independent Philip O'Neill1050.2+0.2
    Total formal votes61,31098.6
    Informal votes8631.4
    Turnout 62,17396.6
    Two-party-preferred result
    Liberal Don Dobie 57.8+8.3
    Labor Ray Thorburn 42.2−8.3
    Liberal gain from Labor Swing +8.3

    Cowper

    This section is an excerpt from Electoral results for the Division of Cowper § 1975
    1975 Australian federal election: Cowper
    PartyCandidateVotes%±%
    National Country Ian Robinson 34,94862.3+6.5
    Labor Colin Clague18,89333.7−8.7
    Independent John McLachlan1,6623.0+3.0
    Independent John Holcombe5741.0+1.0
    Total formal votes56,07798.4
    Informal votes6541.6
    Turnout 56,73195.4
    Two-party-preferred result
    National Country Ian Robinson 64.3+7.7
    Labor Colin Clague33.7−7.7
    National Country hold Swing +7.7

    Cunningham

    This section is an excerpt from Electoral results for the Division of Cunningham § 1975
    1975 Australian federal election: Cunningham [2]
    PartyCandidateVotes%±%
    Labor Rex Connor 42,35061.7−8.2
    Liberal Peter Swan24,97236.4+9.3
    Workers Peter Robertson6811.0+1.0
    Independent Bernard Groben6110.9+0.9
    Total formal votes68,61498.0
    Informal votes1,4202.0
    Turnout 70,03496.0
    Two-party-preferred result
    Labor Rex Connor 62.4−9.4
    Liberal Peter Swan37.6+9.4
    Labor hold Swing −9.4

    Darling

    This section is an excerpt from Electoral results for the Division of Darling § 1975
    1975 Australian federal election: Darling
    PartyCandidateVotes%±%
    Labor John FitzPatrick 25,57956.8−2.8
    National Country Walter Mitchell18,87441.9+17.4
    Independent Walter Miller6031.3+1.3
    Total formal votes45,05698.3
    Informal votes7731.7
    Turnout 45,82995.5
    Two-party-preferred result
    Labor John FitzPatrick 57.5−6.3
    National Country Walter Mitchell42.5+6.3
    Labor hold Swing −6.3

    Eden-Monaro

    This section is an excerpt from Electoral results for the Division of Eden-Monaro § 1975
    1975 Australian federal election: Eden-Monaro
    PartyCandidateVotes%±%
    Labor Bob Whan 26,66943.5−5.3
    Liberal Murray Sainsbury 21,66135.3+15.4
    National Country John Moore12,00819.6−10.5
    Independent Frederick Dawson9931.6+1.6
    Total formal votes61,33198.7
    Informal votes8051.3
    Turnout 62,13696.0
    Two-party-preferred result
    Liberal Murray Sainsbury 34,05955.5+55.5
    Labor Bob Whan 27,27244.5−5.6
    Liberal gain from Labor Swing +5.6

    Evans

    This section is an excerpt from Electoral results for the Division of Evans § 1975
    1975 Australian federal election: Evans [2]
    PartyCandidateVotes%±%
    Liberal John Abel 29,76251.1+7.5
    Labor Allan Mulder 27,35746.9−6.0
    Australia Graham Roll4890.8−1.0
    Independent Warren Wilson4210.7+0.7
    Independent Frederick Keoghan2540.4+0.4
    Total formal votes58,28397.9
    Informal votes1,2732.1
    Turnout 59,55694.5
    Two-party-preferred result
    Liberal John Abel 52.0+6.9
    Labor Allan Mulder 48.0−6.9
    Liberal gain from Labor Swing +6.9

    Farrer

    This section is an excerpt from Electoral results for the Division of Farrer § 1975
    1975 Australian federal election: Farrer [2]
    PartyCandidateVotes%±%
    Liberal Wal Fife 29,57049.4−6.1
    Labor Patrick Brassil18,10030.4−9.5
    National Country Kevin Bowtell10,40317.5+17.5
    Democratic Labor Anthony Quinn5190.9+0.9
    Workers Arthur Robinson5140.9+0.9
    Australia Mike Donelan4130.7−3.6
    Total formal votes59,51998.6
    Informal votes8671.4
    Turnout 60,38695.8
    Two-party-preferred result
    Liberal Wal Fife 66.4+9.3
    Labor Patrick Brassil33.6−9.3
    Liberal hold Swing +9.3

    Grayndler

    This section is an excerpt from Electoral results for the Division of Grayndler § 1975
    1975 Australian federal election: Grayndler [2]
    PartyCandidateVotes%±%
    Labor Tony Whitlam 32,41664.3−7.9
    Liberal Jonathan Fowler13,79027.4+4.7
    Independent Peter Dowd1,7133.4+3.4
    Independent Douglas Spedding1,5963.2+3.2
    Independent Graeme Shortland8651.7+1.7
    Total formal votes50,38096.8
    Informal votes1,6403.2
    Turnout 52,02091.1
    Two-party-preferred result
    Labor Tony Whitlam 68.0−7.7
    Liberal Jonathan Fowler32.0+7.7
    Labor hold Swing -7.7

    Gwydir

    This section is an excerpt from Electoral results for the Division of Gwydir § 1975
    1975 Australian federal election: Gwydir
    PartyCandidateVotes%±%
    National Country Ralph Hunt 31,77962.0+4.0
    Labor Francis Bourke18,68636.5−4.1
    Independent Norbert Hennessy4490.9+0.9
    Independent William O'Donnell3310.6+0.6
    Total formal votes51,24598.3
    Informal votes8931.7
    Turnout 52,13896.3
    Two-party-preferred result
    National Country Ralph Hunt 63.5+4.9
    Labor Francis Bourke36.5−4.9
    National Country hold Swing +4.9

    Hughes

    This section is an excerpt from Electoral results for the Division of Hughes § 1975
    1975 Australian federal election: Hughes
    PartyCandidateVotes%±%
    Labor Les Johnson 37,00059.3−7.0
    Liberal Robert Law25,36240.7+9.3
    Total formal votes62,36298.0
    Informal votes1,3022.0
    Turnout 63,66496.7
    Labor hold Swing -8.4

    Hume

    This section is an excerpt from Electoral results for the Division of Hume § 1975
    1975 Australian federal election: Hume
    PartyCandidateVotes%±%
    National Country Stephen Lusher 27,74657.0+17.4
    Labor George Brenner 20,92543.0−4.4
    Total formal votes48,67198.7
    Informal votes6651.3
    Turnout 49,33696.4
    National Country hold Swing +6.3

    Hunter

    This section is an excerpt from Electoral results for the Division of Hunter § 1975
    1975 Australian federal election: Hunter
    PartyCandidateVotes%±%
    Labor Bert James 43,59068.4−4.2
    Liberal Stephen Walker20,10031.6+6.7
    Total formal votes63,69098.3
    Informal votes1,1141.7
    Turnout 64,80496.6
    Labor hold Swing -5.6

    Kingsford Smith

    This section is an excerpt from Electoral results for the Division of Kingsford Smith § 1975
    1975 Australian federal election: Kingsford-Smith [2]
    PartyCandidateVotes%±%
    Labor Lionel Bowen 35,38159.1−8.7
    Liberal Desmond Connors22,95538.4+8.8
    Independent Nicholas Confos1,4992.5+2.5
    Total formal votes59,83597.6
    Informal votes1,4662.4
    Turnout 61,30195.1
    Two-party-preferred result
    Labor Lionel Bowen 60.4−9.0
    Liberal Desmond Connors39.6+9.0
    Labor hold Swing -9.0

    Lang

    This section is an excerpt from Electoral results for the Division of Lang § 1975
    1975 Australian federal election: Lang
    PartyCandidateVotes%±%
    Labor Frank Stewart 31,96055.1−9.6
    Liberal Donald Carruthers22,79339.3+8.5
    Independent Douglas Morgan1,4022.4+2.4
    Independent Marc Aussie-Stone9601.7+1.7
    Independent John Stewart8711.5+1.5
    Total formal votes57,98697.5
    Informal votes1,4772.5
    Turnout 59,46394.5
    Two-party-preferred result
    Labor Frank Stewart 57.4−9.3
    Liberal Donald Carruthers42.6+9.3
    Labor hold Swing -9.3

    Lowe

    This section is an excerpt from Electoral results for the Division of Lowe § 1975
    1975 Australian federal election: Lowe [2]
    PartyCandidateVotes%±%
    Liberal William McMahon 32,90857.3+5.8
    Labor Robert Hyde22,29938.8−4.9
    Australia Clifford Bros1,0391.8−0.1
    Workers Andris Kichno6261.1+1.1
    Independent Ben Doig 6260.6+0.6
    Independent Bent Poulsen1680.3+0.3
    Total formal votes57,40297.9
    Informal votes1,2312.1
    Turnout 58,63394.4
    Two-party-preferred result
    Liberal William McMahon 59.0+5.3
    Labor Robert Hyde41.0−5.3
    Liberal hold Swing +5.3

    Lyne

    This section is an excerpt from Electoral results for the Division of Lyne § 1975
    1975 Australian federal election: Lyne [2]
    PartyCandidateVotes%±%
    National Country Philip Lucock 35,55460.0+0.2
    Labor Bruce Langford18,37731.0−5.5
    Independent Peter Simpson5,3629.0+9.0
    Total formal votes59,29398.8
    Informal votes7201.2
    Turnout 60,01397.1
    Two-party-preferred result
    National Country Philip Lucock 64.5+2.7
    Labor Bruce Langford35.5−2.7
    National Country hold Swing +2.7

    Macarthur

    This section is an excerpt from Electoral results for the Division of Macarthur § 1975
    1975 Australian federal election: Macarthur [2]
    PartyCandidateVotes%±%
    Liberal Michael Baume 41,34151.3+6.4
    Labor John Kerin 36,24745.0−8.2
    Workers Ramon Barros2,2132.7+2.7
    Australia Susan Healy5570.7−1.3
    Independent Barry Watkinson2800.3+0.3
    Total formal votes80,63898.2
    Informal votes1,4631.8
    Turnout 82,10195.9
    Two-party-preferred result
    Liberal Michael Baume 54.1+8.5
    Labor John Kerin 45.9−8.5
    Liberal gain from Labor Swing +8.5

    Mackellar

    This section is an excerpt from Electoral results for the Division of Mackellar § 1975
    1975 Australian federal election: Mackellar [2]
    PartyCandidateVotes%±%
    Liberal Bill Wentworth 43,53661.4+6.2
    Labor Kevin Mason22,33031.5−8.8
    Workers Barry Bracken3,5765.0+5.0
    Independent Jennifer Sheehan1,4082.0+2.0
    Total formal votes70,85098.3
    Informal votes1,1891.7
    Turnout 72,03995.0
    Two-party-preferred result
    Liberal Bill Wentworth 65.6+8.6
    Labor Kevin Mason34.4−8.6
    Liberal hold Swing +8.6

    Macquarie

    This section is an excerpt from Electoral results for the Division of Macquarie § 1975
    1975 Australian federal election: Macquarie
    PartyCandidateVotes%±%
    Liberal Reg Gillard 37,73950.2+14.9
    Labor Ross Free 35,13146.7−9.4
    Workers Murray Busch1,3921.9+1.9
    Independent Norman Lee5240.7+0.7
    Independent Ian Perry4510.6+0.6
    Total formal votes75,23798.2
    Informal votes1,3901.8
    Turnout 76,62795.5
    Two-party-preferred result
    Liberal Reg Gillard 51.6+10.3
    Labor Ross Free 48.4−10.3
    Liberal gain from Labor Swing +10.3

    Mitchell

    This section is an excerpt from Electoral results for the Division of Mitchell § 1975
    1975 Australian federal election: Mitchell [2]
    PartyCandidateVotes%±%
    Liberal Alan Cadman 50,87562.0+12.0
    Labor David Savage28,97035.3−11.6
    Workers Duncan Yuille9991.2+1.2
    Australia Alexander Munro7050.9−1.6
    Independent Dimitar Mikusalev2460.3+0.3
    Independent Ivor F2250.3+0.3
    Total formal votes82,02098.1
    Informal votes1,5631.9
    Turnout 83,58395.7
    Two-party-preferred result
    Liberal Alan Cadman 64.0+12.5
    Labor David Savage36.0−12.5
    Liberal hold Swing +12.5

    New England

    This section is an excerpt from Electoral results for the Division of New England § 1975
    1975 Australian federal election: New England
    PartyCandidateVotes%±%
    National Country Ian Sinclair 36,97162.3+5.3
    Labor John Shanahan19,98033.7−6.5
    Independent Geoffrey Anderson2,3954.0+4.0
    Total formal votes59,34698.5
    Informal votes8811.5
    Turnout 60,22795.1
    Two-party-preferred result
    National Country Ian Sinclair 63.8+5.7
    Labor John Shanahan36.2−5.7
    National Country hold Swing +5.7

    Newcastle

    This section is an excerpt from Electoral results for the Division of Newcastle1975
    1975 Australian federal election: Newcastle [2]
    PartyCandidateVotes%±%
    Labor Charles Jones 34,17061.9−8.1
    Liberal Arthur Thomas20,04536.3+9.2
    Communist David Ross1,0271.9+1.9
    Total formal votes55,24298.0
    Informal votes1,1402.0
    Turnout 56,38296.2
    Two-party-preferred result
    Labor Charles Jones 63.6−8.1
    Liberal Arthur Thomas36.4+8.1
    Labor hold Swing -8.1

    North Sydney

    This section is an excerpt from Electoral results for the Division of North Sydney § 1975
    1975 Australian federal election: North Sydney
    PartyCandidateVotes%±%
    Liberal Bill Graham 35,00963.8+6.9
    Labor Patrick Healy17,95932.7−4.8
    Workers Peter Sawyer1,5642.8+2.8
    Independent Romualds Kemps3620.7+0.1
    Total formal votes54,89498.3
    Informal votes9441.7
    Turnout 55,83893.3
    Two-party-preferred result
    Liberal Bill Graham 66.4+7.5
    Labor Patrick Healy33.6−7.5
    Liberal hold Swing +7.5

    Parramatta

    This section is an excerpt from Electoral results for the Division of Parramatta § 1975
    1975 Australian federal election: Parramatta [2]
    PartyCandidateVotes%±%
    Liberal Philip Ruddock 40,76156.7+7.4
    Labor John Brown 29,05540.4−6.4
    Workers Malcolm McKinnon1,3071.8+1.8
    Australia Astrid O'Neill8011.1−1.1
    Total formal votes71,92498.6
    Informal votes9941.4
    Turnout 72,91895.9
    Two-party-preferred result
    Liberal Philip Ruddock 59.2+7.9
    Labor John Brown 40.8−7.9
    Liberal hold Swing +7.9

    Paterson

    This section is an excerpt from Electoral results for the Division of Paterson § 1975
    1975 Australian federal election: Paterson [2]
    PartyCandidateVotes%±%
    National Country Frank O'Keefe 30,98555.6+6.3
    Labor Noel Unicomb23,39742.0−7.0
    Independent Barnard Hassett8611.5+1.5
    Independent Marc Aussie-Stone5050.9+0.9
    Total formal votes55,74898.6
    Informal votes7801.4
    Turnout 56,52896.0
    Two-party-preferred result
    National Country Frank O'Keefe 57.3+7.0
    Labor Noel Unicomb42.7−7.0
    National Country hold Swing +7.0

    Phillip

    This section is an excerpt from Electoral results for the Division of Phillip § 1975
    1975 Australian federal election: Phillip [2]
    PartyCandidateVotes%±%
    Liberal Jack Birney 31,86950.6+6.5
    Labor Joe Riordan 29,52546.9−5.8
    Workers Michael Clarke8821.4+1.4
    Australia Marie Morris6751.1−1.2
    Total formal votes62,95198.1
    Informal votes1,2041.9
    Turnout 64,15592.7
    Two-party-preferred result
    Liberal Jack Birney 52.6+7.1
    Labor Joe Riordan 47.4−7.1
    Liberal gain from Labor Swing +7.1

    Prospect

    This section is an excerpt from Electoral results for the Division of Prospect § 1975
    1975 Australian federal election: Prospect
    PartyCandidateVotes%±%
    Labor Dick Klugman 38,48757.0−10.4
    Liberal Donald MacDonald27,69541.1+11.1
    Australia Geoffrey Thomas1,2841.9−0.7
    Total formal votes67,46697.1
    Informal votes1,9832.9
    Turnout 69,44994.9
    Two-party-preferred result
    Labor Dick Klugman 58.1−10.9
    Liberal Donald MacDonald41.9+10.9
    Labor hold Swing -10.9

    Reid

    This section is an excerpt from Electoral results for the Division of Reid § 1975
    1975 Australian federal election: Reid
    PartyCandidateVotes%±%
    Labor Tom Uren 33,20858.9−9.0
    Liberal Terence Shanahan20,41436.2+6.5
    Workers Kevin McKenna2,7424.9+4.9
    Total formal votes56,36497.3
    Informal votes1,5542.7
    Turnout 57,91895.6
    Two-party-preferred result
    Labor Tom Uren 59.7−9.6
    Liberal Terence Shanahan40.3+9.6
    Labor hold Swing -9.6

    Richmond

    This section is an excerpt from Electoral results for the Division of Richmond § 1975
    1975 Australian federal election: Richmond
    PartyCandidateVotes%±%
    National Country Doug Anthony 37,89964.1+1.9
    Labor Archibald Johnston18,76631.8−2.3
    Australia Bernard Walrut1,2332.1−1.6
    Independent Ethel Adams1,1882.0+2.0
    Total formal votes59,08698.9
    Informal votes6631.1
    Turnout 59,74995.6
    Two-party-preferred result
    National Country Doug Anthony 66.4+2.7
    Labor Archibald Johnston33.6−2.7
    National Country hold Swing +2.7

    Riverina

    This section is an excerpt from Electoral results for the Division of Riverina § 1975
    1975 Australian federal election: Riverina
    PartyCandidateVotes%±%
    National Country John Sullivan 30,85161.8+28.6
    Labor John Pollard19,05338.2−9.6
    Total formal votes49,90498.2
    Informal votes9011.8
    Turnout 50,80595.0
    National Country hold Swing +11.0

    Robertson

    This section is an excerpt from Electoral results for the Division of Robertson § 1975
    1975 Australian federal election: Robertson
    PartyCandidateVotes%±%
    Labor Barry Cohen 41,20149.9−7.7
    Liberal Hugh Chalmers39,33147.6+7.9
    Independent Phillip Smith1,1661.4+1.4
    Workers Raymond Louis8681.1+1.1
    Total formal votes82,56698.4
    Informal votes1,3691.6
    Turnout 83,93596.2
    Two-party-preferred result
    Labor Barry Cohen 51.0−7.6
    Liberal Hugh Chalmers49.0+7.6
    Labor hold Swing -7.6

    Shortland

    This section is an excerpt from Electoral results for the Division of Shortland § 1975
    1975 Australian federal election: Shortland [2]
    PartyCandidateVotes%±%
    Labor Peter Morris 34,18256.9−6.6
    Liberal Richard Bevan24,21540.3+9.9
    Independent Barbara Timmins8721.5+1.5
    Independent Lionel Lambkin8001.3+1.3
    Total formal votes60,06998.7
    Informal votes7901.3
    Turnout 60,85996.2
    Two-party-preferred result
    Labor Peter Morris 58.3−8.0
    Liberal Richard Bevan41.7+8.0
    Labor hold Swing -8.0

    St George

    This section is an excerpt from Electoral results for the Division of St George § 1975
    1975 Australian federal election: St George [2]
    PartyCandidateVotes%±%
    Liberal Maurice Neil 28,37149.0+5.4
    Labor Bill Morrison 28,20348.7−6.3
    Workers Keith Gleeson1,3382.3+2.3
    Total formal votes57,91298.3
    Informal votes1,0061.7
    Turnout 58,91896.2
    Two-party-preferred result
    Liberal Maurice Neil 28,98450.0+5.8
    Labor Bill Morrison 28,92850.0−5.8
    Liberal gain from Labor Swing +5.8

    Sydney

    This section is an excerpt from Electoral results for the Division of Sydney § 1975
    1975 Australian federal election: Sydney
    PartyCandidateVotes%±%
    Labor Les McMahon 31,49366.1−5.8
    Liberal Janis Wallace12,26825.8+6.0
    Communist Laurie Aarons 2,6675.6+5.6
    Workers Merilyn Giesekam6441.4+1.4
    Independent Roderick MacNeil5371.1+1.1
    Total formal votes47,60996.9
    Informal votes1,5393.1
    Turnout 49,14888.4
    Two-party-preferred result
    Labor Les McMahon 72.1−5.9
    Liberal Janis Wallace27.9+5.9
    Labor hold Swing -5.9

    Warringah

    This section is an excerpt from Electoral results for the Division of Warringah § 1975
    1975 Australian federal election: Warringah
    PartyCandidateVotes%±%
    Liberal Michael MacKellar 40,66268.5+7.9
    Labor Allan Hughes17,99030.3−5.0
    Independent Eric Riches7461.3+1.3
    Total formal votes59,39898.5
    Informal votes9281.5
    Turnout 60,32694.7
    Two-party-preferred result
    Liberal Michael MacKellar 69.2+6.9
    Labor Allan Hughes30.8−6.9
    Liberal hold Swing +6.9

    Wentworth

    This section is an excerpt from Electoral results for the Division of Wentworth § 1975
    1975 Australian federal election: Wentworth
    PartyCandidateVotes%±%
    Liberal Bob Ellicott 34,53765.7+3.9
    Labor Mairi Petersen15,22428.9−4.7
    Workers John Curvers2,0583.9+3.9
    Australia Joseph Zingarelli7881.5−3.1
    Total formal votes52,60798.0
    Informal votes1,0592.0
    Turnout 53,66692.4
    Two-party-preferred result
    Liberal Bob Ellicott 69.6+6.0
    Labor Mairi Petersen30.4−6.0
    Liberal hold Swing +6.0

    Werriwa

    This section is an excerpt from Electoral results for the Division of Werriwa § 1975
    1975 Australian federal election: Werriwa
    PartyCandidateVotes%±%
    Labor Gough Whitlam 44,35659.4−9.6
    Liberal William Sadler27,72437.1+7.9
    Independent Marc Aussie-Stone1,1781.6+1.6
    Workers Ronald Watson5780.8+0.8
    Independent Maurice Sharp2710.4+0.4
    Independent Fredrick Keep2700.4+0.4
    Independent Ross May2630.4+0.4
    Total formal votes74,64097.1
    Informal votes2,2662.9
    Turnout 76,90695.4
    Two-party-preferred result
    Labor Gough Whitlam 61.4−8.5
    Liberal William Sadler38.6+8.5
    Labor hold Swing −8.5

    Victoria

    1975 Australian federal election (Victoria)
    Flag of Victoria (Australia).svg
      1974 13 December 1975 1977  

    All 34 Victorian seats in the House of Representatives
    17 seats needed for a majority
     First partySecond party
      Fraser Malcolm BANNER.jpg Gough Whitlam headshot.jpg
    Leader Malcolm Fraser Gough Whitlam
    Party Coalition Labor
    Seats before1816
    Seats won2410
    Seat changeIncrease2.svg 6Decrease2.svg 6
    Popular vote1,071,334882,842
    Percentage51.2%42.1%
    SwingIncrease2.svg 7.3ppDecrease2.svg 5.8pp
    TPP 56.2%43.8%
    TPP swingIncrease2.svg 6.8ppDecrease2.svg 6.8pp

    Balaclava

    This section is an excerpt from Electoral results for the Division of Balaclava § 1975
    1975 Australian federal election: Balaclava
    PartyCandidateVotes%±%
    Liberal Ian Macphee 32,58158.8+7.4
    Labor Martin Ryan18,20332.9−8.4
    Australia John Howe2,3754.3+1.6
    Democratic Labor Peter Lawlor2,2144.0−0.7
    Total formal votes55,37398.0
    Informal votes1,1222.0
    Turnout 56,49595.1
    Two-party-preferred result
    Liberal Ian Macphee 63.7+7.0
    Labor Martin Ryan36.3−7.0
    Liberal hold Swing +7.0

    Ballaarat

    This section is an excerpt from Electoral results for the Division of Ballarat § 1975
    1975 Australian federal election: Ballaarat
    PartyCandidateVotes%±%
    Liberal Jim Short 29,70850.9+5.0
    Labor David Williams 22,84439.1−4.6
    Democratic Labor Bryan Hanrahan4,2197.2−0.3
    Independent Glendon Ludbrook1,6252.8+2.8
    Total formal votes58,39698.3
    Informal votes1,0111.7
    Turnout 59,40797.0
    Two-party-preferred result
    Liberal Jim Short 58.9+4.1
    Labor David Williams 41.1−4.1
    Liberal hold Swing +4.1

    Batman

    This section is an excerpt from Electoral results for the Division of Batman § 1975
    1975 Australian federal election: Batman
    PartyCandidateVotes%±%
    Labor Horrie Garrick 30,57053.8−3.3
    Liberal Michael Galli22,07738.8+7.3
    Democratic Labor Eileen Doyle4,1897.4−1.4
    Total formal votes56,83697.7
    Informal votes1,3552.3
    Turnout 58,19194.7
    Two-party-preferred result
    Labor Horrie Garrick 54.4−6.0
    Liberal Michael Galli45.6+6.0
    Labor hold Swing −6.0

    Bendigo

    This section is an excerpt from Electoral results for the Division of Bendigo § 1975
    1975 Australian federal election: Bendigo
    PartyCandidateVotes%±%
    Liberal John Bourchier 28,59448.3+9.7
    Labor Stewart Anderson25,16042.5−5.3
    Democratic Labor Paul Brennan2,6634.5−0.8
    National Country Henry O'Halloran2,5634.3+4.3
    Independent Leslie Irlam2630.4+0.4
    Total formal votes59,24398.6
    Informal votes8121.4
    Turnout 60,05596.4
    Two-party-preferred result
    Liberal John Bourchier 56.7+5.9
    Labor Stewart Anderson45.3−5.9
    Liberal hold Swing +5.9

    Bruce

    This section is an excerpt from Electoral results for the Division of Bruce § 1975
    1975 Australian federal election: Bruce
    PartyCandidateVotes%±%
    Liberal Billy Snedden 44,31457.2+8.7
    Labor Graeme Bond28,57736.9−6.4
    Democratic Labor John Lloyd2,3473.0−1.5
    Australia Iris Pederick1,7482.3−0.5
    Independent Diana Martin4690.6+0.6
    Total formal votes77,45598.4
    Informal votes1,2321.6
    Turnout 78,68796.7
    Two-party-preferred result
    Liberal Billy Snedden 61.1+8.7
    Labor Graeme Bond38.9−8.7
    Liberal hold Swing +8.7

    Burke

    This section is an excerpt from Electoral results for the Division of Burke (1969–2004) § 1975
    1975 Australian federal election: Burke
    PartyCandidateVotes%±%
    Labor Keith Johnson 45,63454.2−7.0
    Liberal Claus Salger31,10337.0+9.1
    Democratic Labor Colin Walsh4,4425.3−0.3
    Independent Michael Dupla2,9493.5+3.5
    Total formal votes84,12897.3
    Informal votes2,3182.7
    Turnout 86,44696.4
    Two-party-preferred result
    Labor Keith Johnson 57.0−8.8
    Liberal Claus Salger43.0+8.8
    Labor hold Swing −8.8

    Casey

    This section is an excerpt from Electoral results for the Division of Casey § 1975
    1975 Australian federal election: Casey
    PartyCandidateVotes%±%
    Liberal Peter Falconer 39,59753.0+9.7
    Labor Race Mathews 30,61140.9−8.5
    Democratic Labor John McKenna2,2893.1−0.4
    Australia Murray Deerbon1,3401.8−1.9
    Independent Marc Aussie-Stone9231.2+1.2
    Total formal votes74,76098.5
    Informal votes1,1131.5
    Turnout 75,87396.6
    Two-party-preferred result
    Liberal Peter Falconer 57.5+9.0
    Labor Race Mathews 42.5−9.0
    Liberal gain from Labor Swing +9.0

    Chisholm

    This section is an excerpt from Electoral results for the Division of Chisholm § 1975
    1975 Australian federal election: Chisholm
    PartyCandidateVotes%±%
    Liberal Tony Staley 31,47757.0+6.5
    Labor Richard Campbell19,71235.7−5.0
    Democratic Labor Joe Stanley2,7875.0−0.3
    Australia Richard Franklin1,2362.2−1.3
    Total formal votes55,21298.5
    Informal votes8261.5
    Turnout 56,03895.9
    Two-party-preferred result
    Liberal Tony Staley 62.4+5.7
    Labor Richard Campbell37.6−5.7
    Liberal hold Swing +5.7

    Corangamite

    This section is an excerpt from Electoral results for the Division of Corangamite § 1975
    1975 Australian federal election: Corangamite
    PartyCandidateVotes%±%
    Liberal Tony Street 38,25365.0+6.6
    Labor Shirley Ambrose17,43329.6−4.6
    Democratic Labor Francis O'Brien2,3604.0−1.4
    Australia Ian Slater5380.9−1.1
    Independent Brian Costin3050.5+0.5
    Total formal votes58,88998.7
    Informal votes8001.3
    Turnout 59,68997.5
    Two-party-preferred result
    Liberal Tony Street 69.2+5.7
    Labor Shirley Ambrose30.8−5.7
    Liberal hold Swing +5.7

    Corio

    This section is an excerpt from Electoral results for the Division of Corio § 1975
    1975 Australian federal election: Corio [3]
    PartyCandidateVotes%±%
    Labor Gordon Scholes 30,68849.0−5.7
    Liberal Gordon Hall28,90746.2+7.0
    Democratic Labor John Timberlake2,4253.9−0.7
    Australia Guenter Sahr6041.0−0.4
    Total formal votes62,62498.0
    Informal votes1,2982.0
    Turnout 63,92295.7
    Two-party-preferred result
    Labor Gordon Scholes 31,32250.0−6.0
    Liberal Gordon Hall31,30250.0+6.0
    Labor hold Swing −6.0

    Deakin

    This section is an excerpt from Electoral results for the Division of Deakin § 1975
    1975 Australian federal election: Deakin
    PartyCandidateVotes%±%
    Liberal Alan Jarman 33,93554.5+8.0
    Labor Gavan Oakley23,60737.9−6.2
    Democratic Labor Jim Brosnan2,6264.2−0.4
    Australia William Inglis1,1961.9−0.8
    Independent Walter Williams9281.5+1.5
    Total formal votes62,29298.5
    Informal votes9251.5
    Turnout 63,21796.5
    Two-party-preferred result
    Liberal Alan Jarman 59.9+7.6
    Labor Gavan Oakley40.1−7.6
    Liberal hold Swing +7.6

    Diamond Valley

    This section is an excerpt from Electoral results for the Division of Diamond Valley § 1975
    1975 Australian federal election: Diamond Valley
    PartyCandidateVotes%±%
    Liberal Neil Brown 47,97555.0+10.2
    Labor David McKenzie 34,25239.3−7.8
    Democratic Labor Christopher Curtis2,6913.1−2.2
    Australia John Franceschini1,3081.5−0.9
    Independent Marc Aussie-Stone7780.9+0.9
    Independent John Duncan1980.2+0.2
    Total formal votes87,20298.6
    Informal votes1,2021.4
    Turnout 88,40496.2
    Two-party-preferred result
    Liberal Neil Brown 59.1+9.8
    Labor David McKenzie 40.9−9.8
    Liberal gain from Labor Swing +9.8

    Flinders

    This section is an excerpt from Electoral results for the Division of Flinders § 1975
    1975 Australian federal election: Flinders
    PartyCandidateVotes%±%
    Liberal Phillip Lynch 46,15557.5+7.2
    Labor Geoffrey Eastwood30,25137.7−7.8
    Australia Peter Dalton1,8512.3+0.9
    Democratic Labor John Glynn1,6542.1+0.1
    Independent Stanley Hillman3750.5+0.5
    Total formal votes80,28698.5
    Informal votes1,1961.5
    Turnout 81,48295.3
    Two-party-preferred result
    Liberal Phillip Lynch 60.2+7.2
    Labor Geoffrey Eastwood39.8−7.2
    Liberal hold Swing +7.2

    Gellibrand

    This section is an excerpt from Electoral results for the Division of Gellibrand § 1975
    1975 Australian federal election: Gellibrand
    PartyCandidateVotes%±%
    Labor Ralph Willis 32,66961.4−4.5
    Liberal Iris Williams15,77929.7+7.2
    Democratic Labor Bert Bailey 4,7699.0−0.3
    Total formal votes53,21797.1
    Informal votes1,5912.9
    Turnout 54,80895.5
    Two-party-preferred result
    Labor Ralph Willis 62.2−5.9
    Liberal Iris Williams37.8+5.9
    Labor hold Swing −5.9

    Gippsland

    This section is an excerpt from Electoral results for the Division of Gippsland § 1975
    1975 Australian federal election: Gippsland
    PartyCandidateVotes%±%
    National Country Peter Nixon 36,80664.7+5.2
    Labor Peter Turner16,27428.6−3.4
    Democratic Labor Robert McMahon3,8496.8+2.2
    Total formal votes56,92998.2
    Informal votes1,0181.8
    Turnout 57,94795.9
    Two-party-preferred result
    National Country Peter Nixon 70.9+5.1
    Labor Peter Turner29.1−5.1
    National Country hold Swing +5.1

    Henty

    This section is an excerpt from Electoral results for the Division of Henty § 1975
    1975 Australian federal election: Henty
    PartyCandidateVotes%±%
    Liberal Ken Aldred 29,62151.5+7.5
    Labor Joan Child 25,15843.8−5.8
    Democratic Labor Terry Farrell1,9893.5−0.7
    Australia Michael Hughes5360.9+0.9
    Independent Marc Aussie-Stone1900.3+0.3
    Total formal votes57,49498.2
    Informal votes1,0641.8
    Turnout 58,55895.9
    Two-party-preferred result
    Liberal Ken Aldred 55.2+6.7
    Labor Joan Child 44.8−6.7
    Liberal gain from Labor Swing +6.7

    Higgins

    This section is an excerpt from Electoral results for the Division of Higgins § 1975
    1975 Australian federal election: Higgins
    PartyCandidateVotes%±%
    Liberal Roger Shipton 35,57760.7+2.1
    Labor Andrew Homer19,13432.6−2.3
    Democratic Labor John Cotter2,8334.8+1.3
    Australia Rafe Slaney1,0911.9−1.2
    Total formal votes58,63598.3
    Informal votes1,0271.7
    Turnout 59,66294.0
    Two-party-preferred result
    Liberal Roger Shipton 64.9+1.9
    Labor Andrew Homer35.1−1.9
    Liberal hold Swing +1.9

    Holt

    This section is an excerpt from Electoral results for the Division of Holt § 1975
    1975 Australian federal election: Holt
    PartyCandidateVotes%±%
    Liberal William Yates 39,43648.2+9.0
    Labor Max Oldmeadow 38,06946.5−7.8
    Democratic Labor Robert Fidler4,3435.3+1.9
    Total formal votes81,84897.6
    Informal votes2,0492.4
    Turnout 83,89795.9
    Two-party-preferred result
    Liberal William Yates 42,24151.6+8.5
    Labor Max Oldmeadow 39,60748.4−8.5
    Liberal gain from Labor Swing +8.5

    Hotham

    This section is an excerpt from Electoral results for the Division of Hotham § 1975
    1975 Australian federal election: Hotham
    PartyCandidateVotes%±%
    Liberal Don Chipp 32,27854.3+6.1
    Labor Tony Ross24,62341.5−4.9
    Democratic Labor Frank Gaffy1,9483.3−0.4
    Independent John Murray5550.9+0.6
    Total formal votes59,40498.4
    Informal votes29791.6
    Turnout 60,38395.9
    Two-party-preferred result
    Liberal Don Chipp 57.7+5.4
    Labor Tony Ross42.3−5.4
    Liberal hold Swing +5.4

    Indi

    This section is an excerpt from Electoral results for the Division of Indi § 1975
    1975 Australian federal election: Indi
    PartyCandidateVotes%±%
    National Country Mac Holten 33,17161.5+5.2
    Labor Alan Bell17,35932.2−4.3
    Democratic Labor Christopher Cody3,3896.3+0.6
    Total formal votes53,91998.3
    Informal votes9221.7
    Turnout 54,84196.8
    Two-party-preferred result
    National Country Mac Holten 67.2+5.0
    Labor Alan Bell32.8−5.0
    National Country hold Swing +5.0

    Isaacs

    This section is an excerpt from Electoral results for the Division of Isaacs § 1975
    1975 Australian federal election: Isaacs
    PartyCandidateVotes%±%
    Liberal David Hamer 30,64653.2+8.8
    Labor Gareth Clayton 23,50640.8−5.3
    Democratic Labor Ralph Cleary1,9173.3−0.5
    Australia Eldon Simmons8051.4−1.1
    Independent Marc Aussie-Stone7191.2+1.2
    Total formal votes57,59398.3
    Informal votes9751.7
    Turnout 58,56895.7
    Two-party-preferred result
    Liberal David Hamer 56.9+7.5
    Labor Gareth Clayton 43.1−7.5
    Liberal gain from Labor Swing +7.5

    Kooyong

    This section is an excerpt from Electoral results for the Division of Kooyong § 1975
    1975 Australian federal election: Kooyong
    PartyCandidateVotes%±%
    Liberal Andrew Peacock 35,80961.6+6.7
    Labor John Wilkinson17,62030.3−3.9
    Democratic Labor Francis Duffy3,4115.9+0.2
    Australia John Gare1,2832.2−0.8
    Total formal votes58,12398.5
    Informal votes9071.5
    Turnout 59,03095.5
    Two-party-preferred result
    Liberal Andrew Peacock 67.9+5.1
    Labor John Wilkinson32.1−5.1
    Liberal hold Swing +5.1

    La Trobe

    This section is an excerpt from Electoral results for the Division of La Trobe § 1975
    1975 Australian federal election: La Trobe
    PartyCandidateVotes%±%
    Liberal Marshall Baillieu 41,27650.5+8.5
    Labor Tony Lamb 35,50443.5−9.4
    Democratic Labor James Penna1,8892.3−0.4
    Independent Cornelus Hellema1,8372.2+2.2
    Australia Don Walters1,0291.3−0.7
    Independent Ronald Neilsen1690.2+0.2
    Total formal votes18,70498.0
    Informal votes1,6472.0
    Turnout 83,35195.0
    Two-party-preferred result
    Liberal Marshall Baillieu 54.3+8.9
    Labor Tony Lamb 45.7−8.9
    Liberal gain from Labor Swing −3.5

    Lalor

    This section is an excerpt from Electoral results for the Division of Lalor § 1975
    1975 Australian federal election: Lalor
    PartyCandidateVotes%±%
    Labor Jim Cairns 43,42659.3−5.3
    Liberal Francis Purcell24,46733.4+7.6
    Democratic Labor Denis Bilston5,2897.2−0.7
    Total formal votes73,18296.6
    Informal votes2,5433.4
    Turnout 75,72594.8
    Two-party-preferred result
    Labor Jim Cairns 60.9−6.4
    Liberal Francis Purcell39.1+6.4
    Labor hold Swing −6.4

    Mallee

    This section is an excerpt from Electoral results for the Division of Mallee § 1975
    1975 Australian federal election: Mallee
    PartyCandidateVotes%±%
    National Country Peter Fisher 33,66370.1+7.0
    Labor Ronald Davies11,25623.4−3.7
    Democratic Labor Stanley Croughan3,1166.5−1.1
    Total formal votes48,03598.2
    Informal votes8661.8
    Turnout 48,90196.1
    Two-party-preferred result
    National Country Peter Fisher 75.2+4.2
    Labor Ronald Davies24.8−4.2
    National Country hold Swing +4.2

    Maribyrnong

    This section is an excerpt from Electoral results for the Division of Maribyrnong § 1975
    1975 Australian federal election: Maribyrnong
    PartyCandidateVotes%±%
    Labor Moss Cass 29,52849.5−7.2
    Liberal John Gray25,09042.0+9.2
    Democratic Labor Lucia Hayward3,3635.6−3.1
    Australia Thomas Archay1,7002.8+0.9
    Total formal votes59,68197.4
    Informal votes1,6042.6
    Turnout 61,28597.1
    Two-party-preferred result
    Labor Moss Cass 52.1−6.6
    Liberal John Gray47.9+6.6
    Labor hold Swing -6.6

    McMillan

    This section is an excerpt from Electoral results for the Division of McMillan § 1975
    1975 Australian federal election: McMillan [3]
    PartyCandidateVotes%±%
    Labor William Rutherford22,40239.6−4.3
    Liberal Barry Simon 18,41532.6+8.4
    National Country Arthur Hewson 12,97122.9−1.9
    Democratic Labor Les Hilton2,2273.9−0.2
    Independent David Little5250.9+0.9
    Total formal votes56,54098.0
    Informal votes1,1822.0
    Turnout 57,72295.4
    Two-party-preferred result
    Liberal Barry Simon 32,07056.7+56.7
    Labor William Rutherford24,47043.3−2.1
    Liberal gain from National Country Swing +2.1

    Melbourne

    This section is an excerpt from Electoral results for the Division of Melbourne § 1975
    1975 Australian federal election: Melbourne
    PartyCandidateVotes%±%
    Labor Ted Innes 30,52559.2−9.7
    Liberal Robert Fallshaw14,43128.0+6.8
    Democratic Labor Desmond Burke4,6909.1+3.8
    Australia Veronica Schwarz1,1922.3−1.2
    Communist Ian Fehring7101.4+1.4
    Total formal votes51,54896.9
    Informal votes1,6593.1
    Turnout 53,20791.5
    Two-party-preferred result
    Labor Ted Innes 62.7−9.4
    Liberal Robert Fallshaw37.3+9.4
    Labor hold Swing -9.4

    Melbourne Ports

    This section is an excerpt from Electoral results for the Division of Melbourne Ports § 1975
    1975 Australian federal election: Melbourne Ports
    PartyCandidateVotes%±%
    Labor Frank Crean 28,46055.5−4.9
    Liberal Roger Johnston 19,48538.0+7.4
    Australia Beverley Broadbent1,6413.2−1.5
    Democratic Labor Gordon Haberman1,3692.7−1.6
    National Country Frederick Gray1680.3+0.3
    Independent Henry Sanders1540.3+0.3
    Total formal votes51,27797.1
    Informal votes1,5532.9
    Turnout 52,83091.1
    Two-party-preferred result
    Labor Frank Crean 58.3−5.8
    Liberal Roger Johnston 41.7+5.8
    Labor hold Swing -5.8

    Murray

    This section is an excerpt from Electoral results for the Division of Murray § 1975
    1975 Australian federal election: Murray
    PartyCandidateVotes%±%
    National Country Bruce Lloyd 39,05069.9+16.9
    Labor Marjorie Gillies13,54724.3−2.7
    Democratic Labor Patrick Payne3,2395.8+1.2
    Total formal votes55,83698.1
    Informal votes1,0841.9
    Turnout 56,92097.0
    Two-party-preferred result
    National Country Bruce Lloyd 75.1+4.9
    Labor Marjorie Gillies24.9−4.9
    National Country hold Swing +4.9

    Scullin

    This section is an excerpt from Electoral results for the Division of Scullin § 1975
    1975 Australian federal election: Scullin
    PartyCandidateVotes%±%
    Labor Harry Jenkins 31,30756.3−10.2
    Liberal Gerard Clarke19,84735.8+9.9
    Democratic Labor Bernard McGrath2,8295.1−0.9
    Independent Bernard Irving1,6222.9+2.9
    Total formal votes55,60597.2
    Informal votes1,6042.8
    Turnout 57,20995.5
    Two-party-preferred result
    Labor Harry Jenkins 58.3−9.8
    Liberal Gerard Clarke41.7+9.8
    Labor hold Swing -9.8

    Wannon

    This section is an excerpt from Electoral results for the Division of Wannon § 1975
    1975 Australian federal election: Wannon
    PartyCandidateVotes%±%
    Liberal Malcolm Fraser 33,29063.3+8.5
    Labor Keith Wilson16,52131.4−5.9
    Democratic Labor John Casanova2,8045.3−1.4
    Total formal votes52,61599.0
    Informal votes5391.0
    Turnout 53,15497.4
    Two-party-preferred result
    Liberal Malcolm Fraser 68.2+6.8
    Labor Keith Wilson31.8−6.8
    Liberal hold Swing +6.8

    Wills

    This section is an excerpt from Electoral results for the Division of Wills § 1975
    1975 Australian federal election: Wills
    PartyCandidateVotes%±%
    Labor Gordon Bryant 32,38260.2−1.1
    Liberal Howard Kiel17,56232.7+2.9
    Democratic Labor John Flint3,8197.1+0.7
    Total formal votes53,76397.6
    Informal votes1,3362.4
    Turnout 55,09995.9
    Two-party-preferred result
    Labor Gordon Bryant 60.9−2.5
    Liberal Howard Kiel39.1+2.5
    Labor hold Swing -2.5

    Wimmera

    This section is an excerpt from Electoral results for the Division of Wimmera § 1975
    1975 Australian federal election: Wimmera
    PartyCandidateVotes%±%
    National Country Robert King 28,27558.8+19.8
    Labor Brian Brooke16,03033.4−3.5
    Independent Francis Petering1,9864.1+4.1
    Democratic Labor Marjorie McOwan1,7623.7−0.1
    Total formal votes48,05398.7
    Informal votes6491.3
    Turnout 48,70297.0
    Two-party-preferred result
    National Country Robert King 64.2+2.6
    Labor Brian Brooke35.8−2.6
    National Country hold Swing +2.6

    Queensland

    1975 Australian federal election (Queensland)
    Flag of Queensland.svg
      1974 13 December 1975 1977  

    All 18 Queensland seats in the House of Representatives
    9 seats needed for a majority
     First partySecond party
      Fraser Malcolm BANNER.jpg Gough Whitlam headshot.jpg
    Leader Malcolm Fraser Gough Whitlam
    Party Coalition Labor
    Seats before126
    Seats won171
    Seat changeIncrease2.svg 5Decrease2.svg 5
    Popular vote673,148439,405
    Percentage59.3%38.8%
    SwingIncrease2.svg 5.2ppDecrease2.svg 5.2pp
    TPP 60.2%39.8%
    TPP swingIncrease2.svg 5.6ppDecrease2.svg 5.6pp

    Bowman

    This section is an excerpt from Electoral results for the Division of Bowman § 1975
    1975 Australian federal election: Bowman [4]
    PartyCandidateVotes%±%
    Liberal David Jull 36,45846.8+5.8
    Labor Len Keogh 32,82542.2−7.6
    National Country James Dean7,5359.7+1.6
    Workers Donald Wright1,0461.3+1.3
    Total formal votes77,86498.7
    Informal votes1,0091.3
    Turnout 78,87395.9
    Two-party-preferred result
    Liberal David Jull 44,43857.1+8.4
    Labor Len Keogh 33,42642.9−8.4
    Liberal gain from Labor Swing +8.4

    Brisbane

    This section is an excerpt from Electoral results for the Division of Brisbane § 1975
    1975 Australian federal election: Brisbane
    PartyCandidateVotes%±%
    Labor Manfred Cross 24,80245.3−3.9
    Liberal Peter Johnson 24,13044.1+3.3
    National Country Harold Porter4,8138.8+0.4
    Workers Rodney Jeanneret1,0001.8+1.8
    Independent William Kenney7921.3+1.3
    Total formal votes54,74598.4
    Informal votes8891.6
    Turnout 55,63493.0
    Two-party-preferred result
    Liberal Peter Johnson 29,49553.9+5.0
    Labor Manfred Cross 25,25046.1−5.0
    Liberal gain from Labor Swing +5.0

    Capricornia

    This section is an excerpt from Electoral results for the Division of Capricornia § 1975
    1975 Australian federal election: Capricornia
    PartyCandidateVotes%±%
    Labor Doug Everingham 26,87448.3−4.0
    National Country Colin Carige 15,03527.0+1.4
    Liberal Alfred Millroy13,73524.7+3.7
    Total formal votes55,64499.1
    Informal votes5130.9
    Turnout 56,15796.1
    Two-party-preferred result
    National Country Colin Carige 27,89050.1+5.0
    Labor Doug Everingham 27,75449.9−5.0
    National Country gain from Labor Swing +5.0

    Darling Downs

    This section is an excerpt from Electoral results for the Division of Darling Downs § 1975
    1975 Australian federal election: Darling Downs
    PartyCandidateVotes%±%
    National Country Tom McVeigh 42,13369.4+4.5
    Labor Peter Wood 18,59030.6−3.2
    Total formal votes60,72399.0
    Informal votes6071.0
    Turnout 61,33095.8
    National Country hold Swing +4.0

    Dawson

    This section is an excerpt from Electoral results for the Division of Dawson § 1975
    1975 Australian federal election: Dawson
    PartyCandidateVotes%±%
    Labor Rex Patterson 26,81045.8−4.8
    National Country Ray Braithwaite 24,02241.0+3.4
    National Country Noel McFarlane6,93611.8+11.8
    Independent Colin Bailey8211.4+1.4
    Total formal votes58,58998.8
    Informal votes7181.2
    Turnout 59,30795.4
    Two-party-preferred result
    National Country Ray Braithwaite 31,40153.6+4.2
    Labor Rex Patterson 27,18846.4−4.2
    National Country gain from Labor Swing +4.2

    Fisher

    This section is an excerpt from Electoral results for the Division of Fisher § 1975
    1975 Australian federal election: Fisher
    PartyCandidateVotes%±%
    National Country Evan Adermann 49,85070.6+1.8
    Labor Ivan Guy18,75726.5−4.8
    Workers Dennis Marshall2,1103.0−1.7
    Total formal votes70,71798.8
    Informal votes8541.2
    Turnout 71,57196.1
    Two-party-preferred result
    National Country Evan Adermann 72.9+4.2
    Labor Ivan Guy27.1−4.2
    National Country hold Swing +4.2

    Griffith

    This section is an excerpt from Electoral results for the Division of Griffith § 1975
    1975 Australian federal election: Griffith
    PartyCandidateVotes%±%
    Liberal Don Cameron 31,48356.6+7.6
    Labor Ben Humphreys 23,13341.6−6.1
    Workers Wallace Younger9751.8+1.8
    Total formal votes55,59198.6
    Informal votes7721.4
    Turnout 56,36394.9
    Two-party-preferred result
    Liberal Don Cameron 58.0+6.6
    Labor Ben Humphreys 42.0−6.6
    Liberal hold Swing +6.6

    Herbert

    This section is an excerpt from Electoral results for the Division of Herbert § 1975
    1975 Australian federal election: Herbert
    PartyCandidateVotes%±%
    Liberal Robert Bonnett 34,62058.0+4.9
    Labor John Rockett25,09642.0−2.2
    Total formal votes59,71698.4
    Informal votes9451.6
    Turnout 60,66194.8
    Liberal hold Swing +3.8

    Kennedy

    This section is an excerpt from Electoral results for the Division of Kennedy § 1975
    1975 Australian federal election: Kennedy
    PartyCandidateVotes%±%
    National Country Bob Katter, Sr. 29,70462.5−0.1
    Labor Robert Gleeson16,98135.7−1.7
    Workers Charles Rendall8371.8+1.8
    Total formal votes47,52298.7
    Informal votes6221.3
    Turnout 48,14493.6
    Two-party-preferred result
    National Country Bob Katter, Sr. 63.9+1.3
    Labor Robert Gleeson36.1−1.3
    National Country hold Swing +1.3

    Leichhardt

    This section is an excerpt from Electoral results for the Division of Leichhardt § 1975
    1975 Australian federal election: Leichhardt
    PartyCandidateVotes%±%
    Labor Bill Wood 25,92046.5−3.1
    National Country David Thomson 21,31838.2−6.3
    Liberal Laurence Hoins6,91812.4+12.4
    Independent Clarence Grogan9821.8+1.8
    Democratic Labor Bernard Marsh6451.2+1.2
    Total formal votes55,78398.0
    Informal votes1,1342.0
    Turnout 56,91792.4
    Two-party-preferred result
    National Country David Thomson 29,20452.4+5.7
    Labor Bill Wood 26,57947.6−5.7
    National Country gain from Labor Swing +5.7

    Lilley

    This section is an excerpt from Electoral results for the Division of Lilley § 1975
    1975 Australian federal election: Lilley
    PartyCandidateVotes%±%
    Liberal Kevin Cairns 31,01851.4+6.5
    Labor Frank Doyle 25,14241.7−5.8
    National Country Peter Addison4,1946.9+0.5
    Total formal votes60,35498.8
    Informal votes7511.2
    Turnout 61,10595.0
    Two-party-preferred result
    Liberal Kevin Cairns 57.7+6.7
    Labor Frank Doyle 42.3−6.7
    Liberal hold Swing +6.7

    Maranoa

    This section is an excerpt from Electoral results for the Division of Maranoa § 1975
    1975 Australian federal election: Maranoa
    PartyCandidateVotes%±%
    National Country James Corbett 30,15868.8+0.1
    Labor Reuben Coupe11,96227.3−4.0
    Workers Lindsay Sturgess1,6883.9+3.9
    Total formal votes43,80898.8
    Informal votes5151.2
    Turnout 44,32395.5
    Two-party-preferred result
    National Country James Corbett 71.9+3.2
    Labor Reuben Coupe28.1−3.2
    National Country hold Swing +3.2

    McPherson

    This section is an excerpt from Electoral results for the Division of McPherson § 1975
    1975 Australian federal election: McPherson
    PartyCandidateVotes%±%
    Liberal Eric Robinson 61,45564.4+7.8
    Labor Brian Paterson30,64432.1−7.2
    Workers Coral Finlay3,3783.5+3.5
    Total formal votes95,47798.8
    Informal votes1,1521.2
    Turnout 96,62994.6
    Two-party-preferred result
    Liberal Eric Robinson 66.4+7.6
    Labor Brian Paterson33.6−7.6
    Liberal hold Swing +7.6

    Moreton

    This section is an excerpt from Electoral results for the Division of Moreton § 1975
    1975 Australian federal election: Moreton
    PartyCandidateVotes%±%
    Liberal James Killen 35,00361.9+6.4
    Labor Lewin Blazevich20,33835.9−6.5
    Independent William Appleton9291.6+1.6
    Independent John Fitzgerald3230.6+0.6
    Total formal votes56,59398.8
    Informal votes6861.2
    Turnout 57,27995.8
    Two-party-preferred result
    Liberal James Killen 62.5+6.2
    Labor Lewin Blazevich37.5−6.2
    Liberal hold Swing +6.2

    Oxley

    This section is an excerpt from Electoral results for the Division of Oxley § 1975
    1975 Australian federal election: Oxley
    PartyCandidateVotes%±%
    Labor Bill Hayden 36,87950.2−6.8
    National Country James Shapcott18,28624.9+24.9
    Liberal Cornelis Frederiks16,71122.7−18.1
    Workers Neil Russell1,6312.2+2.2
    Total formal votes73,50798.6
    Informal votes1,0361.4
    Turnout 74,54395.8
    Two-party-preferred result
    Labor Bill Hayden 53.8−4.5
    National Country James Shapcott46.2+46.2
    Labor hold Swing -4.5

    Petrie

    This section is an excerpt from Electoral results for the Division of Petrie § 1975
    1975 Australian federal election: Petrie
    PartyCandidateVotes%±%
    Liberal John Hodges 47,41462.5+21.2
    Labor John Hungerford28,45237.5−5.5
    Total formal votes75,86698.6
    Informal votes1,0491.4
    Turnout 76,91595.6
    Liberal hold Swing +7.5

    Ryan

    This section is an excerpt from Electoral results for the Division of Ryan § 1975
    1975 Australian federal election: Ryan
    PartyCandidateVotes%±%
    Liberal John Moore 31,09643.2−14.0
    Labor Colin Taylor22,91431.9−6.4
    National Country Douglas MacTaggart14,98020.8+20.8
    Workers David Boughen2,9174.1+4.1
    Total formal votes71,90799.0
    Informal votes7541.0
    Turnout 72,66195.6
    Two-party-preferred result
    Liberal John Moore 47,83566.5+6.9
    Labor Colin Taylor24,07233.5−6.9
    Liberal hold Swing +6.9

    Wide Bay

    This section is an excerpt from Electoral results for the Division of Wide Bay § 1975
    1975 Australian federal election: Wide Bay
    PartyCandidateVotes%±%
    National Country Clarrie Millar 34,14357.7+14.0
    Labor Brendan Hansen 23,28639.3−6.6
    Workers Gerrit Alberts1,7593.0+3.0
    Total formal votes59,18899.0
    Informal votes5981.0
    Turnout 59,78696.6
    Two-party-preferred result
    National Country Clarrie Millar 59.3+5.8
    Labor Brendan Hansen 40.7−5.8
    National Country hold Swing +5.8

    South Australia

    1975 Australian federal election (South Australia)
    Flag of South Australia.svg
      1974 13 December 1975 1977  

    All 12 SA seats in the House of Representatives
    6 seats needed for a majority
     First partySecond party
      Fraser Malcolm BANNER.jpg Gough Whitlam headshot.jpg
    Leader Malcolm Fraser Gough Whitlam
    Party Coalition Labor
    Seats before57
    Seats won66
    Seat changeIncrease2.svg 1Decrease2.svg 1
    Popular vote369,423316,006
    Percentage49.9%42.6%
    SwingIncrease2.svg 9.2ppDecrease2.svg 6.1pp
    TPP 55.1%44.9%
    TPP swingIncrease2.svg7.6ppDecrease2.svg7.6pp

    Adelaide

    This section is an excerpt from Electoral results for the Division of Adelaide § 1975
    1975 Australian federal election: Adelaide [5]
    PartyCandidateVotes%±%
    Labor Chris Hurford 28,62149.5−6.3
    Liberal Harold Steele24,82543.0+9.6
    Liberal Movement Robert Hercus3,8176.6−2.3
    Australia David Middleton5250.9−1.0
    Total formal votes57,78893.3
    Informal votes1,6332.7
    Turnout 59,42195.2
    Two-party-preferred result
    Labor Chris Hurford 30,48752.8−6.3
    Liberal Harold Steele27,30147.2+6.3
    Labor hold Swing −6.3

    Angas

    This section is an excerpt from Electoral results for the Division of Angas (1949–1977) § 1949
    1975 Australian federal election: Angas [5]
    PartyCandidateVotes%±%
    Liberal Geoffrey Giles 37,28168.1+15.0
    Labor Adolf Thiel14,97726.9−3.0
    Liberal Movement Giordano Graziani2,2554.0+0.3
    Workers Richard Philippe5611.0+1.0
    Total formal votes55,74498.1
    Informal votes1,1091.9
    Turnout 56,88396.3
    Two-party-preferred result
    Liberal Geoffrey Giles 71.5+4.0
    Labor Adolf Thiel28.5−4.0
    Liberal hold Swing +4.0

    Barker

    This section is an excerpt from Electoral results for the Division of Barker § 1975
    1975 Australian federal election: Barker
    PartyCandidateVotes%±%
    Liberal James Porter 36,89458.5+10.0
    Labor Graham Bath19,33430.6−1.6
    National Country Kenneth Williams4,0706.4−5.0
    Liberal Movement Rodney Roberts2,1763.4−3.1
    Independent Lily Bayly6301.0+1.0
    Total formal votes63,10498.0
    Informal votes1,3052.0
    Turnout 64,40997.0
    Two-party-preferred result
    Liberal James Porter 67.3+2.1
    Labor Graham Bath32.7−2.1
    Liberal hold Swing +2.1

    Bonython

    This section is an excerpt from Electoral results for the Division of Bonython § 1975
    1975 Australian federal election: Bonython
    PartyCandidateVotes%±%
    Labor Martin Nicholls 41,36350.7−9.7
    Liberal Alan Irving30,56837.4+16.7
    Liberal Movement John Longhurst5,6056.9−1.4
    Communist Robert Durbridge4,0995.0+5.0
    Total formal votes81,63596.8
    Informal votes2,7273.2
    Turnout 84,36296.1
    Two-party-preferred result
    Labor Martin Nicholls 56.0−9.6
    Liberal Alan Irving44.0+9.6
    Labor hold Swing −9.6

    Boothby

    This section is an excerpt from Electoral results for the Division of Boothby § 1975
    1975 Australian federal election: Boothby
    PartyCandidateVotes%±%
    Liberal John McLeay 34,66458.1+13.0
    Labor Mark Pickhaver18,37630.8−3.6
    Liberal Movement Peter Berman6,17210.4−7.6
    Independent Alexander Hunter4080.7+0.7
    Total formal votes59,62098.2
    Informal votes1,0811.8
    Turnout 60,70196.0
    Two-party-preferred result
    Liberal John McLeay 66.5+5.4
    Labor Mark Pickhaver33.5−5.4
    Liberal hold Swing +5.4

    Grey

    This section is an excerpt from Electoral results for the Division of Grey § 1975
    1975 Australian federal election: Grey
    PartyCandidateVotes%±%
    Labor Laurie Wallis 28,18249.4−3.3
    Liberal Dennis Burman26,43846.4+14.2
    Liberal Movement Arnold Eckersley2,3714.2+2.6
    Total formal votes56,99197.9
    Informal votes1,2202.1
    Turnout 58,21195.3
    Two-party-preferred result
    Labor Laurie Wallis 28,77750.5−5.0
    Liberal Dennis Burman28,21449.5+5.0
    Labor hold Swing -5.0

    Hawker

    This section is an excerpt from Electoral results for the Division of Hawker § 1975
    1975 Australian federal election: Hawker
    PartyCandidateVotes%±%
    Labor Ralph Jacobi 29,03649.4−6.2
    Liberal Craig Speil25,84244.0+12.9
    Liberal Movement Stewart Leggett 3,8906.6−5.2
    Total formal votes58,76897.9
    Informal votes1,2912.1
    Turnout 60,05996.5
    Two-party-preferred result
    Labor Ralph Jacobi 29,97451.0−9.2
    Liberal Craig Speil28,79449.0+9.2
    Labor hold Swing -9.2

    Hindmarsh

    This section is an excerpt from Electoral results for the Division of Hindmarsh § 1975
    1975 Australian federal election: Hindmarsh
    PartyCandidateVotes%±%
    Labor Clyde Cameron 32,97854.4−8.5
    Liberal Valentine Dignum23,80639.3+11.7
    Liberal Movement Ian McGowan2,9824.9−2.7
    Independent Ross Stanford 8091.3+1.3
    Total formal votes60,57597.0
    Informal votes1,8573.0
    Turnout 62,43296.0
    Two-party-preferred result
    Labor Clyde Cameron 56.3−9.6
    Liberal Valentine Dignum43.7+9.6
    Labor hold Swing -9.6

    Kingston

    This section is an excerpt from Electoral results for the Division of Kingston § 1975
    1975 Australian federal election: Kingston
    PartyCandidateVotes%±%
    Liberal Grant Chapman 34,89348.3+12.5
    Labor Richard Gun 30,29641.9−11.0
    Liberal Movement Rodney Adam6,4128.9−1.2
    Workers Verna Oakley6961.0+1.0
    Total formal votes72,29798.0
    Informal votes1,4692.0
    Turnout 73,76696.7
    Two-party-preferred result
    Liberal Grant Chapman 40,93256.6+12.7
    Labor Richard Gun 31,36543.4−12.7
    Liberal gain from Labor Swing +12.7

    Port Adelaide

    This section is an excerpt from Electoral results for the Division of Port Adelaide § 1975
    1975 Australian federal election: Port Adelaide
    PartyCandidateVotes%±%
    Labor Mick Young 34,70160.1−5.2
    Liberal Terence Hanson20,28535.1+11.1
    Liberal Movement Jean Lawrie2,7344.7−1.9
    Total formal votes57,72096.5
    Informal votes2,0923.5
    Turnout 59,81296.5
    Two-party-preferred result
    Labor Mick Young 61.3−9.6
    Liberal Terence Hanson38.7+9.6
    Labor hold Swing -9.6

    Sturt

    This section is an excerpt from Electoral results for the Division of Sturt § 1975
    1975 Australian federal election: Sturt
    PartyCandidateVotes%±%
    Liberal Ian Wilson 37,08754.2+8.8
    Labor Graham Maguire 25,51037.3−6.9
    Liberal Movement Barry Lake3,8355.6−1.6
    Workers William Forster2,0433.0+3.0
    Total formal votes68,47597.9
    Informal votes1,5002.1
    Turnout 69,97597.0
    Two-party-preferred result
    Liberal Ian Wilson 60.3+8.3
    Labor Graham Maguire 39.7−8.3
    Liberal hold Swing +8.3

    Wakefield

    This section is an excerpt from Electoral results for the Division of Wakefield § 1975
    1975 Australian federal election: Wakefield
    PartyCandidateVotes%±%
    Liberal Bert Kelly 32,07066.2+16.8
    Labor Irene Krastev12,63226.1−2.8
    Liberal Movement John Lienert3,7197.7+0.5
    Total formal votes48,42198.1
    Informal votes9171.9
    Turnout 49,33896.2
    Two-party-preferred result
    Liberal Bert Kelly 72.0+4.5
    Labor Irene Krastev38.0−4.5
    Liberal hold Swing +4.5

    Western Australia

    1975 Australian federal election (Western Australia)
    Flag of Western Australia.svg
      1974 13 December 1975 1977  

    All 10 WA seats in the House of Representatives
    5 seats needed for a majority
     First partySecond party
      Fraser Malcolm BANNER.jpg Gough Whitlam headshot.jpg
    Leader Malcolm Fraser Gough Whitlam
    Party Coalition Labor
    Seats before55
    Seats won91
    Seat changeIncrease2.svg 4Decrease2.svg 4
    Popular vote357,406244,404
    Percentage58.6%40.1%
    SwingIncrease2.svg 6.5ppDecrease2.svg 6.5pp
    TPP 58.8%41.2%
    TPP swingIncrease2.svg 7.3ppDecrease2.svg 7.3pp

    Canning

    This section is an excerpt from Electoral results for the Division of Canning § 1975
    1975 Australian federal election: Canning [6]
    PartyCandidateVotes%±%
    Liberal Mel Bungey 28,00246.9+11.2
    Labor Marilyn Anthony17,91630.0−0.6
    National Country John Hallett 13,74823.0−8.7
    Total formal votes59,66697.9
    Informal votes1,2882.1
    Turnout 60,95495.8
    Two-party-preferred result
    Liberal Mel Bungey 40,72168.2+3.9
    Labor Marilyn Anthony18,94531.8+31.8
    Liberal hold Swing +3.9

    Curtin

    This section is an excerpt from Electoral results for the Division of Curtin § 1975
    1975 Australian federal election: Curtin
    PartyCandidateVotes%±%
    Liberal Victor Garland 41,90166.3+12.4
    Labor John Crouch21,25333.7−5.2
    Total formal votes63,15497.9
    Informal votes1,3712.1
    Turnout 64,52594.7
    Liberal hold Swing +7.0

    Forrest

    This section is an excerpt from Electoral results for the Division of Forrest § 1975
    1975 Australian federal election: Forrest
    PartyCandidateVotes%±%
    Liberal Peter Drummond 30,15854.7+8.0
    Labor Geoffrey Davy19,07534.6−2.6
    National Country Noel Klopper5,1349.3−5.7
    Independent Noel Duggan4840.9+0.9
    Independent Duncan Hordacre2900.5+0.5
    Total formal votes55,14197.8
    Informal votes1,2172.2
    Turnout 56,35896.7
    Two-party-preferred result
    Liberal Peter Drummond 63.8+2.4
    Labor Geoffrey Davy36.2−2.4
    Liberal hold Swing +2.4

    Fremantle

    This section is an excerpt from Electoral results for the Division of Fremantle § 1975
    1975 Australian federal election: Fremantle
    PartyCandidateVotes%±%
    Labor Kim Beazley Sr. 32,57051.6−7.8
    Liberal Leon Lapinski30,50948.4+12.5
    Total formal votes63,07997.6
    Informal votes1,5682.4
    Turnout 64,64795.5
    Labor hold Swing -9.0

    Kalgoorlie

    This section is an excerpt from Electoral results for the Division of Kalgoorlie § 1975
    1975 Australian federal election: Kalgoorlie
    PartyCandidateVotes%±%
    Liberal Mick Cotter 25,99451.7+9.8
    Labor Fred Collard 22,73445.2−5.1
    Workers Graham Mills1,5383.1+3.1
    Total formal votes50,26697.9
    Informal votes1,0552.1
    Turnout 51,32189.8
    Two-party-preferred result
    Liberal Mick Cotter 54.2+6.3
    Labor Fred Collard 45.8−6.3
    Liberal gain from Labor Swing +6.3

    Moore

    This section is an excerpt from Electoral results for the Division of Moore § 1975
    1975 Australian federal election: Moore
    PartyCandidateVotes%±%
    Liberal John Hyde 38,84556.0+20.5
    Labor Allen Blanchard 21,23030.6−6.5
    National Country Graham Anderson9,31213.4−12.7
    Total formal votes69,38797.8
    Informal votes1,5832.2
    Turnout 70,97095.3
    Two-party-preferred result
    Liberal John Hyde 67.2+6.7
    Labor Allen Blanchard 32.8−6.7
    Liberal hold Swing +6.7

    Perth

    This section is an excerpt from Electoral results for the Division of Perth § 1975
    1975 Australian federal election: Perth
    PartyCandidateVotes%±%
    Liberal Ross McLean 31,65850.7+13.0
    Labor Joe Berinson 29,90247.9−8.6
    Communist Vic Slater8901.4+0.5
    Total formal votes62,45097.1
    Informal votes1,8452.9
    Turnout 64,29594.3
    Two-party-preferred result
    Liberal Ross McLean 50.8+9.0
    Labor Joe Berinson 49.2−9.0
    Liberal gain from Labor Swing +9.0

    Stirling

    This section is an excerpt from Electoral results for the Division of Stirling § 1975
    1975 Australian federal election: Stirling
    PartyCandidateVotes%±%
    Liberal Ian Viner 34,02157.9+11.6
    Labor Graham Reece23,07339.3−8.3
    Workers Brian Butterworth1,6432.8+2.8
    Total formal votes58,73798.1
    Informal votes1,1511.9
    Turnout 59,88895.3
    Two-party-preferred result
    Liberal Ian Viner 59.3+9.3
    Labor Graham Reece40.7−9.3
    Liberal hold Swing +9.3

    Swan

    This section is an excerpt from Electoral results for the Division of Swan § 1975
    1975 Australian federal election: Swan
    PartyCandidateVotes%±%
    Liberal John Martyr 30,91448.8+9.9
    Labor Adrian Bennett 29,95447.2−6.1
    National Country Peter Masson2,5334.0−2.6
    Total formal votes63,40197.3
    Informal votes1,7482.7
    Turnout 65,14994.3
    Two-party-preferred result
    Liberal John Martyr 33,02952.1+7.7
    Labor Adrian Bennett 30,37247.9−7.7
    Liberal gain from Labor Swing +7.7

    Tangney

    This section is an excerpt from Electoral results for the Division of Tangney § 1975
    1975 Australian federal election: Tangney
    PartyCandidateVotes%±%
    Liberal Peter Richardson 34,67754.4+12.8
    Labor John Dawkins 26,69741.9−8.7
    Workers Warwick Agnew2,3953.8+3.8
    Total formal votes63,76997.7
    Informal votes1,5082.3
    Turnout 65,27794.8
    Two-party-preferred result
    Liberal Peter Richardson 56.6+9.7
    Labor John Dawkins 43.4−9.7
    Liberal gain from Labor Swing +9.7

    Tasmania

    1975 Australian federal election (Tasmania)
    Flag of Tasmania.svg
      1974 13 December 1975 1977  

    All 5 Tasmanian seats in the House of Representatives
    3 seats needed for a majority
     First partySecond party
      Fraser Malcolm BANNER.jpg Gough Whitlam headshot.jpg
    Leader Malcolm Fraser Gough Whitlam
    Party Coalition Labor
    Seats before05
    Seats won50
    Seat changeIncrease2.svg 5Decrease2.svg 5
    Popular vote134,250105,324
    Percentage55.4%43.5%
    SwingIncrease2.svg 11.0ppDecrease2.svg 11.6pp
    TPP 55.9%44.1%
    TPP swingIncrease2.svg 11.3ppDecrease2.svg 11.3pp

    Bass

    This section is an excerpt from Electoral results for the Division of Bass § 1975
    1975 Australian federal election: Bass [7]
    PartyCandidateVotes%±%
    Liberal Kevin Newman 28,38263.1+17.1
    Labor Michael McLaughlin15,57434.6−19.4
    Workers Kevin Chaffey1,0012.2+2.2
    Total formal votes44,95798.1
    Informal votes8781.9
    Turnout 45,83596.7
    Two-party-preferred result
    Liberal Kevin Newman 64.1+18.1
    Labor Michael McLaughlin35.9−18.1
    Liberal hold Swing +18.1

    Braddon

    This section is an excerpt from Electoral results for the Division of Braddon § 1975
    1975 Australian federal election: Braddon [7]
    PartyCandidateVotes%±%
    Liberal Ray Groom 27,13152.9+8.6
    Labor Ron Davies 23,27045.4−7.9
    Workers Lance Buckingham5521.1+1.1
    National Country Barry Whiley3280.6+0.6
    Total formal votes51,28198.4
    Informal votes8461.6
    Turnout 52,12796.6
    Two-party-preferred result
    Liberal Ray Groom 53.8+8.6
    Labor Ron Davies 46.2−8.6
    Liberal gain from Labor Swing +8.6

    Denison

    This section is an excerpt from Electoral results for the Division of Denison § 1975
    1975 Australian federal election: Denison [7]
    PartyCandidateVotes%±%
    Liberal Michael Hodgman 26,25353.2+6.0
    Labor John Coates 22,10444.8−8.0
    National Country John Charles Hay4961.0+1.0
    Workers Cathryn Marie Stanton4731.0+1.0
    Total formal votes49,32698.4
    Informal votes8081.6
    Turnout 50,13495.7
    Two-party-preferred result
    Liberal Michael Hodgman 54.9+7.7
    Labor John Coates 45.1−7.7
    Liberal gain from Labor Swing +7.7

    Franklin

    This section is an excerpt from Electoral results for the Division of Franklin § 1975
    1975 Australian federal election: Franklin [7]
    PartyCandidateVotes%±%
    Liberal Bruce Goodluck 23,82949.4+12.3
    Labor Ray Sherry 23,01147.7−15.2
    National Country Margaret Franklin9662.0+2.0
    National Country Joseph Hand2930.6+0.6
    Workers Peter Mollon1710.4+0.4
    Total formal votes48,27097.9
    Informal votes1,0332.1
    Turnout 49,30396.9
    Two-party-preferred result
    Liberal Bruce Goodluck 25,01051.8+14.7
    Labor Ray Sherry 23,26048.2−14.7
    Liberal gain from Labor Swing +14.7

    Wilmot

    This section is an excerpt from Electoral results for the Division of Wilmot § 1975
    1975 Australian federal election: Wilmot [7]
    PartyCandidateVotes%±%
    Liberal Max Burr 25,40752.6+5.3
    Labor Gil Duthie 21,36544.2−8.5
    National Country Robert Griffin1,1652.4+2.4
    Workers William Woods3530.7+0.7
    Total formal votes48,29098.0
    Informal votes1,0052.0
    Turnout 49,29597.2
    Two-party-preferred result
    Liberal Max Burr 55.3+8.0
    Labor Gil Duthie 44.7−8.0
    Liberal gain from Labor Swing +8.0

    Australian Capital Territory

    1975 Australian federal election (Australian Capital Territory)
    Flag of the Australian Capital Territory.svg
      1974 13 December 1975 1977  

    All 2 ACT seats in the House of Representatives
    1 seats needed for a majority
     First partySecond party
      Fraser Malcolm BANNER.jpg Gough Whitlam headshot.jpg
    Leader Malcolm Fraser Gough Whitlam
    Party Coalition Labor
    Seats before02
    Seats won11
    Seat changeIncrease2.svg 1Decrease2.svg 1
    Popular vote50,72751,744
    Percentage46.5%47.4%
    TPP 50.7%49.3%
    TPP swingIncrease2.svg 10.4ppDecrease2.svg 10.4pp

    Canberra

    This section is an excerpt from Electoral results for the Division of Canberra § 1975
    1975 Australian federal election: Canberra [8]
    PartyCandidateVotes%±%
    Liberal John Haslem 25,69749.4+13.2
    Labor Kep Enderby 23,51745.2−8.6
    Liberal Movement Tony Harris1,5723.0+3.0
    Independent Kevin Wise4340.8+0.8
    Independent John Moloney4060.8+0.8
    Workers Oleg Kavunenko3770.7+0.7
    Total formal votes52,00398.4
    Informal votes8531.6
    Turnout 52,85693.9
    Two-party-preferred result
    Liberal John Haslem 53.3+10.4
    Labor Kep Enderby 46.7−10.4
    Liberal gain from Labor Swing +10.4

    Fraser

    This section is an excerpt from Electoral results for the Division of Fraser (Australian Capital Territory) § 1975
    1975 Australian federal election: Fraser
    PartyCandidateVotes%±%
    Labor Ken Fry 28,22751.1−6.2
    Liberal George Mailath25,03045.3+10.3
    Liberal Movement Claude Hammond1,9443.5+3.5
    Total formal votes55,20198.3
    Informal votes9691.7
    Turnout 56,17094.2
    Two-party-preferred result
    Labor Ken Fry 52.0−8.7
    Liberal George Mailath48.0+8.7
    Labor hold Swing −8.7

    Northern Territory

    1975 Australian federal election (Northern Territory)
    Flag of the Northern Territory.svg
      1974 13 December 1975 1977  

    Division of Northern Territory
     First partySecond party
      Fraser Malcolm BANNER.jpg Gough Whitlam headshot.jpg
    Leader Malcolm Fraser Gough Whitlam
    Party Coalition Labor
    Seats before10
    Seats won10
    Seat changeSteady2.svgSteady2.svg
    Popular vote15,97612,944
    Percentage53.9%43.7%
    SwingIncrease2.svg 4.6ppDecrease2.svg 2.1pp
    TPP 54.9%45.1%
    TPP swingIncrease2.svg 2.2ppDecrease2.svg 1.8pp
    This section is an excerpt from Electoral results for the Division of Northern Territory § 1975
    1975 Australian federal election: Northern Territory [9]
    PartyCandidateVotes%±%
    Country Liberal Sam Calder 15,97653.9+4.6
    Labor Jock Nelson 12,94443.7−1.8
    Australia James Forbes7012.4+2.4
    Total formal votes29,62196.7
    Informal votes9963.3
    Turnout 30,61774.9
    Two-party-preferred result
    Country Liberal Sam Calder 54.9+2.2
    Labor Jock Nelson 45.1−2.2
    Country Liberal hold Swing +2.2

    See also

    Related Research Articles

    This is a list of electoral results for the Division of Adelaide in Australian federal elections from the division's creation in 1903 until the present.

    This is a list of electoral results for the Division of Northern Territory in Australian federal elections from the division's creation in 1922 until its abolition in 2001.

    This is a list of electoral results for the Division of Australian Capital Territory in Australian federal elections from the division's creation in 1949 until its abolition in 1974.

    This is a list of electoral division results for the Australian 1954 federal election.

    This is a list of electoral division results for the Australian 1946 federal election.

    This is a list of electoral division results for the Australian 1949 federal election.

    This is a list of electoral division results for the Australian 1951 federal election.

    This is a list of electoral division results for the Australian 1955 federal election.

    This is a list of electoral division results for the Australian 1958 federal election.

    This is a list of electoral division results for the Australian 1961 federal election.

    This is a list of electoral division results for the Australian 1966 federal election.

    This is a list of electoral division results for the Australian 1969 federal election.

    This is a list of electoral division results for the Australian 1972 federal election.

    This is a list of electoral division results for the Australian 1974 federal election.

    This is a list of electoral division results for the Australian 1977 federal election.

    This is a list of electoral division results for the Australian 1980 federal election.

    This is a list of electoral division results for the Australian 1983 federal election.

    <span class="mw-page-title-main">Results of the 1984 Australian federal election in New South Wales</span>

    This is a list of electoral division results for the Australian 1984 federal election in the state of New South Wales.

    <span class="mw-page-title-main">Results of the 1987 Australian federal election in New South Wales</span>

    This is a list of electoral division results for the Australian 1987 federal election in the state of New South Wales.

    <span class="mw-page-title-main">Results of the 1990 Australian federal election in New South Wales</span>

    This is a list of electoral division results for the Australian 1990 federal election in the state of New South Wales.

    References

    1. "1975 House of Representatives". Psephos Adam Carr's Election Archive. Retrieved 29 May 2022.
    2. 1 2 3 4 5 6 7 8 9 10 11 12 13 14 15 16 17 18 19 20 "1975 House of Representatives: NSW". Psephos Adam Carr's Election Archive. Retrieved 29 May 2022.
    3. 1 2 "1975 House of Representatives: Victoria". Psephos Adam Carr's Election Archive. Retrieved 29 May 2022.
    4. "1975 House of Representatives: Queensland". Psephos Adam Carr's Election Archive. Retrieved 29 May 2022.
    5. 1 2 "1975 House of Representatives: South Australia". Psephos Adam Carr's Election Archive. Retrieved 29 May 2022.
    6. "1975 House of Representatives: Western Australia". Psephos Adam Carr's Election Archive. Retrieved 29 May 2022.
    7. 1 2 3 4 5 "1975 House of Representatives: Tasmania". Psephos Adam Carr's Election Archive. Retrieved 29 May 2022.
    8. "1975 House of Representatives: Australian Capital Territory". Psephos Adam Carr's Election Archive. Retrieved 29 May 2022.
    9. "1975 House of Representatives: Northern Territory". Psephos Adam Carr's Election Archive. Retrieved 29 May 2022.