| Timeline of the 2019 Pacific typhoon season | |
|---|---|
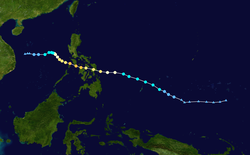
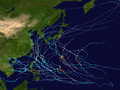
 Season summary map | |
| Season boundaries | |
| First system formed | December 31, 2018 |
| Last system dissipated | December 29, 2019 |
| Strongest system | |
| Name | Halong |
| Maximum winds | 215 km/h (130 mph) (10-minute sustained) |
| Lowest pressure | 905 hPa (mbar) |
| Longest lasting system | |
| Name | Wutip |
| Duration | 11.75 days |
The 2019 Pacific typhoon season was the annual cycle of tropical cyclone formation over the western North Pacific Ocean and the South China Sea, primarily in 2019. [1] There were no official bounds, as tropical cyclones form all year round, though most storms in the basin typically form between July and November. [2] The first tropical cyclone of the season, Tropical Storm Pabuk, developed in late December 2018; the final, Typhoon Phanfone, dissipated on December 29, 2019.
Contents
- Timeline of events
- January
- February
- March
- April
- May
- June
- July
- August
- September
- October
- November
- December
- Notes
- See also
- References
- External links
A total of 49 tropical depressions formed during the season; 29 of these developed into named tropical storms, of which 20 became severe tropical storms and 17 became typhoons. Additionally, five typhoons became super typhoons—an unofficial rank given by the United States Joint Typhoon Warning Center (JTWC) to storms with 1-minute maximum sustained wind speed of at least 240 km/h (150 mph). [3] Activity in the 2019 season was greater than normal, [nb 1] primarily due to high sea surface temperatures. El Niño conditions persisted from late 2018 to the second quarter of 2019. [1] In February, Typhoon Wutip became the strongest recorded typhoon to occur during the month. [4] The conditions became neutral during the northern summer, as strong activity occurred in the monsoon trough over Southeast Asia in August, promoting tropical cyclogenesis. In November, activity in the basin was driven by high sea surface temperatures along with an active phase of the Madden–Julian oscillation and equatorial waves. [1]
Due to several very destructive tropical cyclones, the season was the costliest ever recorded. [5] The most destructive system was Typhoon Hagibis, which inflicted damage to Japan that amounted to ¥1.88 trillion (US$17.3 billion) and killed 118 people, [6] [7] becoming the costliest typhoon when unadjusted for inflation until Typhoon Doksuri in 2023. [8] In August, Typhoon Lekima struck China, becoming the second-costliest typhoon in Chinese history at the time. [5] During the next month, Typhoon Lingling impacted the Korean Peninsula and killed eight people, [9] [10] and Typhoon Faxai made landfall over Japan, becoming the costliest disaster of 2019 until Hagibis. [11] Typhoon Bualoi exacerbated the effects of Faxai and Hagibis, producing floods that caused damages of US$200 million and killed 13, despite not reaching land. [12] [13] The last two named storms, typhoons Kammuri and Phanfone, each made landfalls over the Philippines in December, causing ₱11.027 billion (US$212.910 million) of damages and 74 deaths combined. [14] [15]
The Japan Meteorological Agency (JMA) is the official Regional Specialized Meteorological Center for the Western Pacific Basin. As such, it is responsible for assigning names to all tropical cyclones that reach 10-minute maximum sustained winds of at least 65 kilometers per hour (40 miles per hour) in the region. [1] The PAGASA assigns names to tropical cyclones that form or enter their area of responsibility as a tropical depression or stronger, regardless if the cyclone has been assigned a name by the JMA. [14] The JTWC also monitors systems in the Western Pacific Basin, assigning systems a number with a "W" suffix if the system is a tropical depression or stronger. This timeline includes information from post-storm reviews by the JMA and the JTWC, as well as naming from the PAGASA. It documents tropical cyclone formations, strengthening, weakening, landfalls, extratropical transition, and dissipations during the season. Reports among warning centers often differ; therefore, information from both agencies has been included.