Main article: 2020 New Hampshire House of Representatives election
| ||||||||||||||||||||||||||||||||||
All 400 seats in the New Hampshire House of Representatives 201 seats needed for a majority | ||||||||||||||||||||||||||||||||||
|---|---|---|---|---|---|---|---|---|---|---|---|---|---|---|---|---|---|---|---|---|---|---|---|---|---|---|---|---|---|---|---|---|---|---|
| ||||||||||||||||||||||||||||||||||
| ||||||||||||||||||||||||||||||||||
| |||||||||||||||||||||||||||||||
All 400 seats in the New Hampshire House of Representatives 201 seats needed for a majority | |||||||||||||||||||||||||||||||
|---|---|---|---|---|---|---|---|---|---|---|---|---|---|---|---|---|---|---|---|---|---|---|---|---|---|---|---|---|---|---|---|
| |||||||||||||||||||||||||||||||
| |||||||||||||||||||||||||||||||
| Elections in New Hampshire |
|---|
 |
| Party | Candidate | Votes | % | |
|---|---|---|---|---|
| Republican | Tom Ploszaj | 1,338 | 60.1 | |
| Democratic | Robert Joseph Jr. | 887 | 39.9 | |
| Total votes | 2,225 | 100.0 | ||
| Republican hold | ||||
| Party | Candidate | Votes | % | |
|---|---|---|---|---|
| Republican | Harry Bean (incumbent) | 1,673 | 24.6 | |
| Republican | Glen Aldrich (incumbent) | 1,626 | 23.9 | |
| Republican | Norm Silber | 1,356 | 19.9 | |
| Republican | Jonathan Mackie (incumbent) | 1,082 | 15.9 | |
| Republican | Deanna Jurius (incumbent) | 1,074 | 15.8 | |
| Total votes | 6,811 | 100.0 | ||
| Party | Candidate | Votes | % | |
|---|---|---|---|---|
| Republican | Glen Aldrich (incumbent) | 4,761 | 14.2 | |
| Republican | Harry Bean (incumbent) | 4,736 | 14.1 | |
| Republican | Norm Silber | 4,490 | 13.4 | |
| Republican | Jonathan Mackie (incumbent) | 4,378 | 13.1 | |
| Democratic | Natalie Taylor | 3,956 | 11.8 | |
| Democratic | Shelley Carita | 3,865 | 11.5 | |
| Democratic | Diane Hanley | 3,818 | 11.4 | |
| Democratic | Dara McCue | 3,482 | 10.4 | |
| Total votes | 33,486 | 100.0 | ||
| Republican hold | ||||
| Republican hold | ||||
| Republican hold | ||||
| Republican hold | ||||
| Party | Candidate | Votes | % | |
|---|---|---|---|---|
| Democratic | Marcia Hayward | 1,113 | 25.4 | |
| Democratic | David Huot (incumbent) | 1,064 | 24.3 | |
| Democratic | Gail Ober | 979 | 22.3 | |
| Democratic | Carlos Cardona | 852 | 19.4 | |
| Democratic | Samuel Hoehn | 374 | 8.5 | |
| Total votes | 4,382 | 100.0 | ||
| Party | Candidate | Votes | % | |
|---|---|---|---|---|
| Republican | Gregg Hough | 4,186 | 14.4 | |
| Republican | Mike Bordes | 4,059 | 13.9 | |
| Republican | Dawn Johnson | 3,922 | 13.5 | |
| Republican | Richard Littlefield | 3,831 | 13.2 | |
| Democratic | David Huot (incumbent) | 3,512 | 12.1 | |
| Democratic | Marcia Hayward | 3,390 | 11.6 | |
| Democratic | Gail Ober | 3,255 | 11.2 | |
| Democratic | Carlos Cardona | 2,952 | 10.1 | |
| Total votes | 29,107 | 100.0 | ||
| Republican gain from Democratic | ||||
| Republican hold | ||||
| Republican hold | ||||
| Republican hold | ||||
| Party | Candidate | Votes | % | |
|---|---|---|---|---|
| Republican | Timothy Lang (incumbent) | 2,196 | 37.7 | |
| Republican | Juliet Harvey-Bolia | 1,796 | 30.8 | |
| Democratic | Jane Alden | 1,720 | 29.5 | |
| Democratic | Rich Burke (write-in) | 117 | 2.0 | |
| Total votes | 5,829 | 100.0 | ||
| Republican hold | ||||
| Republican hold | ||||
| Party | Candidate | Votes | % | |
|---|---|---|---|---|
| Republican | Peter Varney (incumbent) | 3,651 | 32.7 | |
| Republican | Paul Terry | 3,539 | 31.7 | |
| Democratic | Duane Hammond | 2,003 | 17.9 | |
| Democratic | Stephen Copithorne | 1,974 | 17.7 | |
| Total votes | 11,167 | 100.0 | ||
| Republican hold | ||||
| Republican hold | ||||
| Party | Candidate | Votes | % | |
|---|---|---|---|---|
| Republican | Mike Sylvia (incumbent) | 658 | 43.4 | |
| Republican | Douglas Trottier | 387 | 25.6 | |
| Republican | John Plumer (incumbent) | 239 | 15.8 | |
| Republican | Shari Lebreche | 230 | 15.2 | |
| Total votes | 1,514 | 100.0 | ||
| Party | Candidate | Votes | % | |
|---|---|---|---|---|
| Republican | Mike Sylvia (incumbent) | 2,289 | 34.2 | |
| Republican | Douglas Trottier | 2,091 | 31.3 | |
| Democratic | George Condodemetraky | 1,158 | 17.3 | |
| Democratic | Don House | 1,152 | 17.2 | |
| Total votes | 6,690 | 100.0 | ||
| Republican hold | ||||
| Republican hold | ||||
| Party | Candidate | Votes | % | |
|---|---|---|---|---|
| Republican | Barbara Comtois (incumbent) | 1,785 | 63.6 | |
| Democratic | Jane Westlake | 1,023 | 36.4 | |
| Total votes | 2,808 | 100.0 | ||
| Republican hold | ||||
| Party | Candidate | Votes | % | |
|---|---|---|---|---|
| Republican | Raymond Howard (incumbent) | 5,441 | 61.1 | |
| Democratic | Ruth Larson | 3,463 | 38.9 | |
| Total votes | 8,904 | 100.0 | ||
| Republican hold | ||||
| Party | Candidate | Votes | % | |
|---|---|---|---|---|
| Republican | Travis O'Hara | 1,693 | 63.2 | |
| Republican | Brad Kirby | 988 | 36.8 | |
| Total votes | 2,681 | 100.0 | ||
| Party | Candidate | Votes | % | |
|---|---|---|---|---|
| Republican | Travis O'Hara | 6,783 | 55.9 | |
| Democratic | Charlie St. Clair (incumbent) | 5,354 | 44.1 | |
| Total votes | 12,137 | 100.0 | ||
| Republican gain from Democratic | ||||
District 1 • District 2 • District 3 • District 4 • District 5 • District 6 • District 7 • District 8 |
| Party | Candidate | Votes | % | |
|---|---|---|---|---|
| Democratic | Anita Burroughs (incumbent) | 1,601 | 54.1 | |
| Republican | Ray Gilmore | 1,361 | 45.9 | |
| Total votes | 2,962 | 100.0 | ||
| Democratic hold | ||||
| Party | Candidate | Votes | % | |
|---|---|---|---|---|
| Democratic | Stephen Woodcock (incumbent) | 2,992 | 18.3 | |
| Democratic | Tom Buco (incumbent) | 2,918 | 17.8 | |
| Republican | Karen Umberger | 2,787 | 17.0 | |
| Democratic | Ellin Leonard | 2,638 | 16.1 | |
| Republican | Frank McCarthy | 2,545 | 15.5 | |
| Republican | Wendy Richardson | 2,483 | 15.2 | |
| Total votes | 16,363 | 100.0 | ||
| Democratic hold | ||||
| Democratic hold | ||||
| Republican gain from Democratic | ||||
| Party | Candidate | Votes | % | |
|---|---|---|---|---|
| Republican | Mark McConkey | 2,430 | 27.4 | |
| Democratic | Jerry Knirk (incumbent) | 2,244 | 25.3 | |
| Democratic | Susan Ticehurst (incumbent) | 2,233 | 25.2 | |
| Republican | Nicole Nordlund | 1,967 | 22.2 | |
| Total votes | 8,874 | 100.0 | ||
| Republican gain from Democratic | ||||
| Democratic hold | ||||
| Party | Candidate | Votes | % | |
|---|---|---|---|---|
| Republican | Glenn Cordelli (incumbent) | 3,410 | 29.1 | |
| Republican | Karel Crawford (incumbent) | 3,345 | 28.5 | |
| Democratic | Caroline Nesbitt | 2,577 | 22.0 | |
| Democratic | Chip Merrill | 2,401 | 20.5 | |
| Total votes | 11,733 | 100.0 | ||
| Republican hold | ||||
| Republican hold | ||||
| Party | Candidate | Votes | % | |
|---|---|---|---|---|
| Republican | Lino Avellani (incumbent) | 3,797 | 21.7 | |
| Republican | Bill Nelson (incumbent) | 3,793 | 21.7 | |
| Republican | Jonathan Smith | 3,458 | 19.8 | |
| Democratic | Donna Ackerman | 2,334 | 13.4 | |
| Democratic | Patricia Pustell | 2,114 | 12.1 | |
| Democratic | Knute Ogren | 1,992 | 11.4 | |
| Total votes | 17,488 | 100.0 | ||
| Republican hold | ||||
| Republican hold | ||||
| Republican hold | ||||
| Party | Candidate | Votes | % | |
|---|---|---|---|---|
| Republican | John MacDonald (incumbent) | 2,547 | 28.6 | |
| Republican | Brodie Deshaies | 2,465 | 27.7 | |
| Democratic | Carrie Duran | 1,974 | 22.2 | |
| Democratic | John Wall | 1,908 | 21.5 | |
| Total votes | 8,894 | 100.0 | ||
| Republican hold | ||||
| Republican gain from Democratic | ||||
| Party | Candidate | Votes | % | |
|---|---|---|---|---|
| Democratic | Chris McAleer | 7,401 | 54.0 | |
| Republican | Norman Tregenza | 6,301 | 46.0 | |
| Total votes | 13,702 | 100.0 | ||
| Democratic hold | ||||
| Party | Candidate | Votes | % | |
|---|---|---|---|---|
| Republican | William Marsh (incumbent) | 8,203 | 62.9 | |
| Democratic | Eve Klotz | 4,832 | 37.1 | |
| Total votes | 13,035 | 100.0 | ||
| Republican hold | ||||
District 1 • District 2 • District 3 • District 4 • District 5 • District 6 • District 7 • District 8 • District 9 • District 10 • District 11 • District 12 • District 13 • District 14 • District 15 • District 16 |
| Party | Candidate | Votes | % | |
|---|---|---|---|---|
| Democratic | Michael Abbot (incumbent) | 4,066 | 14.8 | |
| Democratic | Lucy Weber (incumbent) | 4,039 | 14.7 | |
| Democratic | Cathryn Harvey (incumbent) | 3,935 | 14.3 | |
| Democratic | Paul Berch (incumbent) | 3,902 | 14.2 | |
| Republican | Kate Day | 3,044 | 11.1 | |
| Republican | Whitney Aldrich | 2,964 | 10.8 | |
| Republican | Peter Benik | 2,815 | 10.2 | |
| Republican | Rick Merkt | 2,779 | 10.1 | |
| Total votes | 27,544 | 100.0 | ||
| Democratic hold | ||||
| Democratic hold | ||||
| Democratic hold | ||||
| Democratic hold | ||||
| Party | Candidate | Votes | % | |
|---|---|---|---|---|
| Democratic | John Mann (incumbent) | 1,169 | 54.4 | |
| Republican | Richard Nalevanko | 982 | 45.6 | |
| Total votes | 2,151 | 100.0 | ||
| Democratic hold | ||||
| Party | Candidate | Votes | % | |
|---|---|---|---|---|
| Democratic | Daniel Eaton (incumbent) | 1,130 | 53.7 | |
| Republican | Robert D'Arcy | 974 | 46.3 | |
| Total votes | 2,104 | 100.0 | ||
| Democratic hold | ||||
| Party | Candidate | Votes | % | |
|---|---|---|---|---|
| Democratic | Lawrence Welkowitz | 1,213 | 100.0 | |
| Total votes | 1,213 | 100.0 | ||
| Democratic hold | ||||
| Party | Candidate | Votes | % | |
|---|---|---|---|---|
| Democratic | John Bordenet (incumbent) | 1,664 | 68.4 | |
| Republican | Marilyn Huston | 768 | 31.6 | |
| Total votes | 2,432 | 100.0 | ||
| Democratic hold | ||||
| Party | Candidate | Votes | % | |
|---|---|---|---|---|
| Democratic | Dru Fox | 1,495 | 63.7 | |
| Republican | Kyle LaBrie | 853 | 36.3 | |
| Total votes | 2,348 | 100.0 | ||
| Democratic hold | ||||
| Party | Candidate | Votes | % | |
|---|---|---|---|---|
| Democratic | Sparky Von Plinsky (incumbent) | 1,693 | 64.5 | |
| Republican | Robert Call | 934 | 35.5 | |
| Total votes | 2,627 | 100.0 | ||
| Democratic hold | ||||
| Party | Candidate | Votes | % | |
|---|---|---|---|---|
| Democratic | Donovan Fenton (incumbent) | 2,321 | 100.0 | |
| Total votes | 2,321 | 100.0 | ||
| Democratic hold | ||||
| Party | Candidate | Votes | % | |
|---|---|---|---|---|
| Democratic | Richard Ames (incumbent) | 2,651 | 29.5 | |
| Democratic | Douglas Ley (incumbent) | 2,475 | 27.5 | |
| Republican | Rita Mattson | 1,964 | 21.9 | |
| Republican | Leo Plante | 1,894 | 21.1 | |
| Total votes | 8,984 | 100.0 | ||
| Democratic hold | ||||
| Democratic hold | ||||
| Party | Candidate | Votes | % | |
|---|---|---|---|---|
| Democratic | Lucius Parshall | 1,163 | 51.3 | |
| Republican | Dick Thackston | 1,103 | 48.7 | |
| Total votes | 2,266 | 100.0 | ||
| Democratic hold | ||||
| Party | Candidate | Votes | % | |
|---|---|---|---|---|
| Republican | John B. Hunt (incumbent) | 2,865 | 32.8 | |
| Republican | Jim Qualey | 2,313 | 26.5 | |
| Democratic | Patricia Martin | 1,835 | 21.0 | |
| Democratic | Gene Andersen | 1,721 | 19.7 | |
| Total votes | 8,734 | 100.0 | ||
| Republican hold | ||||
| Republican hold | ||||
| Party | Candidate | Votes | % | |
|---|---|---|---|---|
| Democratic | Jennie Gomarlo (incumbent) | 2,343 | 29.7 | |
| Democratic | Barry Faulkner (incumbent) | 1,926 | 24.4 | |
| Republican | Sly Karasinski | 1,836 | 23.3 | |
| Republican | Stephen Malone | 1,776 | 22.5 | |
| Total votes | 7,881 | 100.0 | ||
| Democratic hold | ||||
| Democratic hold | ||||
| Party | Candidate | Votes | % | |
|---|---|---|---|---|
| Democratic | Natalie Quevedo | 257 | 57.8 | |
| Democratic | Henry Parkhurst (incumbent) | 188 | 42.2 | |
| Total votes | 445 | 100.0 | ||
| Party | Candidate | Votes | % | |
|---|---|---|---|---|
| Republican | Ben Kilanski | 994 | 51.5 | |
| Democratic | Natalie Quevedo | 935 | 48.5 | |
| Total votes | 1,929 | 100.0 | ||
| Republican gain from Democratic | ||||
| Party | Candidate | Votes | % | |
|---|---|---|---|---|
| Republican | Matthew Santonastaso | 1,063 | 58.9 | |
| Republican | Franklin Sterling Jr. | 742 | 41.1 | |
| Total votes | 1,805 | 100.0 | ||
| Party | Candidate | Votes | % | |
|---|---|---|---|---|
| Republican | Matthew Santonastaso | 4,926 | 52.2 | |
| Democratic | Andrew Maneval | 4,516 | 47.8 | |
| Total votes | 9,442 | 100.0 | ||
| Republican gain from Democratic | ||||
| Party | Candidate | Votes | % | |
|---|---|---|---|---|
| Republican | Jennifer Rhodes | 4,278 | 50.3 | |
| Democratic | Bruce Tatro (incumbent) | 4,227 | 49.7 | |
| Total votes | 8,505 | 100.0 | ||
| Republican gain from Democratic | ||||
| Party | Candidate | Votes | % | |
|---|---|---|---|---|
| Democratic | Joe Schapiro (incumbent) | 1,853 | 37.6 | |
| Democratic | Amanda Toll | 1,588 | 32.3 | |
| Democratic | William Pearson (incumbent) | 1,077 | 21.9 | |
| Democratic | Ryan Meehan | 405 | 8.2 | |
| Total votes | 4,923 | 100.0 | ||
| Party | Candidate | Votes | % | |
|---|---|---|---|---|
| Republican | Matt Roach | 425 | 29.9 | |
| Republican | Jerry Sickels | 413 | 29.1 | |
| Republican | Ian Freeman | 299 | 21.1 | |
| Republican | Varrin Swearingen | 282 | 19.9 | |
| Total votes | 1,419 | 100.0 | ||
| Party | Candidate | Votes | % | |
|---|---|---|---|---|
| Democratic | Joe Schapiro (incumbent) | 7,465 | 35.1 | |
| Democratic | Amanda Toll | 7,412 | 34.9 | |
| Republican | Matt Roach | 3,444 | 16.2 | |
| Republican | Jerry Sickels | 2,944 | 13.8 | |
| Total votes | 31,265 | 100.0 | ||
| Democratic hold | ||||
| Democratic hold | ||||
District 1 • District 2 • District 3 • District 4 • District 5 • District 6 • District 7 |
| Party | Candidate | Votes | % | |
|---|---|---|---|---|
| Republican | Donald Dostie | 1,952 | 39.4 | |
| Republican | Dennis Thompson | 1,370 | 27.7 | |
| Democratic | Bob Baker | 939 | 19.0 | |
| Democratic | Bernice Christianson | 688 | 13.9 | |
| Total votes | 100.0 | |||
| Republican hold | ||||
| Republican hold | ||||
| Party | Candidate | Votes | % | |
|---|---|---|---|---|
| Republican | Arnold Davis | 1,380 | 62.2 | |
| Democratic | Christopher Roberge | 839 | 37.8 | |
| Total votes | 2,219 | 100.0 | ||
| Republican gain from Democratic | ||||
| Party | Candidate | Votes | % | |
|---|---|---|---|---|
| Democratic | Larry Laflamme (incumbent) | 2,129 | 20.6 | |
| Republican | Robert Theberge | 1,971 | 19.1 | |
| Democratic | Eamon Kelly | 1,768 | 17.1 | |
| Democratic | Henry Noel (incumbent) | 1,712 | 16.6 | |
| Republican | Mark Evans | 1,560 | 15.1 | |
| Republican | Stuart Light | 1,206 | 11.7 | |
| Total votes | 10,346 | 100.0 | ||
| Democratic hold | ||||
| Republican gain from Democratic | ||||
| Democratic hold | ||||
| Party | Candidate | Votes | % | |
|---|---|---|---|---|
| Republican | Kevin Craig (incumbent) | 1,165 | 53.1 | |
| Democratic | Evalyn Merrick | 1,029 | 46.9 | |
| Total votes | 2,194 | 100.0 | ||
| Republican hold | ||||
| Party | Candidate | Votes | % | |
|---|---|---|---|---|
| Democratic | Edith Tucker (incumbent) | 1,413 | 52.0 | |
| Republican | John Greer | 1,305 | 48.0 | |
| Total votes | 2,718 | 100.0 | ||
| Democratic hold | ||||
| Party | Candidate | Votes | % | |
|---|---|---|---|---|
| Democratic | William Hatch (incumbent) | 1,307 | 100.0 | |
| Total votes | 1,307 | 100.0 | ||
| Democratic hold | ||||
| Party | Candidate | Votes | % | |
|---|---|---|---|---|
| Republican | Troy Merner (incumbent) | 4,344 | 61.9 | |
| Democratic | Gregor Stocks | 2,678 | 38.1 | |
| Total votes | 7,022 | 100.0 | ||
| Republican hold | ||||
District 1 • District 2 • District 3 • District 4 • District 5 • District 6 • District 7 • District 8 • District 9 • District 10 • District 11 • District 12 • District 13 • District 14 • District 15 • District 16 • District 17 |
| Party | Candidate | Votes | % | |
|---|---|---|---|---|
| Democratic | Linda Massimilla (incumbent) | 2,364 | 28.3 | |
| Republican | Joseph DePalma | 2,161 | 25.9 | |
| Democratic | Sally Sherrard | 1,951 | 23.3 | |
| Republican | Calvin Beaulier | 1,883 | 22.5 | |
| Total votes | 8,359 | 100.0 | ||
| Democratic hold | ||||
| Republican hold | ||||
| Party | Candidate | Votes | % | |
|---|---|---|---|---|
| Democratic | Timothy Egan (incumbent) | 1,522 | 52.2 | |
| Republican | Robert Peraino | 1,392 | 47.8 | |
| Total votes | 2,914 | 100.0 | ||
| Democratic hold | ||||
| Party | Candidate | Votes | % | |
|---|---|---|---|---|
| Democratic | Dennis Ruprecht (incumbent) [lower-alpha 2] | 1,601 | 53.4 | |
| Republican | Wes Chapmon | 1,397 | 46.6 | |
| Total votes | 2,998 | 100.0 | ||
| Democratic hold | ||||
| Party | Candidate | Votes | % | |
|---|---|---|---|---|
| Republican | Rick Ladd (incumbent) | 1,405 | 68.1 | |
| Democratic | Don Locasio | 659 | 31.9 | |
| Total votes | 2,064 | 100.0 | ||
| Republican hold | ||||
| Party | Candidate | Votes | % | |
|---|---|---|---|---|
| Republican | Bonnie Ham | 239 | 63.2 | |
| Republican | Paul Schirduan | 139 | 36.8 | |
| Total votes | 378 | 100.0 | ||
| Party | Candidate | Votes | % | |
|---|---|---|---|---|
| Republican | Bonnie Ham | 1,068 | 52.1 | |
| Democratic | Jerry Stringham (incumbent) | 981 | 47.9 | |
| Total votes | 2,049 | 100.0 | ||
| Republican gain from Democratic | ||||
| Party | Candidate | Votes | % | |
|---|---|---|---|---|
| Republican | Gail Sanborn | 1,748 | 54.9 | |
| Democratic | Kevin Maes (incumbent) | 1,437 | 45.1 | |
| Total votes | 3,185 | 100.0 | ||
| Republican gain from Democratic | ||||
| Party | Candidate | Votes | % | |
|---|---|---|---|---|
| Democratic | Richard Osborne (incumbent) | 313 | 80.5 | |
| Democratic | Konner Bird | 76 | 19.5 | |
| Total votes | 389 | 100.0 | ||
| Party | Candidate | Votes | % | |
|---|---|---|---|---|
| Republican | Mark Alliegro | 1,064 | 51.3 | |
| Democratic | Richard Osborne (incumbent) | 1,012 | 48.7 | |
| Total votes | 2,076 | 100.0 | ||
| Republican gain from Democratic | ||||
| Party | Candidate | Votes | % | |
|---|---|---|---|---|
| Democratic | Suzanne Smith (incumbent) | 2,989 | 21.0 | |
| Democratic | Sallie Fellows (incumbent) | 2,852 | 20.1 | |
| Democratic | Joyce Weston (incumbent) | 2,788 | 19.6 | |
| Republican | Mike McLaughlin | 2,024 | 14.2 | |
| Republican | George Kirk | 1,833 | 12.9 | |
| Republican | Steven Benedetto | 1,724 | 12.1 | |
| Total votes | 14,210 | 100.0 | ||
| Democratic hold | ||||
| Democratic hold | ||||
| Democratic hold | ||||
| Party | Candidate | Votes | % | |
|---|---|---|---|---|
| Republican | Ned Gordon (incumbent) | 1,175 | 69.7 | |
| Republican | Lex Berezhny | 345 | 20.5 | |
| Republican | Tejasinha Sivalingam | 166 | 9.8 | |
| Total votes | 1,686 | 100.0 | ||
| Party | Candidate | Votes | % | |
|---|---|---|---|---|
| Democratic | Catherine Mulholland | 645 | 47.5 | |
| Democratic | Carolyn Fluehr-Lobban | 435 | 32.0 | |
| Democratic | Richard Lobban Jr. | 278 | 20.5 | |
| Total votes | 1,358 | 100.0 | ||
| Party | Candidate | Votes | % | |
|---|---|---|---|---|
| Republican | Ned Gordon (incumbent) | 3,507 | 36.3 | |
| Republican | Lex Berezhny | 2,316 | 24.0 | |
| Democratic | Catherine Mulholland | 2,007 | 20.8 | |
| Democratic | Carolyn Fluehr-Lobban | 1,826 | 18.9 | |
| Total votes | 100.0 | |||
| Republican hold | ||||
| Republican hold | ||||
| Party | Candidate | Votes | % | |
|---|---|---|---|---|
| Democratic | Roger Dontonville (incumbent) | 1,949 | 100.0 | |
| Total votes | 1,949 | 100.0 | ||
| Democratic hold | ||||
| Party | Candidate | Votes | % | |
|---|---|---|---|---|
| Republican | Beth Folsom | 1,456 | 51.8 | |
| Democratic | Timothy Josephson (incumbent) | 1,354 | 48.2 | |
| Total votes | 2,810 | 100.0 | ||
| Republican gain from Democratic | ||||
| Party | Candidate | Votes | % | |
|---|---|---|---|---|
| Democratic | Sharon Nordgren (incumbent) | 2,094 | 21.3 | |
| Democratic | Russell Muirhead | 1,488 | 15.1 | |
| Democratic | Mary Hakken-Phillips | 1,272 | 12.9 | |
| Democratic | James Murphy | 1,151 | 11.7 | |
| Democratic | Brittney Joyce | 1,125 | 11.4 | |
| Democratic | Riley Gordon | 976 | 9.9 | |
| Democratic | Orian Welling | 710 | 7.2 | |
| Democratic | Joanna Jaspersohn | 625 | 6.4 | |
| Democratic | Victoria Xiao | 402 | 4.1 | |
| Total votes | 100.0 | |||
| Party | Candidate | Votes | % | |
|---|---|---|---|---|
| Democratic | Sharon Nordgren (incumbent) | 6,311 | 25.4 | |
| Democratic | Russell Muirhead | 6,252 | 25.1 | |
| Democratic | Mary Hakken-Phillips | 6,228 | 25.0 | |
| Democratic | James Murphy | 6,085 | 24.5 | |
| Total votes | 24,876 | 100.0 | ||
| Democratic hold | ||||
| Democratic hold | ||||
| Democratic hold | ||||
| Democratic hold | ||||
| Party | Candidate | Votes | % | |
|---|---|---|---|---|
| Democratic | Susan Almy (incumbent) | 5,466 | 21.7 | |
| Democratic | George Sykes (incumbent) | 5,352 | 21.2 | |
| Democratic | Laurel Stavis (incumbent) | 5,122 | 20.3 | |
| Democratic | Richard Abel (incumbent) | 5,082 | 20.2 | |
| Republican | Joshua Flanders | 2,177 | 8.6 | |
| Republican | Michael Balog | 1,998 | 7.9 | |
| Total votes | 25,197 | 100.0 | ||
| Democratic hold | ||||
| Democratic hold | ||||
| Democratic hold | ||||
| Democratic hold | ||||
| Party | Candidate | Votes | % | |
|---|---|---|---|---|
| Republican | Matthew Simon | 4,050 | 54.2 | |
| Democratic | Elaine French (incumbent) | 3,420 | 45.8 | |
| Total votes | 7,470 | 100.0 | ||
| Republican gain from Democratic | ||||
| Party | Candidate | Votes | % | |
|---|---|---|---|---|
| Republican | David W. Binford | 782 | 68.0 | |
| Republican | Tom Friel | 368 | 32.0 | |
| Total votes | 1,150 | 100.0 | ||
| Party | Candidate | Votes | % | |
|---|---|---|---|---|
| Republican | David Binford | 2,774 | 55.0 | |
| Democratic | Ed Rajsteter | 2,268 | 45.0 | |
| Total votes | 5,042 | 100.0 | ||
| Republican gain from Democratic | ||||
| Party | Candidate | Votes | % | |
|---|---|---|---|---|
| Republican | Jeffrey Greeson | 3,018 | 50.9 | |
| Democratic | Francesca Diggs (incumbent) | 2,914 | 49.1 | |
| Total votes | 5,932 | 100.0 | ||
| Republican gain from Democratic | ||||
| Party | Candidate | Votes | % | |
|---|---|---|---|---|
| Democratic | Joshua Adjutant (incumbent) | 4,096 | 50.4 | |
| Republican | Kendall Hughes | 4,038 | 49.6 | |
| Total votes | 8,134 | 100.0 | ||
| Democratic hold | ||||
District 1 • District 2 • District 3 • District 4 • District 5 • District 6 • District 7 • District 8 • District 9 • District 10 • District 11 • District 12 • District 13 • District 14 • District 15 • District 16 • District 17 • District 18 • District 19 • District 20 • District 21 • District 22 • District 23 • District 24 • District 25 • District 26 • District 27 • District 28 • District 29 • District 30 • District 31 • District 32 • District 33 • District 34 • District 35 • District 36 • District 37 • District 38 • District 39 • District 40 • District 41 • District 42 • District 43 • District 44 • District 45 |
| Party | Candidate | Votes | % | |
|---|---|---|---|---|
| Republican | Jim Fedolfi (incumbent) | 2,458 | 28.0 | |
| Democratic | Marjorie Porter (incumbent) | 2,229 | 25.4 | |
| Republican | John Valera | 2,183 | 24.9 | |
| Democratic | Susanne White | 1,914 | 21.8 | |
| Total votes | 8,784 | 100.0 | ||
| Republican hold | ||||
| Democratic hold | ||||
| Party | Candidate | Votes | % | |
|---|---|---|---|---|
| Republican | Keith Erf (incumbent) | 3,440 | 21.1 | |
| Republican | Leah Cushman | 3,402 | 20.9 | |
| Republican | Gary Hopper (incumbent) | 3,285 | 20.2 | |
| Democratic | Jennifer Paveglio | 2,443 | 15.0 | |
| Democratic | Robert Girard | 1,881 | 11.6 | |
| Democratic | Rachel Cisto | 1,827 | 11.2 | |
| Total votes | 16,278 | 100.0 | ||
| Republican hold | ||||
| Republican hold | ||||
| Republican hold | ||||
| Party | Candidate | Votes | % | |
|---|---|---|---|---|
| Democratic | Dan Pickering (incumbent) | 1,698 | 56.1 | |
| Republican | David Bedard | 1,330 | 43.9 | |
| Total votes | 3,028 | 100.0 | ||
| Democratic hold | ||||
| Party | Candidate | Votes | % | |
|---|---|---|---|---|
| Republican | Jim Kofalt | 2,675 | 25.7 | |
| Republican | Lisa Post | 2,644 | 25.4 | |
| Democratic | Jennifer Bernet (incumbent) | 2,627 | 25.2 | |
| Democratic | Kermit Williams (incumbent) | 2,479 | 23.4 | |
| Total votes | 10,425 | 100.0 | ||
| Republican gain from Democratic | ||||
| Republican gain from Democratic | ||||
| Party | Candidate | Votes | % | |
|---|---|---|---|---|
| Republican | William Foster | 2,638 | 25.7 | |
| Republican | Gerald Griffin | 2,618 | 25.5 | |
| Democratic | David Woodbury (incumbent) | 2,522 | 24.6 | |
| Democratic | Donna Mombourquette (incumbent) | 2,487 | 24.2 | |
| Total votes | 10,265 | 100.0 | ||
| Republican gain from Democratic | ||||
| Republican gain from Democratic | ||||
| Party | Candidate | Votes | % | |
|---|---|---|---|---|
| Republican | Barbara Griffin (incumbent) | 1,043 | 15.4 | |
| Republican | Joe Alexander Jr. (incumbent) | 993 | 14.6 | |
| Republican | Fred Plett (incumbent) | 967 | 14.3 | |
| Republican | Michael Gunski (incumbent) | 961 | 14.2 | |
| Republican | Claire Rouillard | 862 | 12.7 | |
| Republican | Anthony Pugh | 617 | 9.1 | |
| Republican | John Stafford | 606 | 8.9 | |
| Republican | Frank Hobbs | 497 | 7.3 | |
| Republican | Rick Kardos | 240 | 3.5 | |
| Total votes | 6,786 | 100.0 | ||
| Party | Candidate | Votes | % | |
|---|---|---|---|---|
| Republican | Joe Alexander (incumbent) | 4,816 | 11.5 | |
| Republican | Michael Gunski (incumbent) | 4,721 | 11.3 | |
| Republican | Barbara Griffin (incumbent) | 4,717 | 11.3 | |
| Republican | Claire Rouillard | 4,434 | 10.6 | |
| Republican | Fred Plett (incumbent) | 4,298 | 10.3 | |
| Democratic | Jim Craig | 3,967 | 9.5 | |
| Democratic | Judi Lanza | 3,922 | 9.4 | |
| Democratic | Melanie Renfrew-Hebert | 3,689 | 8.8 | |
| Democratic | Richard Bruno | 3,680 | 8.8 | |
| Democratic | Robin McCune | 3,641 | 8.7 | |
| Total votes | 41,885 | 100.0 | ||
| Republican hold | ||||
| Republican hold | ||||
| Republican hold | ||||
| Republican gain from Democratic | ||||
| Republican hold | ||||
| Party | Candidate | Votes | % | |
|---|---|---|---|---|
| Republican | Linda Gould (incumbent) | 1,907 | 15.4 | |
| Republican | Niki Kelsey | 1,852 | 15.0 | |
| Republican | David Danielson (incumbent) | 1,680 | 13.6 | |
| Republican | Stephen Kenda | 1,594 | 12.9 | |
| Republican | Ted Gorski | 1,477 | 11.9 | |
| Republican | John Graham (incumbent) | 1,456 | 11.8 | |
| Republican | Britton Albiston | 1,342 | 10.8 | |
| Republican | Phil Greazzo | 1,072 | 8.7 | |
| Total votes | 12,380 | 100.0 | ||
| Party | Candidate | Votes | % | |
|---|---|---|---|---|
| Republican | Linda Gould (incumbent) | 7,241 | 9.7 | |
| Republican | Niki Kelsey | 7,079 | 9.5 | |
| Republican | John Graham (incumbent) | 6,907 | 9.3 | |
| Democratic | Sue Mullen (incumbent) | 6,896 | 9.3 | |
| Republican | David Danielson (incumbent) | 6,890 | 9.3 | |
| Republican | Ted Gorski | 6,747 | 9.1 | |
| Republican | Stephen Kenda | 6,370 | 8.6 | |
| Democratic | Daniel Dong | 5,717 | 7.7 | |
| Democratic | Catherine Rombeau | 5,488 | 7.4 | |
| Democratic | Shana Potvin | 5,207 | 7.0 | |
| Democratic | Emma Paradis | 5,188 | 7.0 | |
| Democratic | Cheri Schmitt | 4,771 | 6.4 | |
| Total votes | 74,501 | 100.0 | ||
| Republican hold | ||||
| Republican hold | ||||
| Republican hold | ||||
| Democratic hold | ||||
| Republican hold | ||||
| Republican hold | ||||
| Party | Candidate | Votes | % | |
|---|---|---|---|---|
| Democratic | Diane Langley (incumbent) | 714 | 34.1 | |
| Democratic | Jeff Goley (incumbent) | 694 | 33.2 | |
| Democratic | Christine Seibert | 685 | 32.7 | |
| Total votes | 2,093 | 100.0 | ||
| Party | Candidate | Votes | % | |
|---|---|---|---|---|
| Democratic | Diane Langley (incumbent) | 2,771 | 27.9 | |
| Democratic | Jeff Goley (incumbent) | 2,757 | 27.8 | |
| Republican | Paul DiIulio | 2,257 | 22.8 | |
| Republican | Dan Goldner | 2,129 | 21.5 | |
| Total votes | 9,914 | 100.0 | ||
| Democratic hold | ||||
| Democratic hold | ||||
| Party | Candidate | Votes | % | |
|---|---|---|---|---|
| Democratic | Linda DiSilvestro (incumbent) | 2,711 | 31.0 | |
| Democratic | Iz Piedra (incumbent) | 2,292 | 26.3 | |
| Republican | Tyler Chase | 1,925 | 22.0 | |
| Republican | Doug Whitfield | 1,805 | 20.7 | |
| Total votes | 8,733 | 100.0 | ||
| Democratic hold | ||||
| Democratic hold | ||||
| Party | Candidate | Votes | % | |
|---|---|---|---|---|
| Democratic | Pat Long (incumbent) | 381 | 42.0 | |
| Democratic | Jean Jeudy (incumbent) | 323 | 35.6 | |
| Democratic | Ron Shaw | 204 | 22.5 | |
| Total votes | 908 | 100.0 | ||
| Party | Candidate | Votes | % | |
|---|---|---|---|---|
| Democratic | Jean Jeudy (incumbent) | 1,891 | 38.1 | |
| Democratic | Pat Long (incumbent) | 1,867 | 37.6 | |
| Republican | Holly Beene | 1,210 | 24.4 | |
| Total votes | 4,968 | 100.0 | ||
| Democratic hold | ||||
| Democratic hold | ||||
| Party | Candidate | Votes | % | |
|---|---|---|---|---|
| Democratic | Nicole Klein-Knight (incumbent) | 411 | 49.3 | |
| Democratic | Donald Bouchard (incumbent) | 315 | 37.8 | |
| Democratic | James Webb | 107 | 12.9 | |
| Total votes | 833 | 100.0 | ||
| Party | Candidate | Votes | % | |
|---|---|---|---|---|
| Democratic | Nicole Klein-Knight (incumbent) | 1,235 | 27.0 | |
| Democratic | Donald Bouchard (incumbent) | 1,129 | 24.6 | |
| Republican | Richard Hagala | 1,019 | 22.2 | |
| Republican | Jason Hodgdon | 1,003 | 21.9 | |
| Libertarian | Robert Daniel | 196 | 4.3 | |
| Total votes | 4,582 | 100.0 | ||
| Democratic hold | ||||
| Democratic hold | ||||
| Party | Candidate | Votes | % | |
|---|---|---|---|---|
| Democratic | Amanda Bouldin (incumbent) | 347 | 43.9 | |
| Democratic | Andrew Bouldin (incumbent) | 320 | 40.5 | |
| Democratic | Marcus Ponce de Leon | 123 | 15.6 | |
| Total votes | 790 | 100.0 | ||
| Party | Candidate | Votes | % | |
|---|---|---|---|---|
| Democratic | Amanda Bouldin (incumbent) | 1,583 | 32.7 | |
| Democratic | Andrew Bouldin (incumbent) | 1,435 | 29.7 | |
| Republican | Sharon Poisson | 949 | 19.6 | |
| Republican | Constance Spencer | 868 | 18.0 | |
| Total votes | 4,835 | 100.0 | ||
| Democratic hold | ||||
| Democratic hold | ||||
| Party | Candidate | Votes | % | |
|---|---|---|---|---|
| Republican | Larry Gagne (incumbent) | 2,557 | 27.4 | |
| Republican | William Infantine | 2,432 | 26.0 | |
| Democratic | Christy Hamilton | 2,215 | 23.7 | |
| Democratic | Darryl Dion | 2,136 | 22.9 | |
| Total votes | 9,340 | 100.0 | ||
| Republican hold | ||||
| Republican gain from Democratic | ||||
| Party | Candidate | Votes | % | |
|---|---|---|---|---|
| Democratic | Mary Freitas (incumbent) | 1,965 | 30.2 | |
| Democratic | Mary Heath (incumbent) | 1,726 | 26.6 | |
| Republican | Brian Cole | 1,475 | 22.7 | |
| Republican | Steve Focht | 1,335 | 20.5 | |
| Total votes | 6,501 | 100.0 | ||
| Democratic hold | ||||
| Democratic hold | ||||
| Party | Candidate | Votes | % | |
|---|---|---|---|---|
| Republican | Mark Warden (incumbent) | 2,593 | 28.2 | |
| Democratic | Erika Conners (incumbent) | 2,486 | 27.0 | |
| Republican | Macy McNair | 2,422 | 26.3 | |
| Democratic | Tommy Katsiantonis | 1,702 | 18.5 | |
| Total votes | 9,203 | 100.0 | ||
| Democratic hold | ||||
| Republican hold | ||||
| Party | Candidate | Votes | % | |
|---|---|---|---|---|
| Democratic | Barbara Shaw (incumbent) | 2,330 | 30.6 | |
| Democratic | Joshua Query (incumbent) | 1,810 | 23.7 | |
| Republican | Robert Kliskey | 1,776 | 23.3 | |
| Republican | Steven Stefanik | 1,704 | 22.4 | |
| Total votes | 7,620 | 100.0 | ||
| Democratic hold | ||||
| Democratic hold | ||||
| Party | Candidate | Votes | % | |
|---|---|---|---|---|
| Democratic | Heidi Hamer (incumbent) | 2,096 | 28.9 | |
| Democratic | Timothy Smith (incumbent) | 1,757 | 24.3 | |
| Republican | Tammy Simmons | 1,694 | 23.4 | |
| Republican | Dan Garthwaite | 1,692 | 23.4 | |
| Total votes | 7,239 | 100.0 | ||
| Democratic hold | ||||
| Democratic hold | ||||
| Party | Candidate | Votes | % | |
|---|---|---|---|---|
| Democratic | Patricia Cornell (incumbent) | 326 | 33.0 | |
| Democratic | Willis Griffith (incumbent) | 314 | 31.8 | |
| Democratic | Sara Lachance | 194 | 19.6 | |
| Democratic | Chloe Sowers | 94 | 9.5 | |
| Democratic | Matthew Ping | 61 | 6.2 | |
| Total votes | 989 | 100.0 | ||
| Party | Candidate | Votes | % | |
|---|---|---|---|---|
| Democratic | Patricia Cornell (incumbent) | 1,985 | 32.2 | |
| Democratic | Willis Griffith (incumbent) | 1,670 | 27.1 | |
| Republican | Brian Chicoine | 1,263 | 20.5 | |
| Republican | Brittany LeClear-Ping | 1,428 | 20.2 | |
| Total votes | 6,346 | 100.0 | ||
| Democratic hold | ||||
| Democratic hold | ||||
| Party | Candidate | Votes | % | |
|---|---|---|---|---|
| Republican | Dick Marston | 494 | 48.9 | |
| Republican | Matt Whitlock | 342 | 33.9 | |
| Republican | Jamie Brassill | 174 | 17.2 | |
| Total votes | 1,010 | 100.0 | ||
| Party | Candidate | Votes | % | |
|---|---|---|---|---|
| Democratic | Kendall Snow (incumbent) | 2,354 | 28.9 | |
| Republican | Dick Marston | 1,987 | 24.4 | |
| Democratic | William Zackeroff | 1,951 | 24.0 | |
| Republican | Matt Whitlock | 1,854 | 22.8 | |
| Total votes | 8,146 | 100.0 | ||
| Democratic hold | ||||
| Republican gain from Democratic | ||||
| Party | Candidate | Votes | % | |
|---|---|---|---|---|
| Republican | Rich Lascelles (incumbent) | 3,174 | 39.8 | |
| Republican | Ralph Boehm (incumbent) | 2,673 | 33.6 | |
| Democratic | Nikki Fordey | 2,120 | 26.6 | |
| Total votes | 7,967 | 100.0 | ||
| Republican hold | ||||
| Republican hold | ||||
| Party | Candidate | Votes | % | |
|---|---|---|---|---|
| Republican | Dick Hinch (incumbent) | 2,005 | 13.1 | |
| Republican | Jeanine Notter (incumbent) | 1,979 | 12.9 | |
| Republican | Lindsay Tausch | 1,790 | 11.7 | |
| Republican | Maureen Mooney | 1,775 | 11.6 | |
| Republican | Bob Healey | 1,677 | 10.9 | |
| Republican | Jack Balcom | 1,653 | 10.8 | |
| Republican | Melissa Blasek | 1,643 | 10.7 | |
| Republican | Mary Mayville | 1,482 | 9.7 | |
| Republican | R. Brian Snow | 1,358 | 8.8 | |
| Total votes | 15,362 | 100.0 | ||
| Party | Candidate | Votes | % | |
|---|---|---|---|---|
| Republican | Jeanine Notter (incumbent) | 7,588 | 6.9 | |
| Republican | Dick Hinch (incumbent) | 7,550 | 6.9 | |
| Republican | Maureen Mooney | 7,303 | 6.7 | |
| Republican | Bob Healey | 7,282 | 6.6 | |
| Republican | Melissa Blasek | 7,073 | 6.4 | |
| Republican | Lindsay Tausch | 7,073 | 6.4 | |
| Democratic | Rosemarie Rung (incumbent) | 7,057 | 6.4 | |
| Republican | Mary Mayville | 6,916 | 6.3 | |
| Republican | Jack Balcom | 6,894 | 6.3 | |
| Democratic | Wendy Thomas (incumbent) | 6,825 | 6.2 | |
| Democratic | Nancy Murphy (incumbent) | 6,807 | 6.2 | |
| Democratic | Mackenzie Murphy | 6,671 | 6.1 | |
| Democratic | Kathryn Stack (incumbent) | 6,378 | 5.8 | |
| Democratic | Joe Sylvester | 6,257 | 5.7 | |
| Democratic | Cynthia Parente | 6,113 | 5.6 | |
| Democratic | Bryce Stack | 6,021 | 5.5 | |
| Total votes | 109,808 | 100.0 | ||
| Republican hold | ||||
| Republican hold | ||||
| Republican hold | ||||
| Republican hold | ||||
| Republican gain from Democratic | ||||
| Republican gain from Democratic | ||||
| Democratic hold | ||||
| Republican gain from Democratic | ||||
| Party | Candidate | Votes | % | |
|---|---|---|---|---|
| Democratic | Megan Murray (incumbent) | 1,268 | 34.1 | |
| Democratic | Daniel Veilleux | 919 | 24.7 | |
| Democratic | Tony Labranche | 805 | 21.7 | |
| Democratic | Theresa Cheslock | 723 | 19.5 | |
| Total votes | 3,715 | 100.0 | ||
| Party | Candidate | Votes | % | |
|---|---|---|---|---|
| Republican | Peter Hansen | 947 | 30.1 | |
| Republican | Pamela Coughlin | 813 | 25.9 | |
| Republican | Danielle Pray | 741 | 23.6 | |
| Republican | Peter Maresco | 642 | 20.4 | |
| Total votes | 3,143 | 100.0 | ||
| Party | Candidate | Votes | % | |
|---|---|---|---|---|
| Democratic | Megan Murray (incumbent) | 4,012 | 18.6 | |
| Democratic | Daniel Veilleux | 3,658 | 16.9 | |
| Democratic | Tony Labranche | 3,641 | 16.8 | |
| Republican | Peter Hansen | 3,567 | 16.5 | |
| Republican | Danielle Pray | 3,395 | 15.7 | |
| Republican | Pamela Coughlin | 3,339 | 15.5 | |
| Total votes | 21,612 | 100.0 | ||
| Democratic hold | ||||
| Democratic hold | ||||
| Democratic gain from Republican | ||||
| Party | Candidate | Votes | % | |
|---|---|---|---|---|
| Democratic | Peter Petrigno (incumbent) | 4,051 | 13.7 | |
| Republican | Bill King | 3,954 | 13.4 | |
| Republican | Vanessa Sheehan | 3,861 | 13.1 | |
| Democratic | Maria Perez | 3,822 | 12.9 | |
| Republican | Michael Thornton | 3,680 | 12.5 | |
| Democratic | Alexander Lloyd | 3,408 | 11.5 | |
| Democratic | Herb Salmon | 3,388 | 11.5 | |
| Republican | S. Tango Tourangeau | 3,373 | 11.4 | |
| Total votes | 29,537 | 100.0 | ||
| Democratic hold | ||||
| Republican hold | ||||
| Republican gain from Democratic | ||||
| Democratic hold | ||||
| Party | Candidate | Votes | % | |
|---|---|---|---|---|
| Democratic | Ivy Vann (incumbent) | 1,032 | 42.3 | |
| Democratic | Peter Leishman (incumbent) | 1,005 | 41.2 | |
| Democratic | Judy Ferstenberg | 401 | 16.5 | |
| Total votes | 2,438 | 100.0 | ||
| Party | Candidate | Votes | % | |
|---|---|---|---|---|
| Democratic | Peter Leishman (incumbent) | 2,732 | 34.7 | |
| Democratic | Ivy Vann (incumbent) | 2,604 | 33.1 | |
| Republican | Christopher Maidment | 1,361 | 17.3 | |
| Republican | David Pilcher | 1,171 | 14.9 | |
| Total votes | 7,868 | 100.0 | ||
| Democratic hold | ||||
| Democratic hold | ||||
| Party | Candidate | Votes | % | |
|---|---|---|---|---|
| Republican | Diane Kelley | 2,420 | 30.6 | |
| Republican | Paul Somero (incumbent) | 2,401 | 30.3 | |
| Democratic | Laura Lynch | 1,563 | 19.7 | |
| Democratic | Elizabeth Crooker | 1,536 | 19.4 | |
| Total votes | 7,920 | 100.0 | ||
| Republican hold | ||||
| Republican hold | ||||
| Party | Candidate | Votes | % | |
|---|---|---|---|---|
| Republican | Diane Pauer | 622 | 41.2 | |
| Republican | John Lewicke | 568 | 37.7 | |
| Republican | Edward Arnold | 318 | 21.1 | |
| Total votes | 1,508 | 100.0 | ||
| Party | Candidate | Votes | % | |
|---|---|---|---|---|
| Republican | John Lewicke | 2,254 | 27.8 | |
| Republican | Diane Pauer | 2,221 | 27.4 | |
| Democratic | Chris Wheeler | 1,823 | 22.5 | |
| Democratic | Brian Rater | 1,805 | 22.3 | |
| Total votes | 8,103 | 100.0 | ||
| Republican hold | ||||
| Republican gain from Democratic | ||||
| Party | Candidate | Votes | % | |
|---|---|---|---|---|
| Democratic | Kat McGhee (incumbent) [lower-alpha 3] | 867 | 51.0 | |
| Democratic | Tom Harris | 635 | 37.4 | |
| Democratic | Teagan Hudzik | 197 | 11.6 | |
| Total votes | 1,699 | 100.0 | ||
| Party | Candidate | Votes | % | |
|---|---|---|---|---|
| Republican | David Werner | 663 | 45.1 | |
| Republican | Susan Homola | 615 | 41.8 | |
| Republican | Paul Romsky | 191 | 13.0 | |
| Total votes | 1,469 | 100.0 | ||
| Party | Candidate | Votes | % | |
|---|---|---|---|---|
| Republican | Susan Homola | 2,728 | 25.9 | |
| Democratic | Kat McGhee (incumbent) | 2,686 | 25.5 | |
| Republican | David Werner | 2,589 | 24.6 | |
| Democratic | Tom Harris | 2,524 | 24.0 | |
| Total votes | 10,527 | 100.0 | ||
| Republican hold | ||||
| Democratic hold | ||||
| Party | Candidate | Votes | % | |
|---|---|---|---|---|
| Democratic | Jan Schmidt (incumbent) | 2,922 | 18.6 | |
| Democratic | Bruce Cohen (incumbent) | 2,720 | 17.3 | |
| Republican | Tom Lanzara | 2,642 | 16.9 | |
| Democratic | William Bordy (incumbent) | 2,566 | 16.4 | |
| Republican | Elizabeth Ferreira | 2,479 | 15.8 | |
| Republican | Rosemary Russell | 2,353 | 15.0 | |
| Total votes | 13,329 | 100.0 | ||
| Democratic hold | ||||
| Democratic hold | ||||
| Republican gain from Democratic | ||||
| Party | Candidate | Votes | % | |
|---|---|---|---|---|
| Democratic | Sue Newman (incumbent) | 2,560 | 19.4 | |
| Democratic | Paul Bergeron (incumbent) | 2,538 | 19.2 | |
| Democratic | Ray Newman (incumbent) | 2,377 | 18.0 | |
| Republican | Michael McCarthy | 1,938 | 14.7 | |
| Republican | Julie Smith | 1,918 | 14.5 | |
| Republican | Brian Mercer | 1,893 | 14.3 | |
| Total votes | 13,224 | 100.0 | ||
| Democratic hold | ||||
| Democratic hold | ||||
| Democratic hold | ||||
| Party | Candidate | Votes | % | |
|---|---|---|---|---|
| Republican | David Schoneman | 503 | 36.0 | |
| Republican | Howard Coffman | 327 | 23.4 | |
| Republican | Doris Hohensee | 294 | 21.1 | |
| Republican | Amanda Reichert | 273 | 19.5 | |
| Total votes | 1,397 | 100.0 | ||
| Party | Candidate | Votes | % | |
|---|---|---|---|---|
| Democratic | Patricia Klee (incumbent) | 2,661 | 20.5 | |
| Democratic | Suzanne Vail (incumbent) | 2,567 | 19.7 | |
| Democratic | Sherry Dutzy (incumbent) | 2,437 | 18.7 | |
| Republican | David Schoneman | 1,951 | 15.0 | |
| Republican | Doris Hohensee | 1,713 | 13.2 | |
| Republican | Howard Coffman | 1,685 | 12.9 | |
| Total votes | 13,014 | 100.0 | ||
| Democratic hold | ||||
| Democratic hold | ||||
| Democratic hold | ||||
| Party | Candidate | Votes | % | |
|---|---|---|---|---|
| Democratic | David Cote (incumbent) | 307 | 29.2 | |
| Democratic | Manny Espitia (incumbent) | 292 | 27.7 | |
| Democratic | Stacie-Marie Laughton | 247 | 23.5 | |
| Democratic | Fred Davis Jr. (incumbent) | 207 | 19.7 | |
| Total votes | 1,053 | 100.0 | ||
| Party | Candidate | Votes | % | |
|---|---|---|---|---|
| Democratic | David Cote (incumbent) | 1,698 | 21.2 | |
| Democratic | Manny Espitia (incumbent) | 1,665 | 20.7 | |
| Democratic | Stacie-Marie Laughton | 1,611 | 20.1 | |
| Republican | Ryan Terrell | 1,221 | 15.2 | |
| Republican | Elizabeth van Twuyver | 996 | 12.4 | |
| Republican | Joost Baumeister | 839 | 10.4 | |
| Total votes | 8,030 | 100.0 | ||
| Democratic hold | ||||
| Democratic hold | ||||
| Democratic hold | ||||
| Party | Candidate | Votes | % | |
|---|---|---|---|---|
| Democratic | Dan Toomey (incumbent) | 2,915 | 18.5 | |
| Democratic | Allison Nutting-Wong (incumbent) | 2,774 | 17.6 | |
| Democratic | Michael Pedersen (incumbent) | 2,750 | 17.5 | |
| Republican | Paula Johnson | 2,637 | 16.8 | |
| Republican | Joseph Cole | 2,370 | 15.1 | |
| Republican | Di Lathrop | 2,284 | 14.5 | |
| Total votes | 15,730 | 100.0 | ||
| Democratic hold | ||||
| Democratic hold | ||||
| Democratic hold | ||||
| Party | Candidate | Votes | % | |
|---|---|---|---|---|
| Democratic | Fran Nutter-Upham (incumbent) | 423 | 28.3 | |
| Democratic | Efstathia Booras | 415 | 27.8 | |
| Democratic | Mark King (incumbent) | 351 | 23.5 | |
| Democratic | Ken N. Gidge (incumbent) | 305 | 20.4 | |
| Total votes | 1,494 | 100.0 | ||
| Party | Candidate | Votes | % | |
|---|---|---|---|---|
| Democratic | Mark King (incumbent) | 2,050 | 19.9 | |
| Democratic | Fran Nutter-Upham (incumbent) | 1,887 | 18.3 | |
| Democratic | Efstathia Booras | 1,866 | 18.1 | |
| Republican | Kevin Scully | 1,679 | 16.3 | |
| Republican | Teresa Scully | 1,474 | 14.3 | |
| Republican | Edward Decatur | 1,361 | 13.2 | |
| Total votes | 10,317 | 100.0 | ||
| Democratic hold | ||||
| Democratic hold | ||||
| Democratic hold | ||||
| Party | Candidate | Votes | % | |
|---|---|---|---|---|
| Democratic | Deb Stevens (incumbent) | 1,995 | 19.0 | |
| Democratic | Catherine Sofikitis (incumbent) | 1,979 | 18.8 | |
| Democratic | Melbourne Moran | 1,791 | 16.8 | |
| Republican | Charlie Hall | 1,760 | 16.8 | |
| Republican | Dee Hogan | 1,517 | 14.4 | |
| Republican | Jacqueline Casey | 1,498 | 14.3 | |
| Total votes | 10,540 | 100.0 | ||
| Democratic hold | ||||
| Democratic hold | ||||
| Democratic hold | ||||
| Party | Candidate | Votes | % | |
|---|---|---|---|---|
| Democratic | Laura Telerski (incumbent) | 2,847 | 20.4 | |
| Democratic | Latha Mangipudi (incumbent) | 2,843 | 20.4 | |
| Democratic | Skip Cleaver (incumbent) | 2,630 | 18.9 | |
| Republican | Peter Silva | 2,013 | 14.4 | |
| Republican | Anthony DiPaolo | 1,841 | 13.2 | |
| Republican | Paul Hutsteiner | 1,761 | 12.6 | |
| Total votes | 13,935 | 100.0 | ||
| Democratic hold | ||||
| Democratic hold | ||||
| Democratic hold | ||||
| Party | Candidate | Votes | % | |
|---|---|---|---|---|
| Republican | Bill Ohm | 528 | 28.1 | |
| Republican | Bill O'Brien | 502 | 26.8 | |
| Republican | Tyler Gouveia | 453 | 24.2 | |
| Republican | Paula Desjardins | 393 | 21.0 | |
| Total votes | 1,876 | 100.0 | ||
| Party | Candidate | Votes | % | |
|---|---|---|---|---|
| Democratic | Michael O'Brien (incumbent) | 2,734 | 18.8 | |
| Democratic | Linda Harriott-Gathright (incumbent) | 2,685 | 18.5 | |
| Democratic | Marty Jack (incumbent) | 2,601 | 17.9 | |
| Republican | Bill Ohm | 2,272 | 15.6 | |
| Republican | Bill O'Brien | 2,187 | 15.0 | |
| Republican | Tyler Gouveia | 2,061 | 14.2 | |
| Total votes | 14,540 | 100.0 | ||
| Democratic hold | ||||
| Democratic hold | ||||
| Democratic hold | ||||
| Party | Candidate | Votes | % | |
|---|---|---|---|---|
| Republican | Bob Greene (incumbent) | 2,917 | 9.9 | |
| Republican | Lynne Ober (incumbent) | 2,780 | 9.4 | |
| Republican | Russell Ober (incumbent) | 2,690 | 9.1 | |
| Republican | Kim Rice (incumbent) | 2,612 | 8.9 | |
| Republican | Hershel Nunez (incumbent) | 2,535 | 8.6 | |
| Republican | Jordan Ulery (incumbent) | 2,517 | 8.6 | |
| Republican | Alicia Lekas (incumbent) | 2,484 | 8.4 | |
| Republican | Tony Lekas (incumbent) | 2,460 | 8.4 | |
| Republican | Andrew Renzullo (incumbent) | 2,435 | 8.3 | |
| Republican | Andrew Prout (incumbent) | 2,374 | 8.1 | |
| Republican | Denise Smith | 2,271 | 7.7 | |
| Republican | Louis Alciere | 1,379 | 4.7 | |
| Total votes | 29,454 | 100.0 | ||
| Party | Candidate | Votes | % | |
|---|---|---|---|---|
| Republican | Lynne Ober (incumbent) | 11,983 | 6.3 | |
| Republican | Kim Rice (incumbent) | 11,274 | 5.9 | |
| Republican | Russell Ober (incumbent) | 11,220 | 5.8 | |
| Republican | Tony Lekas (incumbent) | 10,582 | 5.5 | |
| Republican | Bob Greene (incumbent) | 10,487 | 5.5 | |
| Republican | Alicia Lekas (incumbent) | 10,335 | 5.4 | |
| Republican | Denise Smith | 10,196 | 5.3 | |
| Republican | Jordan Ulery (incumbent) | 10,153 | 5.3 | |
| Republican | Hershel Nunez (incumbent) | 10,146 | 5.3 | |
| Republican | Andrew Prout (incumbent) | 10,061 | 5.2 | |
| Republican | Andrew Renzullo (incumbent) | 10,029 | 5.2 | |
| Democratic | David Hennessey | 7,579 | 3.9 | |
| Democratic | Brett Gagnon | 7,524 | 3.9 | |
| Democratic | Barbara Blue | 7,189 | 3.7 | |
| Democratic | Nancy Brucker | 6,948 | 3.6 | |
| Democratic | Steven Katsos | 6,932 | 3.6 | |
| Democratic | Hal Lynde | 6,765 | 3.5 | |
| Democratic | Lana Paliy | 6,683 | 3.5 | |
| Democratic | Robert Sherman | 6,658 | 3.5 | |
| Democratic | Alejandro Urrutia | 6,497 | 3.4 | |
| Democratic | Timothy Wyatt | 6,236 | 3.2 | |
| Democratic | Beatriz Jauregui | 6,233 | 3.2 | |
| Total votes | 191,710 | 100.0 | ||
| Republican hold | ||||
| Republican hold | ||||
| Republican hold | ||||
| Republican hold | ||||
| Republican hold | ||||
| Republican hold | ||||
| Republican hold | ||||
| Republican hold | ||||
| Republican hold | ||||
| Republican hold | ||||
| Republican hold | ||||
| Party | Candidate | Votes | % | |
|---|---|---|---|---|
| Republican | Jim Creighton | 6,520 | 26.5 | |
| Democratic | Stephanie Hyland | 6,161 | 25.0 | |
| Republican | Riche Colcombe | 6,091 | 24.7 | |
| Democratic | James Bosman (incumbent) | 5,851 | 23.8 | |
| Total votes | 24,623 | 100.0 | ||
| Democratic hold | ||||
| Republican gain from Democratic | ||||
| Party | Candidate | Votes | % | |
|---|---|---|---|---|
| Republican | John Burt (incumbent) | 9,104 | 57.9 | |
| Democratic | Gary Evans | 6,619 | 42.1 | |
| Total votes | 15,723 | 100.0 | ||
| Republican hold | ||||
| Party | Candidate | Votes | % | |
|---|---|---|---|---|
| Republican | Keith Ammon | 10,160 | 52.1 | |
| Democratic | Ben Ming | 9,339 | 47.9 | |
| Total votes | 100.0 | |||
| Republican gain from Democratic | ||||
| Party | Candidate | Votes | % | |
|---|---|---|---|---|
| Republican | Laurie Sanborn (incumbent) | 11,271 | 52.0 | |
| Democratic | Lisa Nash | 10,399 | 48.0 | |
| Total votes | 21,670 | 100.0 | ||
| Republican hold | ||||
| Party | Candidate | Votes | % | |
|---|---|---|---|---|
| Democratic | Jacqueline Chretien (incumbent) | 7,438 | 31.0 | |
| Democratic | Matt Wilhelm (incumbent) | 6,608 | 27.5 | |
| Republican | Phillip Harris | 5,108 | 21.3 | |
| Republican | Julie Senneville | 4,845 | 20.2 | |
| Total votes | 100.0 | |||
| Democratic hold | ||||
| Democratic hold | ||||
| Party | Candidate | Votes | % | |
|---|---|---|---|---|
| Democratic | Amy Bradley | 1,565 | 29.9 | |
| Democratic | Chris Herbert (incumbent) | 1,332 | 25.5 | |
| Democratic | Benjamin Baroody (incumbent) | 1,225 | 23.4 | |
| Democratic | Marcella Termini | 1,105 | 21.1 | |
| Total votes | 5,227 | 100.0 | ||
| Party | Candidate | Votes | % | |
|---|---|---|---|---|
| Democratic | Amy Bradley | 6,859 | 19.2 | |
| Democratic | Chris Herbert (incumbent) | 6,304 | 17.7 | |
| Republican | Joseph Lachance | 5,928 | 16.6 | |
| Democratic | Benjamin Baroody (incumbent) | 5,795 | 16.3 | |
| Republican | Lisa Freeman | 5,761 | 16.2 | |
| Republican | Kirk McConnvile | 5,000 | 14.0 | |
| Total votes | 35,647 | 100.0 | ||
| Democratic hold | ||||
| Democratic hold | ||||
| Republican gain from Democratic | ||||
| Party | Candidate | Votes | % | |
|---|---|---|---|---|
| Republican | Mark McLean (incumbent) | 7,028 | 27.7 | |
| Republican | Ross Berry | 6,847 | 27.0 | |
| Democratic | Candace Moulton | 6,150 | 24.2 | |
| Democratic | Robert Curran | 5,375 | 21.2 | |
| Total votes | 100.0 | |||
| Republican hold | ||||
| Republican hold | ||||
| Party | Candidate | Votes | % | |
|---|---|---|---|---|
| Democratic | Jane Beaulieu (incumbent) | 1,294 | 41.3 | |
| Democratic | Connie Van Houten (incumbent) | 1,166 | 37.2 | |
| Democratic | Mary Lemay | 673 | 21.5 | |
| Total votes | 3,133 | 100.0 | ||
| Party | Candidate | Votes | % | |
|---|---|---|---|---|
| Democratic | Jane Beaulieu (incumbent) | 6,137 | 28.7 | |
| Democratic | Connie Van Houten (incumbent) | 5,423 | 25.3 | |
| Republican | Amanda Higgins | 4,942 | 23.1 | |
| Republican | Carlos Gonzalez | 4,891 | 22.9 | |
| Total votes | 21,393 | 100.0 | ||
| Democratic hold | ||||
| Democratic hold | ||||
District 1 • District 2 • District 3 • District 4 • District 5 • District 6 • District 7 • District 8 • District 9 • District 10 • District 11 • District 12 • District 13 • District 14 • District 15 • District 16 • District 17 • District 18 • District 19 • District 20 • District 21 • District 22 • District 23 • District 24 • District 25 • District 26 • District 27 • District 28 • District 29 |
| Party | Candidate | Votes | % | |
|---|---|---|---|---|
| Republican | Louise Andrus | 1,679 | 53.9 | |
| Democratic | Ken Wells (incumbent) | 1,436 | 46.1 | |
| Total votes | 3,115 | 100.0 | ||
| Republican gain from Democratic | ||||
| Party | Candidate | Votes | % | |
|---|---|---|---|---|
| Republican | Dave Testerman (incumbent) | 465 | 46.9 | |
| Republican | James Mason | 287 | 29.0 | |
| Republican | Christopher Gronski | 239 | 24.1 | |
| Total votes | 991 | 100.0 | ||
| Party | Candidate | Votes | % | |
|---|---|---|---|---|
| Republican | Dave Testerman (incumbent) | 1,575 | 29.1 | |
| Republican | James Mason | 1,568 | 29.0 | |
| Democratic | Scott Burns | 1,226 | 22.7 | |
| Democratic | Terry Smith | 1,041 | 19.2 | |
| Total votes | 5,410 | 100.0 | ||
| Republican hold | ||||
| Republican hold | ||||
| Party | Candidate | Votes | % | |
|---|---|---|---|---|
| Republican | Greg Hill (incumbent) | 2,121 | 29.2 | |
| Republican | Kenna Cross | 1,980 | 27.2 | |
| Democratic | Sheena Duncan | 1,613 | 22.2 | |
| Democratic | Joyce Fulweiler (incumbent) | 1,555 | 21.4 | |
| Total votes | 7,269 | 100.0 | ||
| Republican hold | ||||
| Republican gain from Democratic | ||||
| Party | Candidate | Votes | % | |
|---|---|---|---|---|
| Democratic | Tom Schamberg (incumbent) | 1,239 | 55.0 | |
| Republican | Victor Prieto | 1,014 | 45.0 | |
| Total votes | 2,253 | 100.0 | ||
| Democratic hold | ||||
| Party | Candidate | Votes | % | |
|---|---|---|---|---|
| Democratic | Karen Ebel (incumbent) | 2,514 | 28.6 | |
| Republican | Dan Wolf (incumbent) | 2,354 | 26.8 | |
| Democratic | Karen Zurheide | 2,202 | 25.1 | |
| Republican | Roger Richard | 1,716 | 19.5 | |
| Total votes | 8,786 | 100.0 | ||
| Democratic hold | ||||
| Republican hold | ||||
| Party | Candidate | Votes | % | |
|---|---|---|---|---|
| Democratic | Tony Caplan | 1,915 | 28.1 | |
| Democratic | Rod Pimentel (incumbent) | 1,880 | 27.6 | |
| Republican | Thomas Dunne Jr. | 1,545 | 22.7 | |
| Republican | James Parker | 1,469 | 21.6 | |
| Total votes | 6,809 | 100.0 | ||
| Democratic hold | ||||
| Democratic hold | ||||
| Party | Candidate | Votes | % | |
|---|---|---|---|---|
| Republican | Margaret Kennedy | 1,566 | 51.4 | |
| Democratic | Clyde Carson (incumbent) | 1,479 | 48.6 | |
| Total votes | 3,045 | 100.0 | ||
| Republican gain from Democratic | ||||
| Party | Candidate | Votes | % | |
|---|---|---|---|---|
| Democratic | Caroletta Alicea | 882 | 47.1 | |
| Republican | Robert Forsythe (incumbent) | 695 | 37.1 | |
| Independent | Rick Devoid (write-in) | 296 | 15.8 | |
| Total votes | 1,873 | 100.0 | ||
| Democratic gain from Republican | ||||
| Party | Candidate | Votes | % | |
|---|---|---|---|---|
| Democratic | Leslie Bergevin | 640 | 41.9 | |
| Democratic | Lois Frederich | 634 | 41.5 | |
| Democratic | Jim O'Neill | 254 | 16.6 | |
| Total votes | 1,528 | 100.0 | ||
| Party | Candidate | Votes | % | |
|---|---|---|---|---|
| Republican | Michael Moffett | 2,924 | 30.8 | |
| Republican | Jose Cambrils | 2,457 | 25.9 | |
| Democratic | Leslie Bergevin | 2,153 | 22.7 | |
| Democratic | Lois Frederich | 1,964 | 20.7 | |
| Total votes | 9,498 | 100.0 | ||
| Republican gain from Democratic | ||||
| Republican gain from Democratic | ||||
| Party | Candidate | Votes | % | |
|---|---|---|---|---|
| Democratic | Mary Jane Wallner (incumbent) | 2,098 | 34.5 | |
| Democratic | David Luneau (incumbent) | 1,825 | 30.0 | |
| Democratic | Mel Myner (incumbent) | 1,725 | 28.3 | |
| Democratic | Joel Prescott | 436 | 7.2 | |
| Total votes | 6,084 | 100.0 | ||
| Party | Candidate | Votes | % | |
|---|---|---|---|---|
| Democratic | Mary Jane Wallner (incumbent) | 4,233 | 23.2 | |
| Democratic | David Luneau (incumbent) | 4,099 | 22.4 | |
| Democratic | Mel Myner (incumbent) | 4,005 | 21.9 | |
| Republican | Pamela Ean | 2,098 | 11.5 | |
| Republican | John French | 2,049 | 11.2 | |
| Republican | Alexandros Dellas | 1,788 | 9.8 | |
| Total votes | 18,272 | 100.0 | ||
| Democratic hold | ||||
| Democratic hold | ||||
| Democratic hold | ||||
| Party | Candidate | Votes | % | |
|---|---|---|---|---|
| Democratic | Steve Shurtleff (incumbent) | 1,503 | 61.2 | |
| Republican | David Newell | 955 | 38.8 | |
| Total votes | 2,458 | 100.0 | ||
| Democratic hold | ||||
| Party | Candidate | Votes | % | |
|---|---|---|---|---|
| Democratic | Connie Lane (incumbent) | 1,200 | 55.0 | |
| Republican | Patrice Myers | 984 | 45.0 | |
| Total votes | 2,184 | 100.0 | ||
| Democratic hold | ||||
| Party | Candidate | Votes | % | |
|---|---|---|---|---|
| Democratic | Beth Richards (incumbent) | 1,091 | 65.7 | |
| Republican | Samuel Bahuma | 570 | 34.3 | |
| Total votes | 1,661 | 100.0 | ||
| Democratic hold | ||||
| Party | Candidate | Votes | % | |
|---|---|---|---|---|
| Democratic | Jim MacKay (incumbent) | 535 | 85.5 | |
| Democratic | Roy Schweiker | 91 | 14.5 | |
| Total votes | 626 | 100.0 | ||
| Party | Candidate | Votes | % | |
|---|---|---|---|---|
| Democratic | Jim MacKay (incumbent) | 1,431 | 70.7 | |
| Republican | Donna Davey | 594 | 29.3 | |
| Total votes | 2,025 | 100.0 | ||
| Democratic hold | ||||
| Party | Candidate | Votes | % | |
|---|---|---|---|---|
| Democratic | Eric Gallager | 1,227 | 65.9 | |
| Republican | Michelle McCartney | 636 | 34.1 | |
| Total votes | 1,863 | 100.0 | ||
| Democratic hold | ||||
| Party | Candidate | Votes | % | |
|---|---|---|---|---|
| Democratic | Timothy Soucy (incumbent) | 1,716 | 67.1 | |
| Republican | Bob Bertrand | 843 | 32.9 | |
| Total votes | 2,559 | 100.0 | ||
| Democratic hold | ||||
| Party | Candidate | Votes | % | |
|---|---|---|---|---|
| Democratic | Safiya Wazir (incumbent) | 1,209 | 54.3 | |
| Republican | Dennis Soucy | 1,016 | 45.7 | |
| Total votes | 2,225 | 100.0 | ||
| Democratic hold | ||||
| Party | Candidate | Votes | % | |
|---|---|---|---|---|
| Democratic | Kris Schultz (incumbent) | 1,144 | 63.8 | |
| Republican | Claude Bongambe | 650 | 31.2 | |
| Total votes | 1,794 | 100.0 | ||
| Democratic hold | ||||
| Party | Candidate | Votes | % | |
|---|---|---|---|---|
| Democratic | Christy Bartlett (incumbent) | 1,792 | 60.1 | |
| Republican | Jonathan Cate | 1,147 | 39.9 | |
| Total votes | 2,939 | 100.0 | ||
| Democratic hold | ||||
| Party | Candidate | Votes | % | |
|---|---|---|---|---|
| Republican | Brian Seaworth (incumbent) | 3,046 | 18.7 | |
| Democratic | Dianne Schuett (incumbent) | 2,735 | 16.8 | |
| Republican | Nick White | 2,656 | 16.3 | |
| Democratic | David Doherty (incumbent) | 2,636 | 16.2 | |
| Republican | Peter Gagyi | 2,475 | 15.2 | |
| Democratic | Clinton Hanson Jr. | 2,439 | 15.0 | |
| Total votes | 16,254 | 100.0 | ||
| Republican hold | ||||
| Democratic hold | ||||
| Republican gain from Democratic | ||||
| Party | Candidate | Votes | % | |
|---|---|---|---|---|
| Republican | James Allard (incumbent) | 2,761 | 32.1 | |
| Republican | John Klose (incumbent) | 2,579 | 29.9 | |
| Democratic | Mary Frambach | 1,715 | 19.9 | |
| Democratic | Hugh Curley | 1,560 | 18.1 | |
| Total votes | 8,615 | 100.0 | ||
| Republican hold | ||||
| Republican hold | ||||
| Party | Candidate | Votes | % | |
|---|---|---|---|---|
| Republican | Matthew Pitaro | 1,190 | 54.3 | |
| Democratic | David Coolidge | 1,003 | 45.7 | |
| Total votes | 2,193 | 100.0 | ||
| Republican gain from Democratic | ||||
| Party | Candidate | Votes | % | |
|---|---|---|---|---|
| Democratic | Mary Beth Walz (incumbent) | 1,368 | 32.4 | |
| Democratic | Samantha Fox (incumbent) | 1,130 | 26.8 | |
| Democratic | Gary Woods (incumbent) | 1,116 | 26.4 | |
| Democratic | Sally Wuellenweber | 605 | 14.3 | |
| Total votes | 4,219 | 100.0 | ||
| Party | Candidate | Votes | % | |
|---|---|---|---|---|
| Democratic | Mary Beth Walz (incumbent) | 3,670 | 17.9 | |
| Democratic | Gary Woods (incumbent) | 3,648 | 17.8 | |
| Democratic | Samantha Fox (incumbent) | 3,526 | 17.2 | |
| Republican | John Martin | 3,292 | 16.1 | |
| Republican | Raymond Plante | 3,255 | 15.9 | |
| Republican | Mariya Markova | 3,063 | 15.0 | |
| Total votes | 20,454 | 100.0 | ||
| Democratic hold | ||||
| Democratic hold | ||||
| Democratic hold | ||||
| Party | Candidate | Votes | % | |
|---|---|---|---|---|
| Republican | Thomas Walsh (incumbent) | 4,331 | 16.1 | |
| Republican | John Leavitt | 4,154 | 15.5 | |
| Republican | Michael Yakubovich (incumbent) | 4,109 | 15.3 | |
| Republican | Stephen Boyd | 4,085 | 15.2 | |
| Democratic | Kathleen Martins (incumbent) | 3,915 | 14.6 | |
| Democratic | Harry Kozlowski | 3,269 | 12.2 | |
| Democratic | Madalasa Gurung | 2,985 | 11.1 | |
| Total votes | 26,848 | 100.0 | ||
| Republican hold | ||||
| Republican hold | ||||
| Republican hold | ||||
| Republican gain from Democratic | ||||
| Party | Candidate | Votes | % | |
|---|---|---|---|---|
| Republican | Natalie Wells | 3,247 | 52.8 | |
| Democratic | Faith Minton | 2,902 | 47.2 | |
| Total votes | 6,149 | 100.0 | ||
| Republican gain from Democratic | ||||
| Party | Candidate | Votes | % | |
|---|---|---|---|---|
| Democratic | Lorrie Carey | 1,436 | 73.7 | |
| Democratic | Matthew Murphy | 512 | 26.3 | |
| Total votes | 1,948 | 100.0 | ||
| Party | Candidate | Votes | % | |
|---|---|---|---|---|
| Republican | Howard Pearl (incumbent) | 6,128 | 55.5 | |
| Democratic | Lorrie Carey | 4,923 | 44.5 | |
| Total votes | 11,051 | 100.0 | ||
| Republican hold | ||||
| Party | Candidate | Votes | % | |
|---|---|---|---|---|
| Democratic | Rebecca McWilliams (incumbent) | 7,605 | 33.6 | |
| Democratic | Art Ellison (incumbent) | 7,113 | 31.4 | |
| Republican | Mike Visconti | 4,221 | 18.6 | |
| Republican | Japhet Stevens | 3,730 | 16.4 | |
| Total votes | 22,669 | 100.0 | ||
| Democratic hold | ||||
| Democratic hold | ||||
| Party | Candidate | Votes | % | |
|---|---|---|---|---|
| Democratic | Katherine Rogers (incumbent) | 4,105 | 57.1 | |
| Republican | Andrew Georgevits | 3,016 | 42.9 | |
| Total votes | 7,121 | 100.0 | ||
| Democratic hold | ||||
| Party | Candidate | Votes | % | |
|---|---|---|---|---|
| Republican | Carol McGuire (incumbent) | 4,208 | 60.17 | |
| Democratic | Miriam Cahill-Yeaton | 2,786 | 39.83 | |
| Total votes | 6,994 | 100.0 | ||
District 1 • District 2 • District 3 • District 4 • District 5 • District 6 • District 7 • District 8 • District 9 • District 10 • District 11 • District 12 • District 13 • District 14 • District 15 • District 16 • District 17 • District 18 • District 19 • District 20 • District 21 • District 22 • District 23 • District 24 • District 25 • District 26 • District 27 • District 28 • District 29 • District 30 • District 31 • District 32 • District 33 • District 34 • District 35 • District 36 • District 37 |
| Party | Candidate | Votes | % | |
|---|---|---|---|---|
| Republican | Paul Tudor | 275 | 57.5 | |
| Republican | Brian Stone | 203 | 42.5 | |
| Total votes | 478 | 100.0 | ||
| Party | Candidate | Votes | % | |
|---|---|---|---|---|
| Republican | Paul Tudor | 1,539 | 55.8 | |
| Democratic | Tom Chase | 1,221 | 44.2 | |
| Total votes | 2,760 | 100.0 | ||
| Republican gain from Democratic | ||||
| Party | Candidate | Votes | % | |
|---|---|---|---|---|
| Republican | Kevin Verville (incumbent) | 4,669 | 19.5 | |
| Republican | James Spillane (incumbent) | 4,521 | 18.9 | |
| Republican | Alan Bershtein (incumbent) | 4,155 | 17.4 | |
| Democratic | Jocelyn Messier | 3,905 | 16.3 | |
| Democratic | Richard Boisvert | 3,521 | 14.7 | |
| Democratic | Avis Rosenfield | 3,135 | 13.1 | |
| Total votes | 23,906 | 100.0 | ||
| Republican hold | ||||
| Republican hold | ||||
| Republican hold | ||||
| Party | Candidate | Votes | % | |
|---|---|---|---|---|
| Republican | Kevin Pratt (incumbent) | 3,661 | 24.4 | |
| Republican | Dustin Dodge | 2,943 | 19.6 | |
| Republican | Paul Ayer | 2,879 | 19.2 | |
| Democratic | Michael DiTommaso | 1,926 | 12.9 | |
| Democratic | Diane Kolifrath | 1,823 | 12.2 | |
| Democratic | Dennis Garnham | 1,745 | 11.6 | |
| Total votes | 14,977 | 100.0 | ||
| Republican hold | ||||
| Republican hold | ||||
| Republican hold | ||||
| Party | Candidate | Votes | % | |
|---|---|---|---|---|
| Republican | Jason Osborne (incumbent) | 1,972 | 19.4 | |
| Republican | Jess Edwards (incumbent) | 1,953 | 19.2 | |
| Republican | Chris True (incumbent) | 1,861 | 18.3 | |
| Republican | Tony Piemonte (incumbent) | 1,823 | 18.0 | |
| Republican | Oliver Ford | 1,293 | 12.7 | |
| Republican | Christopher Collins | 1,247 | 12.3 | |
| Total votes | 10,149 | 100.0 | ||
| Party | Candidate | Votes | % | |
|---|---|---|---|---|
| Republican | Jess Edwards (incumbent) | 6,686 | 14.0 | |
| Republican | Chris True (incumbent) | 6,330 | 13.3 | |
| Republican | Jason Osborne (incumbent) | 6,235 | 13.1 | |
| Republican | Tony Piemonte (incumbent) | 5,982 | 12.6 | |
| Republican | Oliver Ford | 5,966 | 12.5 | |
| Democratic | Michael D'Angelo | 3,533 | 7.4 | |
| Democratic | Jane Van Zandt | 3,441 | 7.2 | |
| Democratic | Matthew Krohn | 3,178 | 6.7 | |
| Democratic | Ben Geiger | 3,162 | 6.6 | |
| Democratic | Russ Norman | 3,158 | 6.6 | |
| Total votes | 47,671 | 100.0 | ||
| Republican hold | ||||
| Republican hold | ||||
| Republican hold | ||||
| Republican hold | ||||
| Republican hold | ||||
| Party | Candidate | Votes | % | |
|---|---|---|---|---|
| Republican | Tom Dolan (incumbent) | 7,759 | 8.4 | |
| Republican | David Lundgren (incumbent) | 7,755 | 8.4 | |
| Republican | Al Baldasaro (incumbent) | 7,681 | 8.3 | |
| Republican | Betsy McKinney (incumbent) | 7,610 | 8.2 | |
| Republican | Doug Thomas (incumbent) | 7,103 | 7.7 | |
| Republican | Sherman Packard (incumbent) | 6,976 | 7.5 | |
| Republican | Wayne MacDonald | 6,762 | 7.3 | |
| Democratic | Anne Warner (incumbent) | 6,350 | 6.9 | |
| Democratic | Ted Combes | 6,293 | 6.8 | |
| Democratic | Martha Smith | 6,000 | 6.5 | |
| Democratic | Robin Skudlarek | 5,765 | 6.2 | |
| Democratic | Luisa Piette | 5,680 | 6.1 | |
| Democratic | Paul Skudlarek | 5,495 | 5.9 | |
| Democratic | Mack Leathurby | 5,291 | 5.7 | |
| Total votes | 92,520 | 100.0 | ||
| Republican hold | ||||
| Republican hold | ||||
| Republican hold | ||||
| Republican hold | ||||
| Republican hold | ||||
| Republican hold | ||||
| Republican gain from Democratic | ||||
| Party | Candidate | Votes | % | |
|---|---|---|---|---|
| Republican | David Love (incumbent) | 2,238 | 10.8 | |
| Republican | John Potucek (incumbent) | 1,664 | 8.1 | |
| Republican | Erica Layon | 1,647 | 8.0 | |
| Republican | Katherine O'Brien (incumbent) | 1,580 | 7.7 | |
| Republican | Phyllis Katsakiores (incumbent) | 1,539 | 7.5 | |
| Republican | Anne Copp | 1,523 | 7.4 | |
| Republican | Stephen Pearson (incumbent) | 1,440 | 7.0 | |
| Republican | Dave Milz (incumbent) | 1,421 | 6.9 | |
| Republican | Mary Ann Kimball | 1,362 | 6.6 | |
| Republican | Richard Tripp | 1,336 | 6.5 | |
| Republican | Thomas Cardon | 1,308 | 6.3 | |
| Republican | Rebecca Nevin | 1,241 | 6.0 | |
| Republican | Lauren LaMarsh | 1,185 | 5.7 | |
| Republican | Lorraine Lindenberg | 1,135 | 5.5 | |
| Total votes | 20,619 | 100.0 | ||
| Party | Candidate | Votes | % | |
|---|---|---|---|---|
| Republican | David Love (incumbent) | 8,134 | 6.1 | |
| Republican | Phyllis Katsakiores (incumbent) | 7,812 | 5.9 | |
| Republican | Richard Tripp | 7,727 | 5.8 | |
| Republican | Anne Copp | 7,440 | 5.6 | |
| Republican | Erica Layon | 7,404 | 5.6 | |
| Republican | Katherine O'Brien (incumbent) | 7,392 | 5.5 | |
| Republican | Mary Ann Kimball | 7,348 | 5.5 | |
| Republican | John Potucek (incumbent) | 7,266 | 5.5 | |
| Republican | Dave Milz (incumbent) | 7,171 | 5.4 | |
| Republican | Stephen Pearson (incumbent) | 7,169 | 5.4 | |
| Democratic | Mary Eisner (incumbent) | 6,337 | 4.8 | |
| Democratic | Mary Till | 5,943 | 4.5 | |
| Democratic | Erin Spencer | 5,648 | 4.2 | |
| Democratic | Amy Dattner-Levy | 5,602 | 4.2 | |
| Democratic | Paul Doolittle | 5,591 | 4.2 | |
| Democratic | Thomas Wood | 5,534 | 4.2 | |
| Democratic | Michelle Sawyer-Moge | 5,482 | 4.1 | |
| Democratic | Beatrice Vargas | 5,371 | 4.0 | |
| Democratic | Johnathan West | 5,127 | 3.9 | |
| Democratic | Owen Ingram | 4,912 | 3.7 | |
| Independent | Brenda Willis | 2,667 | 2.0 | |
| Total votes | 100.0 | |||
| Republican hold | ||||
| Republican hold | ||||
| Republican hold | ||||
| Republican hold | ||||
| Republican hold | ||||
| Republican hold | ||||
| Republican hold | ||||
| Republican hold | ||||
| Republican hold | ||||
| Republican gain from Democratic | ||||
| Party | Candidate | Votes | % | |
|---|---|---|---|---|
| Republican | Charles McMahon (incumbent) | 1,166 | 20.2 | |
| Republican | Mary Griffin (incumbent) | 1,136 | 19.7 | |
| Republican | Julius Soti | 1,009 | 17.5 | |
| Republican | Bob Lynn | 995 | 17.3 | |
| Republican | Walter Kolodziej (incumbent) | 918 | 15.9 | |
| Republican | Joe Plonski | 538 | 9.3 | |
| Total votes | 5,762 | 100.0 | ||
| Party | Candidate | Votes | % | |
|---|---|---|---|---|
| Republican | Mary Griffin (incumbent) | 5,591 | 16.3 | |
| Republican | Charles McMahon (incumbent) | 5,554 | 16.2 | |
| Republican | Bob Lynn | 5,089 | 14.8 | |
| Republican | Julius Soti | 4,777 | 13.9 | |
| Democratic | Kristi St. Laurent | 4,357 | 12.7 | |
| Democratic | Valerie Roman | 3,443 | 10.0 | |
| Democratic | Henri Azibert | 2,808 | 8.2 | |
| Democratic | Ioana Singureanu | 2,764 | 8.0 | |
| Total votes | 34,383 | 100.0 | ||
| Republican hold | ||||
| Republican hold | ||||
| Republican hold | ||||
| Republican hold | ||||
| Party | Candidate | Votes | % | |
|---|---|---|---|---|
| Republican | Fred Doucette (incumbent) | 1,986 | 9.8 | |
| Republican | John Sytek (incumbent) | 1,977 | 9.8 | |
| Republican | Daryl Abbas (incumbent) | 1,909 | 9.4 | |
| Republican | Joe Sweeney | 1,809 | 8.9 | |
| Republican | John Janigian (incumbent) | 1,780 | 8.8 | |
| Republican | Everett McBride (incumbent) | 1,619 | 8.0 | |
| Republican | Betty Gay (incumbent) | 1,579 | 7.8 | |
| Republican | Bob Elliott (incumbent) | 1,447 | 7.1 | |
| Republican | Susan Vandecasteele | 1,347 | 6.7 | |
| Republican | Tanya Donnelly | 1,336 | 6.6 | |
| Republican | John Manning Jr. | 1,169 | 5.8 | |
| Republican | Dave Blake | 1,158 | 5.7 | |
| Republican | Joe Lessard | 1,120 | 5.5 | |
| Total votes | 20,236 | 100.0 | ||
| Party | Candidate | Votes | % | |
|---|---|---|---|---|
| Republican | Joe Sweeney | 8,795 | 7.3 | |
| Republican | John Sytek (incumbent) | 8,349 | 6.9 | |
| Republican | Fred Doucette (incumbent) | 8,101 | 6.7 | |
| Republican | Daryl Abbas (incumbent) | 8,086 | 6.7 | |
| Republican | Everett McBride (incumbent) | 8,021 | 6.6 | |
| Republican | Susan Vandecasteele | 8,016 | 6.6 | |
| Republican | Betty Gay (incumbent) | 7,977 | 6.6 | |
| Republican | John Janigian (incumbent) | 7,870 | 6.5 | |
| Republican | Bob Elliott (incumbent) | 7,703 | 6.4 | |
| Democratic | Bonnie Wright | 6,301 | 5.2 | |
| Democratic | Maureen Thibault | 5,447 | 4.5 | |
| Democratic | Sara Dillingham | 5,418 | 4.5 | |
| Democratic | Claire Karibian | 5,391 | 4.5 | |
| Democratic | Jacqueline Muollo | 5,194 | 4.3 | |
| Democratic | Donna Loranger | 5,118 | 4.2 | |
| Democratic | Gregory Davis | 5,040 | 4.2 | |
| Democratic | Cam Iannalfo | 5,031 | 4.2 | |
| Democratic | Sean Lewis | 4,859 | 4.0 | |
| Total votes | 120,717 | 100.0 | ||
| Republican hold | ||||
| Republican hold | ||||
| Republican hold | ||||
| Republican hold | ||||
| Republican hold | ||||
| Republican hold | ||||
| Republican hold | ||||
| Republican hold | ||||
| Republican hold | ||||
| Party | Candidate | Votes | % | |
|---|---|---|---|---|
| Republican | Michael Vose (incumbent) | 2,215 | 27.2 | |
| Republican | Cody Belanger | 2,147 | 26.3 | |
| Democratic | Mark Vallone (incumbent) | 2,090 | 25.6 | |
| Democratic | Gregory Tillman | 1,704 | 20.9 | |
| Total votes | 8,156 | 100.0 | ||
| Republican hold | ||||
| Republican gain from Democratic | ||||
| Party | Candidate | Votes | % | |
|---|---|---|---|---|
| Republican | Dennis Acton (incumbent) | 1,649 | 61.3 | |
| Democratic | Ellen Marie Douglas | 1,042 | 38.7 | |
| Total votes | 2,691 | 100.0 | ||
| Republican hold | ||||
| Party | Candidate | Votes | % | |
|---|---|---|---|---|
| Republican | Melissa Litchfield | 1,454 | 51.0 | |
| Democratic | Liz McConnell (incumbent) | 1,395 | 49.0 | |
| Total votes | 2,849 | 100.0 | ||
| Republican gain from Democratic | ||||
| Party | Candidate | Votes | % | |
|---|---|---|---|---|
| Republican | Scott Wallace (incumbent) | 1,682 | 63.7 | |
| Democratic | Diana West | 958 | 36.3 | |
| Total votes | 2,640 | 100.0 | ||
| Republican hold | ||||
| Party | Candidate | Votes | % | |
|---|---|---|---|---|
| Republican | Joe Guthrie (incumbent) | 5,407 | 16.3 | |
| Republican | Kenneth Weyler (incumbent) | 5,057 | 15.3 | |
| Republican | David Welch (incumbent) | 4,932 | 14.9 | |
| Republican | Dennis Green (incumbent) | 4,759 | 14.4 | |
| Democratic | Laurie Warnock | 3,438 | 10.4 | |
| Democratic | Trisha Tidd | 3,222 | 9.7 | |
| Democratic | Jim LaValley | 3,185 | 9.6 | |
| Democratic | Mindy Funke Collins | 3,093 | 9.4 | |
| Total votes | 33,093 | 100.0 | ||
| Republican hold | ||||
| Republican hold | ||||
| Republican hold | ||||
| Republican hold | ||||
| Party | Candidate | Votes | % | |
|---|---|---|---|---|
| Republican | Peter Torosian (incumbent) | 5,353 | 16.3 | |
| Republican | Debra DeSimone (incumbent) | 5,035 | 15.4 | |
| Republican | Norman Major (incumbent) | 4,979 | 15.2 | |
| Republican | Robert Harb (incumbent) | 4,702 | 14.3 | |
| Democratic | Kay Galloway | 3,613 | 11.0 | |
| Democratic | Kate Delfino | 3,318 | 10.1 | |
| Democratic | Nancy Bishop | 3,019 | 9.2 | |
| Democratic | George Hamblen | 2,771 | 8.5 | |
| Total votes | 32,790 | 100.0 | ||
| Republican hold | ||||
| Republican hold | ||||
| Republican hold | ||||
| Republican hold | ||||
| Party | Candidate | Votes | % | |
|---|---|---|---|---|
| Republican | Charles Melvin (incumbent) | 1,708 | 60.0 | |
| Democratic | Robert Bartlett | 1,139 | 40.0 | |
| Total votes | 2,847 | 100.0 | ||
| Republican hold | ||||
| Party | Candidate | Votes | % | |
|---|---|---|---|---|
| Republican | JD Bernardy | 1,996 | 53.7 | |
| Democratic | Peter Oldak | 1,722 | 46.3 | |
| Total votes | 3,718 | 100.0 | ||
| Republican hold | ||||
| Party | Candidate | Votes | % | |
|---|---|---|---|---|
| Democratic | Charlotte DiLorenzo (incumbent) | 3,829 | 27.3 | |
| Democratic | Michael Cahill (incumbent) | 3,751 | 26.8 | |
| Democratic | Ellen Read (incumbent) | 3,561 | 25.4 | |
| Republican | Carolyn Scanlon | 2,867 | 20.5 | |
| Total votes | 14,008 | 100.0 | ||
| Democratic hold | ||||
| Democratic hold | ||||
| Democratic hold | ||||
| Party | Candidate | Votes | % | |
|---|---|---|---|---|
| Democratic | Julie Gilman (incumbent) | 5,865 | 16.6 | |
| Democratic | Gaby Grossman (incumbent) | 5,773 | 16.3 | |
| Democratic | Lisa Bunker (incumbent) | 5,598 | 15.8 | |
| Democratic | Mark Paige | 5,583 | 15.8 | |
| Republican | Greg Stone | 3,317 | 9.4 | |
| Republican | Edward Duncan | 3,191 | 9.0 | |
| Republican | Carl Wikstrom | 3,063 | 8.7 | |
| Republican | William Smith | 2,972 | 8.4 | |
| Total votes | 35,362 | 100.0 | ||
| Democratic hold | ||||
| Democratic hold | ||||
| Democratic hold | ||||
| Democratic hold | ||||
| Party | Candidate | Votes | % | |
|---|---|---|---|---|
| Democratic | Debra Altschiller (incumbent) | 2,707 | 26.4 | |
| Republican | Patrick Abrami (incumbent) | 2,629 | 26.6 | |
| Democratic | Jennifer Scrafford | 2,474 | 24.1 | |
| Republican | Amy Jeffrey | 2,438 | 23.8 | |
| Total votes | 10,248 | 100.0 | ||
| Democratic hold | ||||
| Republican hold | ||||
| Party | Candidate | Votes | % | |
|---|---|---|---|---|
| Republican | Tim Baxter | 1,010 | 30.4 | |
| Republican | Aboul Khan (incumbent) | 652 | 19.6 | |
| Republican | Tina Harley | 636 | 19.1 | |
| Republican | Austin Greene | 552 | 16.6 | |
| Republican | William Fowler (incumbent) | 293 | 8.8 | |
| Republican | William Rosser | 180 | 5.4 | |
| Total votes | 3,323 | 100.0 | ||
| Party | Candidate | Votes | % | |
|---|---|---|---|---|
| Republican | Aboul Khan (incumbent) | 3,444 | 21.6 | |
| Republican | Tim Baxter | 3,292 | 20.6 | |
| Republican | Tina Harley | 3,182 | 19.9 | |
| Democratic | Patricia O'Keefe | 2,448 | 15.3 | |
| Democratic | Greg Marrow | 1,905 | 11.9 | |
| Democratic | Louis Flynn | 1,683 | 10.6 | |
| Total votes | 15,954 | 100.0 | ||
| Republican hold | ||||
| Republican hold | ||||
| Republican hold | ||||
| Party | Candidate | Votes | % | |
|---|---|---|---|---|
| Democratic | Mike Edgar (incumbent) | 5,106 | 13.0 | |
| Republican | Tracy Emerick | 5,086 | 13.0 | |
| Democratic | Tom Loughman (incumbent) | 5,085 | 13.0 | |
| Democratic | Renny Cushing (incumbent) | 5,072 | 12.9 | |
| Democratic | Katherine Harake | 4,948 | 12.6 | |
| Republican | Ken Sheffert | 4,649 | 11.9 | |
| Republican | David Hagen | 4,643 | 11.8 | |
| Republican | Sharleene Hurst | 4,625 | 11.8 | |
| Total votes | 39,214 | 100.0 | ||
| Democratic hold | ||||
| Republican gain from Democratic | ||||
| Democratic hold | ||||
| Democratic hold | ||||
| Party | Candidate | Votes | % | |
|---|---|---|---|---|
| Democratic | Jim Maggiore (incumbent) | 1,733 | 51.7 | |
| Republican | Kristen Larsen | 1,620 | 48.3 | |
| Total votes | 3,353 | 100.0 | ||
| Democratic hold | ||||
| Party | Candidate | Votes | % | |
|---|---|---|---|---|
| Democratic | Dennis Malloy (incumbent) | 1,767 | 51.4 | |
| Republican | Jenni Boynton | 1,673 | 48.6 | |
| Total votes | 3,440 | 100.0 | ||
| Democratic hold | ||||
| Party | Candidate | Votes | % | |
|---|---|---|---|---|
| Republican | Julie Tucker | 888 | 48.2 | |
| Republican | Joanne Meyer | 627 | 34.0 | |
| Republican | Ryan Lent | 327 | 17.8 | |
| Total votes | 1,842 | 100.0 | ||
| Party | Candidate | Votes | % | |
|---|---|---|---|---|
| Democratic | Jaci Grote (incumbent) | 2,745 | 27.5 | |
| Democratic | Kate Murray (incumbent) | 2,686 | 26.9 | |
| Republican | Julie Tucker | 2,406 | 24.1 | |
| Republican | Joanne Meyer | 2,153 | 21.5 | |
| Total votes | 9,990 | 100.0 | ||
| Democratic hold | ||||
| Democratic hold | ||||
| Party | Candidate | Votes | % | |
|---|---|---|---|---|
| Democratic | Laura Pantelakos (incumbent) | 426 | 51.8 | |
| Democratic | Robin Vogt | 397 | 48.2 | |
| Total votes | 823 | 100.0 | ||
| Party | Candidate | Votes | % | |
|---|---|---|---|---|
| Democratic | Laura Pantelakos (incumbent) | 2,111 | 100.0 | |
| Total votes | 2,111 | 100.0 | ||
| Democratic hold | ||||
| Party | Candidate | Votes | % | |
|---|---|---|---|---|
| Democratic | Rebecca McBeath (incumbent) | 2,354 | 74.5 | |
| Republican | Alexandria Knox | 808 | 25.5 | |
| Total votes | 3,162 | 100.0 | ||
| Democratic hold | ||||
| Party | Candidate | Votes | % | |
|---|---|---|---|---|
| Democratic | Peter Somssich (incumbent) | 1,696 | 100.0 | |
| Total votes | 1,696 | 100.0 | ||
| Democratic hold | ||||
| Party | Candidate | Votes | % | |
|---|---|---|---|---|
| Democratic | Gerry Ward (incumbent) | 1,541 | 62.2 | |
| Republican | Cynthia Taylor-Hollandbeck | 936 | 37.8 | |
| Total votes | 2,477 | 100.0 | ||
| Democratic hold | ||||
| Party | Candidate | Votes | % | |
|---|---|---|---|---|
| Democratic | David Meuse (incumbent) | 2,035 | 100.0 | |
| Total votes | 2,035 | 100.0 | ||
| Democratic hold | ||||
| Party | Candidate | Votes | % | |
|---|---|---|---|---|
| Democratic | Jacqueline Cali-Pitts (incumbent) | 2,202 | 66.2 | |
| Democratic | Rich DiPentima | 1,123 | 33.8 | |
| Total votes | 3,325 | 100.0 | ||
| Party | Candidate | Votes | % | |
|---|---|---|---|---|
| Democratic | Jacqueline Cali-Pitts (incumbent) | 7,708 | 69.9 | |
| Republican | Tom Lukacz | 3,313 | 30.1 | |
| Total votes | 11,021 | 100.0 | ||
| Democratic hold | ||||
| Party | Candidate | Votes | % | |
|---|---|---|---|---|
| Democratic | Joan Hamblet | 4,831 | 52.7 | |
| Republican | Henry Marsh | 4,339 | 47.3 | |
| Total votes | 9,170 | 100.0 | ||
| Democratic hold | ||||
| Party | Candidate | Votes | % | |
|---|---|---|---|---|
| Republican | Terry Roy (incumbent) | 6,928 | 59.4 | |
| Democratic | Hal Rafter | 4,727 | 40.6 | |
| Total votes | 11,655 | 100.0 | ||
| Republican hold | ||||
| Party | Candidate | Votes | % | |
|---|---|---|---|---|
| Republican | Josh Yokela (incumbent) | 4,606 | 56.8 | |
| Democratic | Eric Turer | 3,507 | 43.2 | |
| Total votes | 8,113 | 100.0 | ||
| Republican hold | ||||
| Party | Candidate | Votes | % | |
|---|---|---|---|---|
| Republican | Mark Pearson (incumbent) | 11,132 | 61.1 | |
| Democratic | Lisa DeMio | 7,086 | 38.9 | |
| Total votes | 18,218 | 100.0 | ||
| Republican hold | ||||
| Party | Candidate | Votes | % | |
|---|---|---|---|---|
| Republican | Deborah Hobson (incumbent) | 3,834 | 58.7 | |
| Democratic | Robert Moore | 2,693 | 41.3 | |
| Total votes | 6,527 | 100.0 | ||
| Republican hold | ||||
| Party | Candidate | Votes | % | |
|---|---|---|---|---|
| Democratic | Alexis Simpson | 12,898 | 59.9 | |
| Republican | Daniel Gray | 8,649 | 40.1 | |
| Total votes | 21,547 | 100.0 | ||
| Democratic hold | ||||
| Party | Candidate | Votes | % | |
|---|---|---|---|---|
| Republican | Max Abramson (incumbent) [lower-alpha 4] | 1,491 | 52.3 | |
| Republican | Jason Janvrin (incumbent) | 1,358 | 47.7 | |
| Total votes | 2,849 | 100.0 | ||
| Party | Candidate | Votes | % | |
|---|---|---|---|---|
| Republican | Max Abramson (incumbent) | 8,753 | 52.8 | |
| Democratic | Elaine Andrews-Ahearn | 7,818 | 47.2 | |
| Total votes | 16,571 | 100.0 | ||
| Republican hold | ||||
District 1 • District 2 • District 3 • District 4 • District 5 • District 6 • District 7 • District 8 • District 9 • District 10 • District 11 • District 12 • District 13 • District 14 • District 15 • District 16 • District 17 • District 18 • District 19 • District 20 • District 21 • District 22 • District 23 • District 24 • District 25 |
| Party | Candidate | Votes | % | |
|---|---|---|---|---|
| Republican | Glenn Bailey | 449 | 44.6 | |
| Republican | Peter Hayward (incumbent) | 300 | 29.8 | |
| Republican | Abigail Rooney (incumbent) | 257 | 25.6 | |
| Total votes | 1,006 | 100.0 | ||
| Party | Candidate | Votes | % | |
|---|---|---|---|---|
| Republican | Glenn Bailey | 2,030 | 39.5 | |
| Republican | Peter Hayward (incumbent) | 1,754 | 34.2 | |
| Democratic | Larry Brown | 1,350 | 26.3 | |
| Total votes | 5,134 | 100.0 | ||
| Republican hold | ||||
| Republican hold | ||||
| Party | Candidate | Votes | % | |
|---|---|---|---|---|
| Republican | James Horgan (incumbent) | 1,742 | 35.8 | |
| Republican | Joseph Pitre (incumbent) | 1,571 | 32.3 | |
| Democratic | Emmanuel Krasner | 1,548 | 31.9 | |
| Total votes | 4,861 | 100.0 | ||
| Republican hold | ||||
| Republican hold | ||||
| Party | Candidate | Votes | % | |
|---|---|---|---|---|
| Republican | Michael Harrington (incumbent) | 2,416 | 29.1 | |
| Republican | Kurt Wuelper (incumbent) | 2,386 | 28.7 | |
| Democratic | Jeff Allard | 1,765 | 21.2 | |
| Democratic | Heath Howard | 1,749 | 21.0 | |
| Total votes | 8,316 | 100.0 | ||
| Republican hold | ||||
| Republican hold | ||||
| Party | Candidate | Votes | % | |
|---|---|---|---|---|
| Republican | Len Turcotte | 2,844 | 26.3 | |
| Democratic | Cassandra Levesque (incumbent) | 2,755 | 25.5 | |
| Democratic | Matthew Towne (incumbent) | 2,611 | 24.1 | |
| Republican | Jenny Wilson | 2,604 | 24.1 | |
| Total votes | 10,814 | 100.0 | ||
| Republican gain from Democratic | ||||
| Democratic hold | ||||
| Party | Candidate | Votes | % | |
|---|---|---|---|---|
| Democratic | Jeffrey Salloway (incumbent) | 1,702 | 60.5 | |
| Republican | Scott Bugbee | 1,113 | 39.5 | |
| Total votes | 2,815 | 100.0 | ||
| Democratic hold | ||||
| Party | Candidate | Votes | % | |
|---|---|---|---|---|
| Democratic | Janet Wall (incumbent) | 1,981 | 19.5 | |
| Democratic | Marjorie Smith (incumbent) | 1,942 | 19.1 | |
| Democratic | Judith Spang (incumbent) | 1,880 | 18.5 | |
| Democratic | Timothy Horrigan (incumbent) | 1,648 | 16.2 | |
| Democratic | Cam Kenney (incumbent) | 1,557 | 15.3 | |
| Democratic | Wayne Burton | 1,177 | 11.6 | |
| Total votes | 10,185 | 100.0 | ||
| Party | Candidate | Votes | % | |
|---|---|---|---|---|
| Democratic | Janet Wall (incumbent) | 5,496 | 14.6 | |
| Democratic | Marjorie Smith (incumbent) | 5,443 | 14.4 | |
| Democratic | Judith Spang (incumbent) | 5,440 | 14.4 | |
| Democratic | Cam Kenney (incumbent) | 5,402 | 14.3 | |
| Democratic | Timothy Horrigan (incumbent) | 5,393 | 14.3 | |
| Republican | Bonnie McDermott | 2,291 | 6.1 | |
| Republican | Cheryl Lamoureux | 2,216 | 5.9 | |
| Republican | Mark Racic | 2,140 | 5.7 | |
| Republican | Cliff Zetterstrom | 2,031 | 5.4 | |
| Republican | James Ziegra | 1,934 | 5.1 | |
| Total votes | 37,786 | 100.0 | ||
| Democratic hold | ||||
| Democratic hold | ||||
| Democratic hold | ||||
| Democratic hold | ||||
| Democratic hold | ||||
| Party | Candidate | Votes | % | |
|---|---|---|---|---|
| Democratic | Timothy Fontneau (incumbent) | 1,409 | 50.1 | |
| Republican | Harrison deBree | 1,405 | 49.9 | |
| Total votes | 2,814 | 100.0 | ||
| Democratic hold | ||||
| Party | Candidate | Votes | % | |
|---|---|---|---|---|
| Democratic | Donna Ellis (incumbent) | 1,206 | 54.2 | |
| Republican | Kalmen Barkin | 1,021 | 45.8 | |
| Total votes | 2,227 | 100.0 | ||
| Democratic hold | ||||
| Party | Candidate | Votes | % | |
|---|---|---|---|---|
| Republican | Clifford Newton | 1,492 | 54.9 | |
| Democratic | Tom Ransom | 1,225 | 45.1 | |
| Total votes | 2,717 | 100.0 | ||
| Republican hold | ||||
| Party | Candidate | Votes | % | |
|---|---|---|---|---|
| Republican | Aidan Ankarberg | 313 | 68.5 | |
| Republican | Don Leeman | 144 | 31.5 | |
| Total votes | 457 | 100.0 | ||
| Party | Candidate | Votes | % | |
|---|---|---|---|---|
| Republican | Aidan Ankarberg | 1,994 | 100.0 | |
| Total votes | 1,994 | 100.0 | ||
| Republican hold | ||||
| Party | Candidate | Votes | % | |
|---|---|---|---|---|
| Democratic | Chuck Grassie (incumbent) | 1,324 | 51.5 | |
| Republican | Sue DeLemus | 1,245 | 48.5 | |
| Total votes | 2,569 | 100.0 | ||
| Democratic hold | ||||
| Party | Candidate | Votes | % | |
|---|---|---|---|---|
| Republican | Mac Kittredge (incumbent) | 1,451 | 53.0 | |
| Democratic | Anni DeVito | 1,288 | 47.0 | |
| Total votes | 2,739 | 100.0 | ||
| Republican hold | ||||
| Party | Candidate | Votes | % | |
|---|---|---|---|---|
| Democratic | Casey Conley (incumbent) | 2,164 | 71.2 | |
| Republican | Debra Childs | 877 | 28.8 | |
| Total votes | 3,041 | 100.0 | ||
| Democratic hold | ||||
| Party | Candidate | Votes | % | |
|---|---|---|---|---|
| Democratic | Kristina Fargo (incumbent) | 2,103 | 68.4 | |
| Republican | Mary Ann Copper | 974 | 31.6 | |
| Total votes | 3,077 | 100.0 | ||
| Democratic hold | ||||
| Party | Candidate | Votes | % | |
|---|---|---|---|---|
| Democratic | Ariel Oxaal | 625 | 69.8 | |
| Democratic | David Greene | 271 | 30.2 | |
| Total votes | 896 | 100.0 | ||
| Party | Candidate | Votes | % | |
|---|---|---|---|---|
| Democratic | Ariel Oxaal | 2,091 | 56.8 | |
| Republican | Tyler Blouin | 1,591 | 43.2 | |
| Total votes | 3,682 | 100.0 | ||
| Democratic hold | ||||
| Party | Candidate | Votes | % | |
|---|---|---|---|---|
| Democratic | Sherry Frost (incumbent) | 1,946 | 60.3 | |
| Republican | Steve Morgan | 1,281 | 39.7 | |
| Total votes | 3,227 | 100.0 | ||
| Democratic hold | ||||
| Party | Candidate | Votes | % | |
|---|---|---|---|---|
| Democratic | Susan Treleaven (incumbent) | 3,387 | 20.6 | |
| Democratic | Peter Bixby (incumbent) | 3,114 | 18.9 | |
| Democratic | Kenneth Vincent (incumbent) | 3,060 | 18.6 | |
| Republican | Mike Castaldo | 2,489 | 15.1 | |
| Republican | Edwina Hastings | 2,310 | 14.1 | |
| Republican | Simon Allie | 2,082 | 12.7 | |
| Total votes | 16,442 | 100.0 | ||
| Democratic hold | ||||
| Democratic hold | ||||
| Democratic hold | ||||
| Party | Candidate | Votes | % | |
|---|---|---|---|---|
| Republican | Matthew Spencer | 588 | 34.2 | |
| Republican | Jodi Lavoie-Carnes | 422 | 24.5 | |
| Republican | Steven McMahon | 410 | 23.8 | |
| Republican | Philip Munck | 300 | 17.4 | |
| Total votes | 1,720 | 100.0 | ||
| Party | Candidate | Votes | % | |
|---|---|---|---|---|
| Democratic | Wendy Chase (incumbent) | 3,255 | 19.6 | |
| Democratic | Cecilia Rich (incumbent) | 2,980 | 17.9 | |
| Democratic | Gerri Cannon (incumbent) | 2,965 | 17.8 | |
| Republican | Matthew Spencer | 2,666 | 16.0 | |
| Republican | Steven McMahon | 2,387 | 14.4 | |
| Republican | Jodi Lavoie-Carnes | 2,382 | 14.3 | |
| Total votes | 16,635 | 100.0 | ||
| Democratic hold | ||||
| Democratic hold | ||||
| Democratic hold | ||||
| Party | Candidate | Votes | % | |
|---|---|---|---|---|
| Democratic | Peter B. Schmidt (incumbent) | 4,300 | 70.5 | |
| Republican | William Burr | 1,797 | 29.5 | |
| Total votes | 6,097 | 100.0 | ||
| Democratic hold | ||||
| Party | Candidate | Votes | % | |
|---|---|---|---|---|
| Democratic | Tom Southworth (incumbent) | 3,997 | 58.3 | |
| Republican | Steven Wyrsch | 2,862 | 41.7 | |
| Total votes | 6,859 | 100.0 | ||
| Democratic hold | ||||
| Party | Candidate | Votes | % | |
|---|---|---|---|---|
| Democratic | Catt Sandler (incumbent) | 6,868 | 56.0 | |
| Republican | Philip Munck | 5,393 | 44.0 | |
| Total votes | 12,261 | 100.0 | ||
| Democratic hold | ||||
| Party | Candidate | Votes | % | |
|---|---|---|---|---|
| Republican | Thomas Kaczynski | 2,591 | 51.4 | |
| Democratic | Peg Higgins (incumbent) | 2,449 | 48.6 | |
| Total votes | 5,040 | 100.0 | ||
| Republican gain from Democratic | ||||
| Party | Candidate | Votes | % | |
|---|---|---|---|---|
| Republican | Fenton Groen | 2,945 | 52.5 | |
| Democratic | Sandra Keans (incumbent) | 2,666 | 47.5 | |
| Total votes | 5,611 | 100.0 | ||
| Republican gain from Democratic | ||||
| Party | Candidate | Votes | % | |
|---|---|---|---|---|
| Republican | Susan DeLemus | 2,876 | 54.6 | |
| Democratic | Jeremiah Minihan | 2,393 | 45.4 | |
| Total votes | 5,269 | 100.0 | ||
| Republican hold | ||||
| Party | Candidate | Votes | % | |
|---|---|---|---|---|
| Democratic | Amanda Gourgue (incumbent) | 4,524 | 53.0 | |
| Republican | Joe Hannon | 4,005 | 47.0 | |
| Total votes | 8,529 | 100.0 | ||
| Democratic hold | ||||
District 1 • District 2 • District 3 • District 4 • District 5 • District 6 • District 7 • District 8 • District 9 • District 10 • District 11 |
| Party | Candidate | Votes | % | |
|---|---|---|---|---|
| Democratic | Brian Sullivan (incumbent) | 3,353 | 30.8 | |
| Democratic | Lee Oxenham (incumbent) | 3,241 | 29.8 | |
| Republican | Virginia Drye | 2,392 | 22.0 | |
| Republican | Tanya McIntire | 1,898 | 17.4 | |
| Total votes | 10,884 | 100.0 | ||
| Democratic hold | ||||
| Democratic hold | ||||
| Party | Candidate | Votes | % | |
|---|---|---|---|---|
| Democratic | Sue Gottling | 1,446 | 50.9 | |
| Republican | Don Bettencourt | 1,393 | 49.1 | |
| Total votes | 2,839 | 100.0 | ||
| Democratic gain from Republican | ||||
| Party | Candidate | Votes | % | |
|---|---|---|---|---|
| Democratic | Andrew O'Hearne (incumbent) | 854 | 54.7 | |
| Republican | Patrick Lozito | 706 | 45.3 | |
| Total votes | 1,560 | 100.0 | ||
| Democratic hold | ||||
| Party | Candidate | Votes | % | |
|---|---|---|---|---|
| Democratic | Gary Merchant (incumbent) | 1,119 | 51.7 | |
| Republican | Paul LaCasse | 1,047 | 48.3 | |
| Total votes | 2,166 | 100.0 | ||
| Democratic hold | ||||
| Party | Candidate | Votes | % | |
|---|---|---|---|---|
| Republican | Walter Stapleton (incumbent) | 996 | 54.0 | |
| Democratic | Liza Draper | 849 | 46.0 | |
| Total votes | 1,845 | 100.0 | ||
| Republican hold | ||||
| Party | Candidate | Votes | % | |
|---|---|---|---|---|
| Republican | Skip Rollins (incumbent) | 2,428 | 36.3 | |
| Republican | John Callum (incumbent) | 1,792 | 26.8 | |
| Democratic | Larry Flint | 1,411 | 21.1 | |
| Democratic | Peter Franklin | 1,062 | 15.9 | |
| Total votes | 6,693 | 100.0 | ||
| Republican hold | ||||
| Republican hold | ||||
| Party | Candidate | Votes | % | |
|---|---|---|---|---|
| Republican | Judy Aron (incumbent) | 1,722 | 60.9 | |
| Democratic | Claudia Istel | 1,108 | 39.1 | |
| Total votes | 2,830 | 100.0 | ||
| Republican hold | ||||
| Party | Candidate | Votes | % | |
|---|---|---|---|---|
| Republican | Walter Spilsbury | 1,239 | 52.1 | |
| Democratic | John Streeter | 1,138 | 47.9 | |
| Total votes | 2,377 | 100.0 | ||
| Republican hold | ||||
| Party | Candidate | Votes | % | |
|---|---|---|---|---|
| Democratic | Linda Tanner (incumbent) | 6,022 | 48.2 | |
| Republican | Margaret Drye | 5,914 | 47.4 | |
| Libertarian | Tobin Menard | 546 | 4.4 | |
| Total votes | 12,482 | 100.0 | ||
| Democratic hold | ||||
| Party | Candidate | Votes | % | |
|---|---|---|---|---|
| Democratic | John Cloutier (incumbent) | 2,993 | 53.5 | |
| Republican | Jonathan Stone | 2,604 | 46.5 | |
| Total votes | 5,597 | 100.0 | ||
| Democratic hold | ||||
| Party | Candidate | Votes | % | |
|---|---|---|---|---|
| Republican | Steven D. Smith (incumbent) | 3,223 | 62.2 | |
| Democratic | Mary Henry | 1,961 | 37.8 | |
| Total votes | 5,184 | 100.0 | ||
| Republican hold | ||||

The Executive Council of the State of New Hampshire is the executive body of the U.S. state of New Hampshire. The Executive Council advises the Governor on all matters and provides a check on the governor's power. While the governor retains the right to veto legislation passed by the New Hampshire General Court, and commands the New Hampshire National Guard, the council has veto power over pardons, contracts with a value greater than $10,000, and nominations. The Executive Council Chambers have been located in the New Hampshire State House since the chambers were added to the capitol in 1909.
The New Hampshire House of Representatives is the lower house in the New Hampshire General Court, the bicameral legislature of the state of New Hampshire. The House of Representatives consists of 400 members coming from 203 legislative districts across the state, created from divisions of the state's counties. On average, each legislator represents about 3,300 residents, which is the smallest lower house representative-to-population ratio in the country.
In 2004, Democrats made large gains in Concord, winning the governorship, adding 30 seats in the House, two seats in the Senate, winning an Executive Council seat in District 5 for the first time since the 1960s, one of many races won by Democrats for the first time in decades.
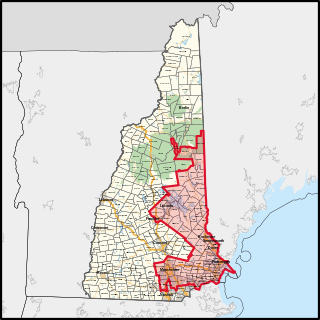
New Hampshire's 1st congressional district covers parts of Southern New Hampshire and the eastern portion of the state. The district contains parts of Hillsborough, Rockingham, Merrimack, Grafton, and Belknap counties; and the entirety of Strafford and Carroll counties.

New Hampshire's 2nd congressional district covers the western, northern, and some southern parts of New Hampshire. It includes the state's second-largest city, Nashua, as well as the state capital, Concord. It is currently represented in the United States House of Representatives by Democrat Ann McLane Kuster.
The 2008 United States House of Representatives elections in New Hampshire were held on November 4, 2008 to determine who would represent the state of New Hampshire in the United States House of Representatives during the 111th Congress from January 3, 2009 until January 3, 2011. Both seats were held by Democratic incumbents before the election, which coincided with the 2008 presidential election, as well as the state's senatorial and gubernatorial elections.
The 2010 congressional elections in New Hampshire were held on November 2, 2010 to determine who will represent the state of New Hampshire in the United States House of Representatives. It coincided with the state's senatorial and gubernatorial elections. Representatives are elected for two-year terms; those elected served in the 112th Congress from January 2011 until January 2013.
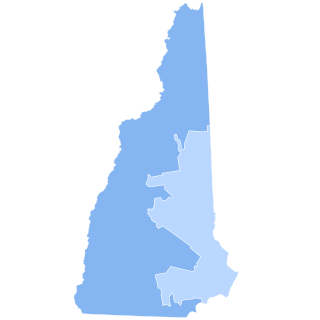
The 2012 United States House of Representatives elections in New Hampshire were held on Tuesday, November 6, 2012 to elect the two U.S. representatives from the state of New Hampshire. The elections coincided with the elections of other federal and state offices, including a quadrennial presidential election.

The 2002 New Hampshire gubernatorial election was held on November 5, 2002. Three-term incumbent Democratic Governor Jeanne Shaheen opted to unsuccessfully run for the United States Senate rather than seek a fourth term as governor. Republican Craig Benson, a self-funded businessman, defeated Democrat Mark Fernald, a state senator, in the general election after both won contested primary elections.

The 1992 United States presidential election in New Hampshire took place on November 3, 1992, as part of the 1992 United States presidential election. Voters chose four representatives, or electors to the Electoral College, who voted for president and vice president.

Christopher Charles Pappas is an American politician who has been the U.S. representative from New Hampshire's 1st congressional district since 2019. From 2013 to 2019, he represented the 4th district on the New Hampshire Executive Council. The district includes Manchester, two towns in Hillsborough, six towns in Merrimack, eight towns in Rockingham, and two towns in Strafford County.

The 1964 United States presidential election in New Hampshire took place on November 5, 1964, as part of the 1964 United States presidential election, which was held throughout all 50 states and D.C. Voters chose four representatives, or electors to the Electoral College, who voted for president and vice president.
The 1912 United States presidential election in New Hampshire took place on November 5, 1912, as part of the 1912 United States presidential election which was held throughout all contemporary 48 states. Voters chose four representatives, or electors to the Electoral College, who voted for president and vice president.

The 2018 New Hampshire House of Representatives elections took place as part of the biennial United States elections. New Hampshire voters elected all 400 state representatives from 103 districts. State representatives serve two-year terms in the New Hampshire House of Representatives. A primary election on September 11, 2018 determined which candidates appear on the November 6 general election ballot. All the members elected served in the 166th New Hampshire General Court.
The 2018 New Hampshire Executive Council elections were held on November 6, 2018 to elect all five members of the Executive Council of New Hampshire. The party primaries were held on September 11.
The 2020 New Hampshire House of Representatives elections took place as part of the biennial United States elections. New Hampshire voters elected all 400 state representatives from 204 districts. State representatives serve two-year terms in the New Hampshire House of Representatives. A primary election on September 8, 2020 determined which candidates appeared on the November 3 general election ballot. All the members elected will serve in the 167th New Hampshire General Court.
The 2020 New Hampshire Executive Council elections took place on Tuesday, November 3, 2020, to elect all five members of the Executive Council of New Hampshire. The party primaries were held on September 8.
The 2020 New Hampshire Senate elections took place as part of the biennial 2020 United States elections. New Hampshire voters elected state senators in all of the state's 24 senate districts. State senators serve two-year terms in the New Hampshire Senate, with all of the seats up for election each cycle. The primary elections on September 8, 2020, determined which candidates will appear on the November 3, 2020, general election ballot.

The 2022 New Hampshire House of Representatives election was held in the U.S. state of New Hampshire on November 8, 2022, to elect all 400 members of the House of Representatives of the 168th New Hampshire General Court.
The 2022 New Hampshire Senate elections took place as part of the biennial 2022 United States elections. New Hampshire voters elected state senators in all of the state's 24 senate districts. State senators serve two-year terms in the New Hampshire Senate, with all of the seats up for election each cycle. The primary elections held on September 13, 2022, determined which candidates would appear on the November 8, 2022, general election ballot.