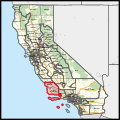
California's 24th congressional district

Last updated

California's 24th congressional district
California's 24th congressional district (since 2023).svg
California's 24th congressional district
Interactive map of district boundaries since 2023 (Used in the 2022 elections)
Representative
Population (2023)761,285
Median household
income
$91,972 [1]
Ethnicity
Cook PVI D+13 [2]

California's 24th congressional district is a congressional district in the U.S. state of California. The district is currently represented by Salud Carbajal. It contains all of Santa Barbara County, most of San Luis Obispo County, and part of Ventura County. Cities in the district include Santa Barbara, Ventura, San Luis Obispo, Santa Maria, and Ojai. [3]

Contents

Prior to redistricting in 2011, the district covered the inland portions of Ventura and Santa Barbara counties, as well as a sparsely-populated portion of the Ventura County coast. Redistricting in 2021 removed the northern part of San Luis Obispo County and added the cities of Ojai and Ventura.

Recent election results from statewide races

YearOfficeResults [4] [5] [6]
2008 President Obama 60% - 40%
2010 Governor Brown 49% - 45%
Lt. Governor Maldonado 47% - 44%
Secretary of State Bowen 50% - 41%
Attorney General Cooley 47% - 43%
Treasurer Lockyer 54% - 39%
Controller Chiang 51% - 42%
2012 President Obama 58% - 42%
2014 Governor Brown 59% - 41%
2016 President Clinton 59% - 34%
2018 Governor Newsom 59% - 41%
Attorney General Becerra 61% - 39%
2020 President Biden 63% - 34%
2022 Senate (Reg.) Padilla 61% - 39%
Governor Newsom 59% - 41%
Lt. Governor Kounalakis 60% - 40%
Secretary of State Weber 60% - 40%
Attorney General Bonta 59% - 41%
Treasurer Ma 59% - 41%
Controller Cohen 55% - 45%
2024 President Harris 61% - 36%
Senate (Reg.) Schiff 60% - 40%

Composition

#CountySeatPopulation
79 San Luis Obispo San Luis Obispo 281,639
83 Santa Barbara Santa Barbara 441,257
111 Ventura Ventura 829,590

As of the 2020 redistricting, California's 24th congressional district is located on the southern edge of the Central Coast. It encompasses Santa Barbara County, most of San Luis Obispo County and part of Ventura County. The district also takes in six of the Channel Islands.

San Luis Obispo County is split between this district and the 19th district. They are partitioned by Highway 1, Cayucos Creek Rd, Thunder Canyon Rd, Old Creek Rd, Santa Rita Rd, Tara Creek, Fuentes Rd, Highway 41, San Miguel Rd, Palo Verde Rd, Old Morro Rd, Los Osos Rd, San Rafael Rd, Atascadero Ave, San Antonio Rd, N Santa Margarita Rd, Santa Clara Rd, Rocky Canyon Truck Trail, Highway 229, Lion Ridge Rd, O'Donovan Rd, Highway 58, Calf Canyon Highway, La Panza Rd, Upton Canyon Rd, Camatta Creek Rd, San Juan Creek, and Bitterwater Rd. The 24th district takes in the cities of San Luis Obispo, Arroyo Grande, Morro Bay, Grover Beach, and Pismo Beach as well as the census-designated places Nipomo, Los Osos, Cayucos, Garden Farms, Santa Margarita, California Polytechnic State University, Los Ranchos, Edna, Avila Beach, Oceano, Los Berros, Callender, Blacklake, and Woodlands

Ventura County is split between this district and the 26th district. They are partitioned by Highway 150, Los Padres National Park, Highway 33, Cozy del, Cozy Ojai Rd, Shelf Road Trail, Gridley Rd, Grand Ave, Thatcher Creek, Boardman Rd, Sulphur Mountain Rd, Cahada Larga Rd, Highway 33, Shell Rd E, Manuel Canyon Rd, Aliso St, Willoughby Rd, Aliso Canyon Rd, Foothill Rd, N Wells Rd, Highway 126, Highway 118, Brown Barranca, Montgomery Ave, Telephone Rd, Rameli Ave, Harmon Barranca, Johnson Dr, S Victoria Ave, Highway 101, E Harbor Blvd, and Olivias Park Dr. The 24th district takes in most of the city of Ventura.

Cities and CDPs with 10,000 or more people

2,500 – 10,000 people

List of members representing the district

Representatives from California's 24th congressional district
MemberPartyDatesCong
ress
Electoral historyCounties
District created January 3, 1953
NorrisPoulson.jpg
Norris Poulson
(Los Angeles)
Republican January 3, 1953 –
June 11, 1953
83rd Redistricted from the 13th district and re-elected in 1952.
Resigned to become Mayor of Los Angeles.
1953–1963
Los Angeles
VacantJune 11, 1953 –
November 10, 1953
Glenard P. Lipscomb.jpg
Glenard P. Lipscomb
(Los Angeles)
Republican November 10, 1953 –
February 1, 1970
83rd
84th
85th
86th
87th
88th
89th
90th
91st
Elected to finish Poulson's term.
Re-elected in 1954.
Re-elected in 1956.
Re-elected in 1958.
Re-elected in 1960.
Re-elected in 1962.
Re-elected in 1964.
Re-elected in 1966.
Re-elected in 1968.
Died.
1963–1973
Los Angeles, southwestern San Bernardino
VacantFebruary 1, 1970 –
June 30, 1970
91st
John H. Rousselot.jpg
John H. Rousselot
(San Marino)
Republican June 30, 1970 –
January 3, 1975
91st
92nd
93rd
Elected to finish Lipscomb's term.
Re-elected later in 1970.
Re-elected in 1972.
Redistricted to the 26th district .
1973–1983
Los Angeles
Henry Waxman, official photo portrait color.jpg
Henry Waxman
(Los Angeles)
Democratic January 3, 1975 –
January 3, 1993
94th
95th
96th
97th
98th
99th
100th
101st
102nd
Elected in 1974.
Re-elected in 1976.
Re-elected in 1978.
Re-elected in 1980.
Re-elected in 1982.
Re-elected in 1984.
Re-elected in 1986.
Re-elected in 1988.
Re-elected in 1990.
Redistricted to the 29th district .
1983–1993
North central Los Angeles (Hollywood)
Abeilenson.jpg
Anthony C. Beilenson
(Los Angeles)
Democratic January 3, 1993 –
January 3, 1997
103rd
104th
Redistricted from the 23rd district and re-elected in 1992.
Re-elected in 1994.
Retired.
1993–2003
Southwestern Los Angeles, southeastern Ventura (Thousand Oaks)
Brad Sherman, official photo portrait, color.jpg
Brad Sherman
(Los Angeles)
Democratic January 3, 1997 –
January 3, 2003
105th
106th
107th
Elected in 1996.
Re-elected in 1998.
Re-elected in 2000.
Redistricted to the 27th district .
Elton Gallegly Portrait.jpg
Elton Gallegly
(Simi Valley)
Republican January 3, 2003 –
January 3, 2013
108th
109th
110th
111th
112th
Redistricted from the 23rd district and re-elected in 2002.
Re-elected in 2004.
Re-elected in 2006.
Re-elected in 2008.
Re-elected in 2010.
Retired.
2003–2013
CA-24th.png
Inland Santa Barbara, most of Ventura
Lois Capps 2011 official photo.jpg
Lois Capps
(Santa Barbara)
Democratic January 3, 2013 –
January 3, 2017
113th
114th
Redistricted from the 23rd district and re-elected in 2012.
Re-elected in 2014.
Retired.
2013–2023
California US Congressional District 24 (since 2013).tif
Central Coast including San Luis Obispo and Santa Barbara
Salud Carbajal official photo.jpg
Salud Carbajal
(Santa Barbara)
Democratic January 3, 2017 –
present
115th
116th
117th
118th
119th
Elected in 2016.
Re-elected in 2018.
Re-elected in 2020.
Re-elected in 2022.
Re-elected in 2024.
2023–present
California's 24th congressional district (since 2023) (new version).svg

Election results

19521953 (Special)195419561958196019621964196619681970 (Special)197019721974197619781980198219841986198819901992199419961998200020022004200620082010201220142016201820202022

1952

United States House of Representatives elections, 1952 [7]
PartyCandidateVotes%
Republican Norris Poulson (incumbent) 119,799 87.4
Progressive Bertram L. Sharp17,30712.6
Total votes137,106 100.0
Turnout  
Republican hold

1953 (Special)

Republican Glenard P. Lipscomb won the special election to replace fellow Republican Norris Poulson, who was elected Mayor of Los Angeles. Data for this special election is not available. [8]

1954

United States House of Representatives elections, 1954 [9]
PartyCandidateVotes%
Republican Glenard P. Lipscomb (inc.) 65,431 56.9
Democratic George Arnold49,59243.1
Total votes115,023 100.0
Turnout  
Republican hold

1956

United States House of Representatives elections, 1956 [10]
PartyCandidateVotes%
Republican Glenard P. Lipscomb (inc.) 84,120 61.9
Democratic Fay Porter51,69238.1
Total votes135,812 100.0
Turnout  
Republican hold

1958

United States House of Representatives elections, 1958 [11]
PartyCandidateVotes%
Republican Glenard P. Lipscomb (inc.) 68,184 56.4
Democratic William H. Ware, Jr.52,80443.6
Total votes120,988 100.0
Turnout  
Republican hold

1960

United States House of Representatives elections, 1960 [12]
PartyCandidateVotes%
Republican Glenard P. Lipscomb (inc.) 82,497 59.7
Democratic Norman Hass55,61340.3
Total votes138,110 100.0
Turnout  
Republican hold

1962

United States House of Representatives elections, 1962 [13]
PartyCandidateVotes%
Republican Glenard P. Lipscomb (inc.) 120,884 70.3
Democratic Knox Mellon50,97029.7
Total votes171,854 100.0
Turnout  
Republican hold

1964

United States House of Representatives elections, 1964 [14]
PartyCandidateVotes%
Republican Glenard P. Lipscomb (inc.) 139,784 67.9
Democratic Bryan W. Stevens65,96732.1
Total votes205,751 100.0
Turnout  
Republican hold

1966

United States House of Representatives elections, 1966 [15]
PartyCandidateVotes%
Republican Glenard P. Lipscomb (inc.) 148,190 76.3
Democratic Earl G. McNall46,11523.7
Total votes194,305 100.0
Turnout  
Republican hold

1968

United States House of Representatives elections, 1968 [16]
PartyCandidateVotes%
Republican Glenard P. Lipscomb (inc.) 152,180 72.8
Democratic Fred Warner Neal56,72327.2
Total votes208,903
Republican hold

1970 (Special)

1970 special election [17]
PartyCandidateVotes%
Republican John H. Rousselot 62,749 68.2
Democratic Myrlie B. Evers 29,24831.8
Total votes91,997 100.0
Turnout  
Republican hold

1970

United States House of Representatives elections, 1970 [18]
PartyCandidateVotes%
Republican John H. Rousselot (inc.) 124,071 65.1
Democratic Myrlie B. Evers 61,77732.4
American Independent Brian Scanlon3,0181.6
Peace and Freedom Harold Kaplan1,8581.0
Total votes190,724 100.0
Turnout  
Republican hold

1972

United States House of Representatives elections, 1972 [19]
PartyCandidateVotes%
Republican John H. Rousselot (inc.) 141,274 70.1
Democratic Luther Mandell60,17029.9
Total votes201,444
Republican hold

1974

United States House of Representatives elections, 1974 [20]
PartyCandidateVotes%
Democratic Henry Waxman 85,343 64.0
Republican Elliott Stone Graham43,68033.0
American Independent David E. Davis3,9803.0
Total votes133,003 100.0
Turnout  
Democratic hold

1976

United States House of Representatives elections, 1976 [21]
PartyCandidateVotes%
Democratic Henry Waxman (incumbent) 108,296 67.8
Republican David Irvins Simmons51,47832.2
Total votes159,774 100.0
Turnout  
Democratic hold

1978

United States House of Representatives elections, 1978 [22]
PartyCandidateVotes%
Democratic Henry Waxman (incumbent) 85,075 62.7
Republican Howard G. Schaefer44,24332.6
Peace and Freedom Kevin Casey Peters6,4534.8
Total votes135,771 100.0
Turnout  
Democratic hold

1980

United States House of Representatives elections, 1980 [23]
PartyCandidateVotes%
Democratic Henry Waxman (incumbent) 93,569 63.8
Republican Roland Cayard39,74427.1
Peace and Freedom Margaret "Maggie" Feigin5,9054.0
Libertarian Robert E. Lehman5,1723.5
American Independent Jack Smilowitz2,3411.6
Total votes146,731 100.0
Turnout  
Democratic hold

1982

United States House of Representatives elections, 1982 [24]
PartyCandidateVotes%
Democratic Henry Waxman (incumbent) 88,516 65.1
Republican Jerry Zerg42,13331.0
Libertarian Jeff Mandel5,4201.8
Total votes136,069 100.0
Turnout  
Democratic hold

1984

United States House of Representatives elections, 1984 [25]
PartyCandidateVotes%
Democratic Henry Waxman (incumbent) 97,340 63.4
Republican Jerry Zerg51,01033.2
Peace and Freedom James Green2,7801.8
Libertarian Tim Custer2,4771.6
Total votes153,607 100.0
Turnout  
Democratic hold

1986

United States House of Representatives elections, 1986 [26]
PartyCandidateVotes%
Democratic Henry Waxman (incumbent) 103,914 87.9
Libertarian George Abrahams8,8717.5
Peace and Freedom James Green5,3884.6
Total votes118,173 100.0
Turnout  
Democratic hold

1988

United States House of Representatives elections, 1988 [27]
PartyCandidateVotes%
Democratic Henry Waxman (incumbent) 112,038 72.2
Republican John N. Cowles36,83523.8
Peace and Freedom James Green3,5712.3
Libertarian George Abrahams2,6271.7
Total votes155,071 100.0
Turnout  
Democratic hold

1990

United States House of Representatives elections, 1990 [28]
PartyCandidateVotes%
Democratic Henry Waxman (incumbent) 71,562 68.9
Republican John N. Cowles26,60725.6
Peace and Freedom Maggie Phair5,7065.5
Total votes103,875 100.0
Turnout  
Democratic hold

1992

United States House of Representatives elections, 1992 [29]
PartyCandidateVotes%
Democratic Anthony C. Beilenson (inc.) 141,742 55.5
Republican Tom McClintock 99,83539.1
Peace and Freedom John Paul Lindblad13,6905.4
Total votes255,267 100.0
Turnout  
Democratic hold

1994

United States House of Representatives elections, 1994 [30]
PartyCandidateVotes%
Democratic Anthony C. Beilenson (inc.) 95,342 49.35
Republican Rich Sybert91,80647.52
Libertarian John C. Koehler6,0313.12
Total votes193,179 100.0
Turnout  
Democratic hold

1996

United States House of Representatives elections, 1996 [31]
PartyCandidateVotes%
Democratic Brad Sherman 106,193 49.5
Republican Rich Sybert93,62943.6
Peace and Freedom Ralph Shroyer6,2672.9
Libertarian Erich Miller5,6912.6
Natural Law Ron Lawrence3,0681.4
Total votes214,848 100.0
Turnout  
Democratic hold

1998

United States House of Representatives elections, 1998 [32]
PartyCandidateVotes%
Democratic Brad Sherman (incumbent) 103,491 57.31
Republican Randy Hoffman69,50138.49
Natural Law Catherine Carter3,0331.68
Libertarian Erich D. Miller2,6951.49
Peace and Freedom Ralph Shroyer1,8601.03
Total votes180,580 100.0
Turnout  
Democratic hold

2000

United States House of Representatives elections, 2000 [33]
PartyCandidateVotes%
Democratic Brad Sherman (incumbent) 155,398 66.1
Republican Jerry Doyle 70,16929.8
Libertarian Juan Carlos Ros6,9662.9
Natural Law Michael Cuddehe2,9111.2
Total votes235,444 100.0
Turnout  
Democratic hold

2002

United States House of Representatives elections, 2002 [34]
PartyCandidateVotes%
Republican Elton Gallegly (incumbent) 120,585 65.2
Democratic Fern Rudin58,75531.8
Libertarian Gary Harber5,6663.0
Total votes185,006 100.0
Turnout  
Republican hold

2004

United States House of Representatives elections, 2004 [35]
PartyCandidateVotes%
Republican Elton Gallegly (incumbent) 178,660 62.9
Democratic Brett Wagner96,39733.9
Green Stuart A. Bechman9,3213.2
Total votes284,378 100.0
Turnout  
Republican hold

2006

United States House of Representatives elections, 2006 [36]
PartyCandidateVotes%
Republican Elton Gallegly (incumbent) 129,812 62.1
Democratic Jill M. Martinez 79,46137.9
No partyMichael Kurt Stettler (write-in)160.0
No partyHenry Nicolle (write-in)30.0
Total votes209,292 100.0
Turnout  
Republican hold

2008

[37]

United States House of Representatives elections, 2008 [38]
PartyCandidateVotes%
Republican Elton Gallegly (incumbent) 174,492 58.20
Democratic Marta Ann Jorgensen125,56041.80
Turnout  
Republican hold

2010

[39]

United States House of Representatives elections, 2010 [40]
PartyCandidateVotes%
Republican Elton Gallegly (incumbent) 144,055 59.94
Democratic Timothy J. Allison96,27940.06
Turnout  
Republican hold

2012

California's 24th congressional district election, 2012
Primary election
PartyCandidateVotes%
Democratic Lois Capps (incumbent)72,35646.4
Republican Abel Maldonado 46,29529.7
Republican Chris Mitchum33,60421.5
No party preference Matt Boutté3,8322.5
Total votes156,087 100.0
General election
Democratic Lois Capps (incumbent) 156,749 55.1
Republican Abel Maldonado 127,74644.9
Total votes284,495 100.0
Democratic hold

2014

[41]

California's 24th congressional district election, 2014 [42]
Primary election
PartyCandidateVotes%
Democratic Lois Capps (incumbent)45,48244.5
Republican Christopher Mitchum 15,92715.6
Republican Justin Donald Fareed15,01314.7
Republican Dale Francisco12,25612.0
Republican Bradley Allen6,5736.4
Democratic Sandra J. Marshall-Eminger3,6753.6
Democratic Paul H. Coyne, Jr.1,7531.7
No party preference Steve Isakson9470.9
Republican Alexis Stuart5270.5
Total votes102,153 100.00
General election
Democratic Lois Capps (incumbent) 103,228 52%
Republican Christopher Mitchum 95,56648%
Total votes198,794 100%
Democratic hold

2016

California's 24th congressional district election, 2016
Primary election
PartyCandidateVotes%
Democratic Salud Carbajal 66,40231.9
Republican Justin Fareed42,52120.5
Republican Katcho Achadjian 37,71618.1
Democratic Helene Schneider 31,04614.9
Democratic William "Bill" Ostrander12,6576.1
Republican Matt T. Kokkonen11,6365.6
No party preference John Uebersax2,1881.1
No party preference Steve Isakson2,1721.0
Democratic Benjamin Lucas1,5680.8
Total votes207,906 100.0
General election
Democratic Salud Carbajal 166,034 53.4
Republican Justin Fareed144,78046.6
Total votes310,814 100.0
Democratic hold

2018

California's 24th congressional district election, 2018
Primary election
PartyCandidateVotes%
Democratic Salud Carbajal (incumbent)94,55853.6
Republican Justin Fareed64,17736.4
Republican Michael E. Woody17,71510.0
General election
Democratic Salud Carbajal (incumbent) 166,550 58.6
Republican Justin Fareed117,88141.4
Total votes284,431 100.0
Democratic hold

2020

2020 United States House of Representatives elections in California
PartyCandidateVotes%
Democratic Salud Carbajal (incumbent)139,97357.8
Republican Andy Caldwell92,53738.2
No party preference Kenneth Young9,6504.0
Total votes242,160 100.0
General election
Democratic Salud Carbajal (incumbent) 212,564 58.7
Republican Andy Caldwell149,78141.3
Total votes362,345 100.0
Democratic hold

2022

2022 United States House of Representatives elections in California
PartyCandidateVotes%
Democratic Salud Carbajal (incumbent)111,19960.0
Republican Brad Allen57,53231.0
No party preference Michele R. Weslander Quaid13,8807.5
No party preference Jeff Frankenfield2,7321.5
Total votes185,343 100.0
General election
Democratic Salud Carbajal (incumbent) 159,019 60.6
Republican Brad Allen103,53339.4
Total votes262,552 100.0
Democratic hold

See also

References

  1. "My Congressional District".
  2. "2022 Cook PVI: District Map and List". Cook Political Report. Retrieved January 10, 2023.
  3. "CA 2022 Congressional". Dave's Redistricting. January 4, 2022. Retrieved November 14, 2022.
  4. https://davesredistricting.org/maps#viewmap::fc9d2d06-7c7f-451c-92cb-122127a79c29
  5. "Complete Supplement to the Statement of Vote" (PDF). November 8, 2022. Archived (PDF) from the original on January 8, 2025. Retrieved January 21, 2025.
  6. Giroux, Greg (January 24, 2025). "Two California Democrats Chart Middle Course in Trump Districts". Bloomberg Government . Retrieved February 5, 2025.
  7. 1952 election results
  8. 1953 special election results
  9. 1954 election results
  10. 1956 election results
  11. 1958 election results
  12. 1960 election results
  13. 1962 election results
  14. 1964 election results
  15. 1966 election results
  16. 1968 election results
  17. 1970 special election results
  18. 1970 election results
  19. 1972 election results
  20. 1974 election results
  21. 1976 election results
  22. 1978 election results
  23. 1980 election results
  24. 1982 election results
  25. 1984 election results
  26. 1986 election results
  27. 1988 election results
  28. 1990 election results
  29. 1992 election results
  30. 1994 election results
  31. 1996 election results
  32. 1998 election results
  33. 2000 election results
  34. 2002 general election results Archived February 3, 2009, at the Wayback Machine
  35. 2004 general election results [ permanent dead link ]
  36. 2006 general election results Archived November 27, 2008, at the Wayback Machine
  37. Statement of Vote November 4, 2008, General Election Archived October 18, 2012, at the Wayback Machine
  38. STATISTICS OF THE PRESIDENTIAL AND CONGRESSIONAL ELECTION OF NOVEMBER 4, 2008
  39. Statement of Vote November 2, 2010, General Election [ permanent dead link ]
  40. STATISTICS OF THE PRESIDENTIAL AND CONGRESSIONAL ELECTION OF NOVEMBER 2, 2010
  41. U.S. House of Representatives District 24 - Districtwide Results
  42. "2016 General Election Results | California Secretary of State". Archived from the original on November 17, 2016. Retrieved November 17, 2016.

34°36′N119°42′W / 34.6°N 119.7°W / 34.6; -119.7