This is a list of electoral division results for the Australian 1913 federal election.
Party | Candidate | Votes | % | ±% | |
---|---|---|---|---|---|
Labor | Josiah Thomas | 15,047 | 76.8 | +7.6 | |
Liberal | Arthur Harrison | 4,537 | 23.2 | −7.6 | |
Total formal votes | 19,584 | 96.3 | |||
Informal votes | 750 | 3.7 | |||
Turnout | 20,334 | 62.2 | |||
Labor hold | Swing | +7.6 | |||
Party | Candidate | Votes | % | ±% | |
---|---|---|---|---|---|
Liberal | Henry Pigott | 11,848 | 52.1 | +5.9 | |
Labor | Thomas Brown | 10,911 | 47.9 | −5.9 | |
Total formal votes | 22,759 | 97.1 | |||
Informal votes | 691 | 2.9 | |||
Turnout | 23,450 | 69.0 | |||
Liberal gain from Labor | Swing | +5.9 | |||
Party | Candidate | Votes | % | ±% | |
---|---|---|---|---|---|
Labor | James Catts | 17,271 | 58.7 | −2.3 | |
Liberal | David Doull | 11,473 | 39.0 | +0.0 | |
Independent | Tom Walsh | 661 | 2.2 | +2.2 | |
Total formal votes | 29,405 | 96.9 | |||
Informal votes | 942 | 3.1 | |||
Turnout | 30,347 | 71.2 | |||
Labor hold | Swing | −1.1 | |||
Party | Candidate | Votes | % | ±% | |
---|---|---|---|---|---|
Liberal | John Thomson | 17,152 | 72.2 | +4.1 | |
Labor | Con Hogan | 6,620 | 27.8 | −0.9 | |
Total formal votes | 23,772 | 97.6 | |||
Informal votes | 576 | 2.4 | |||
Turnout | 24,348 | 66.1 | |||
Liberal hold | Swing | +2.5 | |||
Party | Candidate | Votes | % | ±% | |
---|---|---|---|---|---|
Labor | Robert Howe | 17,520 | 57.7 | +1.1 | |
Liberal | Harry Scott | 12,829 | 42.3 | −1.1 | |
Total formal votes | 30,349 | 98.3 | |||
Informal votes | 519 | 1.7 | |||
Turnout | 30,868 | 74.0 | |||
Labor hold | Swing | +1.1 | |||
Party | Candidate | Votes | % | ±% | |
---|---|---|---|---|---|
Labor | William Spence | 11,582 | 60.5 | −4.2 | |
Liberal | Edwin Townsend | 7,560 | 39.5 | +4.2 | |
Total formal votes | 19,142 | 95.3 | |||
Informal votes | 942 | 4.7 | |||
Turnout | 20,081 | 62.7 | |||
Labor hold | Swing | −4.2 | |||
Party | Candidate | Votes | % | ±% | |
---|---|---|---|---|---|
Labor | John West | 14,174 | 56.1 | -0.1 | |
Liberal | John Willson | 11,077 | 43.9 | +0.1 | |
Total formal votes | 25,251 | 97.2 | |||
Informal votes | 733 | 2.8 | |||
Turnout | 25,984 | 58.0 | |||
Labor hold | Swing | -0.1 | |||
Party | Candidate | Votes | % | ±% | |
---|---|---|---|---|---|
Liberal | Austin Chapman | 13,321 | 58.7 | -41.3 | |
Labor | Harry Lestrange | 9,367 | 41.3 | +41.3 | |
Total formal votes | 22,688 | 97.3 | |||
Informal votes | 628 | 2.7 | |||
Turnout | 23,317 | 70.5 | |||
Liberal hold | Swing | -41.3 | |||
Party | Candidate | Votes | % | ±% | |
---|---|---|---|---|---|
Labor | William Webster | 11,296 | 52.2 | -7.3 | |
Liberal | John Blackney | 10,348 | 47.8 | +7.3 | |
Total formal votes | 21,644 | 96.2 | |||
Informal votes | 851 | 3.8 | |||
Turnout | 22,495 | 62.2 | |||
Labor hold | Swing | -7.3 | |||
Party | Candidate | Votes | % | ±% | |
---|---|---|---|---|---|
Liberal | Robert Patten | 11,575 | 50.7 | +16.2 | |
Independent | Sir William Lyne | 11,236 | 49.3 | −9.6 | |
Total formal votes | 22,811 | 96.4 | |||
Informal votes | 858 | 3.6 | |||
Turnout | 23,669 | 68.1 | |||
Liberal gain from Independent | Swing | +16.2 | |||
Party | Candidate | Votes | % | ±% | |
---|---|---|---|---|---|
Labor | Matthew Charlton | 12,884 | 54.5 | -2.4 | |
Liberal | John Fegan | 10,763 | 45.5 | +2.4 | |
Total formal votes | 23,647 | 98.1 | |||
Informal votes | 462 | 1.9 | |||
Turnout | 24,109 | 67.2 | |||
Labor hold | Swing | -2.4 | |||
Party | Candidate | Votes | % | ±% | |
---|---|---|---|---|---|
Labor | George Burns | 14,852 | 50.2 | -2.7 | |
Liberal | George Fuller | 14,746 | 49.8 | +2.7 | |
Total formal votes | 29,598 | 97.4 | |||
Informal votes | 794 | 2.6 | |||
Turnout | 30,392 | 77.7 | |||
Labor hold | Swing | -2.7 | |||
Party | Candidate | Votes | % | ±% | |
---|---|---|---|---|---|
Liberal | Elliot Johnson | 18,293 | 57.1 | +4.7 | |
Labor | Hector Lamond | 13,714 | 42.9 | -4.7 | |
Total formal votes | 32,007 | 97.0 | |||
Informal votes | 1,002 | 3.0 | |||
Turnout | 33,009 | 74.0 | |||
Liberal hold | Swing | +4.7 | |||
Party | Candidate | Votes | % | ±% | |
---|---|---|---|---|---|
Labor | Ernest Carr | 11,163 | 50.0 | -9.1 | |
Liberal | Robert Moore | 10,451 | 46.9 | +6.0 | |
Independent | Henry Fletcher | 693 | 3.1 | +3.1 | |
Total formal votes | 22,307 | 95.6 | |||
Informal votes | 1,015 | 4.4 | |||
Turnout | 23,322 | 66.9 | |||
Labor hold | Swing | -7.5 | |||
Party | Candidate | Votes | % | ±% | |
---|---|---|---|---|---|
Liberal | Richard Orchard | 16,322 | 54.2 | -4.7 | |
Labor | George Cann | 12,947 | 43.0 | +2.0 | |
Independent | Alexander Huie | 835 | 2.8 | +2.8 | |
Total formal votes | 30,104 | 96.7 | |||
Informal votes | 1,015 | 3.3 | |||
Turnout | 31,119 | 72.6 | |||
Liberal hold | Swing | -3.3 | |||
Party | Candidate | Votes | % | ±% | |
---|---|---|---|---|---|
Labor | David Watkins | 17,865 | 73.8 | -7.6 | |
Liberal | Thomas Collins | 6,334 | 26.2 | +7.6 | |
Total formal votes | 24,199 | 96.8 | |||
Informal votes | 812 | 3.2 | |||
Turnout | 25,011 | 67.6 | |||
Labor hold | Swing | -7.6 | |||
Party | Candidate | Votes | % | ±% | |
---|---|---|---|---|---|
Liberal | Percy Abbott | 14,248 | 56.5 | +10.1 | |
Labor | Frank Foster | 10,978 | 43.5 | -8.9 | |
Total formal votes | 25,226 | 98.1 | |||
Informal votes | 500 | 1.9 | |||
Turnout | 25,726 | 72.4 | |||
Liberal gain from Labor | Swing | +9.5 | |||
Party | Candidate | Votes | % | ±% | |
---|---|---|---|---|---|
Liberal | Granville Ryrie | 21,639 | 69.1 | +1.8 | |
Labor | Martin Shannon | 9,659 | 30.9 | -0.5 | |
Total formal votes | 31,298 | 95.4 | |||
Informal votes | 1,511 | 4.6 | |||
Turnout | 32,809 | 73.2 | |||
Liberal hold | Swing | +1.1 | |||
Party | Candidate | Votes | % | ±% | |
---|---|---|---|---|---|
Liberal | Bruce Smith | 20,424 | 61.9 | +18.0 | |
Labor | William Russell | 12,546 | 38.1 | +1.4 | |
Total formal votes | 32,970 | 97.0 | |||
Informal votes | 1,006 | 3.0 | |||
Turnout | 33,976 | 75.7 | |||
Liberal hold | Swing | +8.3 | |||
Party | Candidate | Votes | % | ±% | |
---|---|---|---|---|---|
Liberal | Joseph Cook | 20,727 | 68.3 | +4.2 | |
Labor | Oscar Zieman | 9,603 | 31.7 | -3.9 | |
Total formal votes | 30,330 | 96.1 | |||
Informal votes | 1,227 | 3.9 | |||
Turnout | 31,557 | 74.4 | |||
Liberal hold | Swing | +4.0 | |||
Party | Candidate | Votes | % | ±% | |
---|---|---|---|---|---|
Liberal | Walter Massy-Greene | 16,954 | 69.9 | +32.3 | |
Labor | Percy Tighe | 7,286 | 30.1 | +15.4 | |
Total formal votes | 24,240 | 97.9 | |||
Informal votes | 510 | 2.1 | |||
Turnout | 24,750 | 71.2 | |||
Liberal hold | Swing | +15.7 | |||
Party | Candidate | Votes | % | ±% | |
---|---|---|---|---|---|
Liberal | Franc Falkiner | 11,674 | 51.0 | +10.0 | |
Labor | John Chanter | 11,208 | 49.0 | -7.2 | |
Total formal votes | 22,882 | 97.7 | |||
Informal votes | 550 | 2.3 | |||
Turnout | 23,432 | 64.8 | |||
Liberal gain from Labor | Swing | +8.6 | |||
Party | Candidate | Votes | % | ±% | |
---|---|---|---|---|---|
Liberal | William Fleming | 12,566 | 55.3 | +4.5 | |
Labor | William Johnson | 10,143 | 44.7 | -4.5 | |
Total formal votes | 22,709 | 97.2 | |||
Informal votes | 653 | 2.8 | |||
Turnout | 23,362 | 70.4 | |||
Liberal hold | Swing | +4.5 | |||
Party | Candidate | Votes | % | ±% | |
---|---|---|---|---|---|
Labor | Edward Riley | 17,584 | 65.0 | -4.3 | |
Liberal | Douglas Cooper | 9,489 | 35.0 | +4.3 | |
Total formal votes | 27,073 | 97.3 | |||
Informal votes | 750 | 2.7 | |||
Turnout | 27,823 | 66.4 | |||
Labor hold | Swing | -4.3 | |||
Party | Candidate | Votes | % | ±% | |
---|---|---|---|---|---|
Liberal | Willie Kelly | 18,375 | 61.7 | +0.0 | |
Labor | Sydney Green | 11,386 | 38.3 | -0.0 | |
Total formal votes | 29,761 | 97.1 | |||
Informal votes | 877 | 2.9 | |||
Turnout | 30,638 | 71.2 | |||
Liberal hold | Swing | +0.0 | |||
Party | Candidate | Votes | % | ±% | |
---|---|---|---|---|---|
Liberal | Alfred Conroy | 13,998 | 55.9 | +6.5 | |
Labor | Richard Corish | 11,062 | 44.1 | −6.5 | |
Total formal votes | 25,060 | 97.4 | |||
Informal votes | 682 | 2.6 | |||
Turnout | 25,742 | 71.5 | |||
Liberal gain from Labor | Swing | +6.5 | |||
Party | Candidate | Votes | % | ±% | |
---|---|---|---|---|---|
Labor | Billy Hughes | 17,658 | 71.3 | -0.0 | |
Liberal | John Sutton | 7,119 | 28.7 | +2.9 | |
Total formal votes | 24,777 | 94.6 | |||
Informal votes | 1,406 | 5.4 | |||
Turnout | 26,183 | 64.6 | |||
Labor hold | Swing | -1.5 | |||
Party | Candidate | Votes | % | ±% | |
---|---|---|---|---|---|
Liberal | Agar Wynne | 18,369 | 65.0 | +0.4 | |
Labor | Louis Holmes | 9,895 | 35.0 | −0.4 | |
Total formal votes | 28,264 | 98.0 | |||
Informal votes | 571 | 2.0 | |||
Turnout | 28,835 | 72.3 | |||
Liberal hold | Swing | +0.4 | |||
Party | Candidate | Votes | % | ±% | |
---|---|---|---|---|---|
Labor | Charles McGrath | 16,417 | 50.6 | +3.1 | |
Liberal | Hugh McKay | 16,049 | 49.4 | −3.1 | |
Total formal votes | 32,466 | 98.9 | |||
Informal votes | 352 | 1.1 | |||
Turnout | 32,818 | 83.8 | |||
Labor gain from Liberal | Swing | +3.1 | |||
Party | Candidate | Votes | % | ±% | |
---|---|---|---|---|---|
Labor | Frank Brennan | 19,268 | 64.9 | +2.7 | |
Liberal | Frederick O'Neill | 10,398 | 35.1 | -2.7 | |
Total formal votes | 29,666 | 98.2 | |||
Informal votes | 538 | 1.8 | |||
Turnout | 30,204 | 71.3 | |||
Labor hold | Swing | +2.7 | |||
Party | Candidate | Votes | % | ±% | |
---|---|---|---|---|---|
Labor | John Arthur | 14,488 | 50.5 | +2.1 | |
Liberal | Sir John Quick | 13,378 | 46.6 | −5.0 | |
Independent | Cyril James | 821 | 2.9 | +2.9 | |
Total formal votes | 28,687 | 97.8 | |||
Informal votes | 639 | 2.2 | |||
Turnout | 29,326 | 78.6 | |||
Labor gain from Liberal | Swing | +3.6 | |||
Party | Candidate | Votes | % | ±% | |
---|---|---|---|---|---|
Labor | Frank Anstey | 19,225 | 60.0 | +0.8 | |
Liberal | Frank Maldon Robb | 12,806 | 40.0 | −0.8 | |
Total formal votes | 32,031 | 98.7 | |||
Informal votes | 421 | 1.3 | |||
Turnout | 32,452 | 76.9 | |||
Labor hold | Swing | +0.8 | |||
Party | Candidate | Votes | % | ±% | |
---|---|---|---|---|---|
Liberal | Chester Manifold | 16,572 | 52.2 | +6.1 | |
Labor | James Scullin | 15,173 | 47.8 | −6.1 | |
Total formal votes | 31,745 | 99.1 | |||
Informal votes | 281 | 0.9 | |||
Turnout | 32,026 | 81.2 | |||
Liberal gain from Labor | Swing | +6.1 | |||
Party | Candidate | Votes | % | ±% | |
---|---|---|---|---|---|
Liberal | William Kendell | 14,804 | 51.4 | +4.7 | |
Labor | Alfred Ozanne | 13,770 | 47.9 | −5.4 | |
Independent | John Reed | 201 | 0.7 | +0.7 | |
Total formal votes | 28,775 | 97.5 | |||
Informal votes | 728 | 2.5 | |||
Turnout | 29,503 | 76.6 | |||
Liberal gain from Labor | Swing | +5.1 | |||
Party | Candidate | Votes | % | ±% | |
---|---|---|---|---|---|
Liberal | Albert Palmer | 15,618 | 57.6 | +14.0 | |
Labor | Chris Fitzgerald | 9,692 | 35.7 | +25.0 | |
Independent | Egbert England | 1,811 | 6.7 | +6.7 | |
Total formal votes | 27,121 | 97.4 | |||
Informal votes | 734 | 2.6 | |||
Turnout | 27,885 | 74.0 | |||
Liberal hold | Swing | +10.6 | |||
Party | Candidate | Votes | % | ±% | |
---|---|---|---|---|---|
Labor | Joseph Hannan | 16,643 | 53.3 | +2.8 | |
Liberal | George Fairbairn | 14,610 | 46.7 | -2.8 | |
Total formal votes | 31,253 | 97.7 | |||
Informal votes | 720 | 2.3 | |||
Turnout | 31,973 | 73.0 | |||
Labor hold | Swing | +2.8 | |||
Party | Candidate | Votes | % | ±% | |
---|---|---|---|---|---|
Liberal | William Irvine | 15,640 | 57.8 | +11.5 | |
Labor | David Russell | 11,418 | 42.2 | +8.4 | |
Total formal votes | 27,058 | 97.4 | |||
Informal votes | 714 | 2.6 | |||
Turnout | 27,772 | 73.1 | |||
Liberal hold | Swing | +1.5 | |||
Party | Candidate | Votes | % | ±% | |
---|---|---|---|---|---|
Liberal | James Bennett | 15,473 | 55.0 | +12.7 | |
Independent | George Wise | 12,671 | 45.0 | -12.7 | |
Total formal votes | 28,144 | 98.4 | |||
Informal votes | 471 | 1.6 | |||
Turnout | 28,615 | 75.5 | |||
Liberal gain from Independent | Swing | +12.7 | |||
Party | Candidate | Votes | % | ±% | |
---|---|---|---|---|---|
Liberal | Hans Irvine | 15,414 | 53.9 | +4.1 | |
Labor | Archibald Stewart | 13,191 | 46.1 | -4.1 | |
Total formal votes | 28,605 | 98.0 | |||
Informal votes | 580 | 2.0 | |||
Turnout | 29,185 | 79.5 | |||
Liberal gain from Labor | Swing | +4.1 | |||
Party | Candidate | Votes | % | ±% | |
---|---|---|---|---|---|
Liberal | James Boyd | 19,138 | 66.3 | +4.6 | |
Labor | William Miles | 9,284 | 32.2 | +7.9 | |
Independent Liberal | Joseph Hewison | 446 | 1.5 | +1.5 | |
Total formal votes | 28,868 | 97.4 | |||
Informal votes | 769 | 2.6 | |||
Turnout | 29,637 | 71.5 | |||
Liberal hold | Swing | -1.6 | |||
Party | Candidate | Votes | % | ±% | |
---|---|---|---|---|---|
Liberal | Cornelius Ahern | 14,759 | 51.8 | +6.5 | |
Labor | Parker Moloney | 13,653 | 47.9 | +0.2 | |
Independent | Joseph Brown | 67 | 0.2 | +0.2 | |
Total formal votes | 28,479 | 97.9 | |||
Informal votes | 609 | 2.1 | |||
Turnout | 29,088 | 80.1 | |||
Liberal gain from Labor | Swing | +3.2 | |||
Party | Candidate | Votes | % | ±% | |
---|---|---|---|---|---|
Liberal | Sir Robert Best | 18,777 | 61.9 | +4.1 | |
Independent | Vida Goldstein | 11,540 | 38.1 | +38.1 | |
Total formal votes | 30,317 | 98.3 | |||
Informal votes | 509 | 1.7 | |||
Turnout | 30,826 | 74.7 | |||
Liberal hold | Swing | +4.1 | |||
Party | Candidate | Votes | % | ±% | |
---|---|---|---|---|---|
Labor | James Fenton | 18,906 | 60.8 | +6.4 | |
Liberal | James Hume Cook | 12,210 | 39.2 | -6.4 | |
Total formal votes | 31,116 | 98.2 | |||
Informal votes | 583 | 1.8 | |||
Turnout | 31,699 | 77.7 | |||
Labor hold | Swing | +6.4 | |||
Party | Candidate | Votes | % | ±% | |
---|---|---|---|---|---|
Labor | William Maloney | 18,692 | 71.9 | +4.3 | |
Independent Labor | Ellen Mulcahy | 7,320 | 21.9 | +21.9 | |
Total formal votes | 26,012 | 95.2 | |||
Informal votes | 1,313 | 4.8 | |||
Turnout | 27,325 | 64.4 | |||
Labor hold | Swing | +4.3 | |||
Party | Candidate | Votes | % | ±% | |
---|---|---|---|---|---|
Labor | James Mathews | 24,203 | 79.2 | +10.6 | |
Liberal | Charles Merrett | 6,357 | 20.8 | -10.6 | |
Total formal votes | 30,560 | 97.9 | |||
Informal votes | 659 | 2.1 | |||
Turnout | 31,219 | 75.0 | |||
Labor hold | Swing | +10.6 | |||
Party | Candidate | Votes | % | ±% | |
---|---|---|---|---|---|
Liberal | Arthur Rodgers | 16,286 | 54.2 | +7.8 | |
Labor | John McDougall | 13,773 | 45.8 | -7.8 | |
Total formal votes | 30,059 | 98.5 | |||
Informal votes | 467 | 1.5 | |||
Turnout | 30,526 | 83.6 | |||
Liberal gain from Labor | Swing | +7.8 | |||
Party | Candidate | Votes | % | ±% | |
---|---|---|---|---|---|
Liberal | Sydney Sampson | 18,030 | 71.0 | +7.6 | |
Labor | Thomas Carey | 7,362 | 29.0 | -6.6 | |
Total formal votes | 25,392 | 97.9 | |||
Informal votes | 548 | 2.1 | |||
Turnout | 25,940 | 73.7 | |||
Liberal hold | Swing | +7.1 | |||
Party | Candidate | Votes | % | ±% | |
---|---|---|---|---|---|
Labor | Frank Tudor | 22,168 | 75.0 | -0.2 | |
Liberal | Edwin Purbrick | 7,398 | 25.0 | +0.2 | |
Total formal votes | 22,168 | 98.4 | |||
Informal votes | 471 | 1.6 | |||
Turnout | 30,037 | 71.5 | |||
Labor hold | Swing | -0.2 | |||
Party | Candidate | Votes | % | ±% | |
---|---|---|---|---|---|
Labor | William Finlayson | 18,559 | 56.9 | +6.1 | |
Liberal | Osborne Fenwick | 14,050 | 43.1 | −6.1 | |
Total formal votes | 32,609 | 97.1 | |||
Informal votes | 977 | 2.9 | |||
Turnout | 33,586 | 80.8 | |||
Labor hold | Swing | +6.1 | |||
Party | Candidate | Votes | % | ±% | |
---|---|---|---|---|---|
Labor | William Higgs | 15,583 | 64.1 | +6.4 | |
Liberal | Francis Dyer | 8,720 | 35.9 | −6.4 | |
Total formal votes | 24,303 | 97.5 | |||
Informal votes | 618 | 2.5 | |||
Turnout | 24,921 | 74.5 | |||
Labor hold | Swing | +6.4 | |||
Party | Candidate | Votes | % | ±% | |
---|---|---|---|---|---|
Liberal | Littleton Groom | 15,648 | 60.0 | -8.8 | |
Labor | Barnett Allen | 10,451 | 40.0 | +8.8 | |
Total formal votes | 26,099 | 97.2 | |||
Informal votes | 741 | 2.8 | |||
Turnout | 26,840 | 74.6 | |||
Liberal hold | Swing | -8.8 | |||
Party | Candidate | Votes | % | ±% | |
---|---|---|---|---|---|
Labor | Fred Bamford | 16,709 | 58.0 | +0.4 | |
Liberal | John Mann | 12,081 | 42.0 | -0.4 | |
Total formal votes | 28,790 | 96.1 | |||
Informal votes | 1,172 | 3.9 | |||
Turnout | 29,926 | 76.4 | |||
Labor hold | Swing | +0.4 | |||
Party | Candidate | Votes | % | ±% | |
---|---|---|---|---|---|
Labor | Charles McDonald | 17,745 | 74.4 | +6.1 | |
Liberal | Owen Edwards | 6,112 | 25.6 | -6.1 | |
Total formal votes | 23,857 | 95.9 | |||
Informal votes | 1,013 | 4.1 | |||
Turnout | 24,870 | 70.7 | |||
Labor hold | Swing | +6.1 | |||
Party | Candidate | Votes | % | ±% | |
---|---|---|---|---|---|
Liberal | Jacob Stumm | 15,729 | 54.7 | -0.1 | |
Labor | Arthur Lilley | 13,010 | 45.3 | +0.1 | |
Total formal votes | 28,739 | 97.8 | |||
Informal votes | 638 | 2.2 | |||
Turnout | 29,377 | 79.3 | |||
Liberal hold | Swing | -0.1 | |||
Party | Candidate | Votes | % | ±% | |
---|---|---|---|---|---|
Labor | Jim Page | 13,969 | 65.0 | -4.8 | |
Liberal | Herbert Yeates | 7,516 | 35.0 | +4.8 | |
Total formal votes | 21,485 | 96.6 | |||
Informal votes | 752 | 3.4 | |||
Turnout | 22,237 | 68.6 | |||
Labor hold | Swing | -4.8 | |||
Party | Candidate | Votes | % | ±% | |
---|---|---|---|---|---|
Liberal | Hugh Sinclair | 16,967 | 60.7 | -3.4 | |
Labor | John Sherlock | 10,975 | 39.3 | +3.4 | |
Total formal votes | 27,942 | 97.5 | |||
Informal votes | 709 | 2.5 | |||
Turnout | 28,651 | 80.0 | |||
Liberal hold | Swing | -3.4 | |||
Party | Candidate | Votes | % | ±% | |
---|---|---|---|---|---|
Labor | James Sharpe | 16,744 | 54.4 | +54.4 | |
Liberal | David Hunter | 14,027 | 45.6 | -12.4 | |
Total formal votes | 30,771 | 98.1 | |||
Informal votes | 601 | 1.9 | |||
Turnout | 31,372 | 82.0 | |||
Labor gain from Liberal | Swing | +12.4 | |||
Party | Candidate | Votes | % | ±% | |
---|---|---|---|---|---|
Labor | Andrew Fisher | 15,702 | 55.6 | -3.3 | |
Liberal | Arnold Wienholt | 12,543 | 44.4 | +3.3 | |
Total formal votes | 28,245 | 98.4 | |||
Informal votes | 464 | 1.6 | |||
Turnout | 28,709 | 84.0 | |||
Labor hold | Swing | -3.3 | |||
Party | Candidate | Votes | % | ±% | |
---|---|---|---|---|---|
Labor | Ernest Roberts | 15,985 | 66.1 | +2.8 | |
Liberal | James Craig | 7,104 | 29.4 | −7.3 | |
Independent | Edward Craigie | 1,077 | 4.6 | +4.6 | |
Total formal votes | 24,166 | 93.7 | |||
Informal votes | 1,626 | 6.3 | |||
Turnout | 25,792 | 75.9 | |||
Labor hold | Swing | +5.1 | |||
Party | Candidate | Votes | % | ±% | |
---|---|---|---|---|---|
Liberal | Paddy Glynn | unopposed | |||
Liberal hold | Swing | ||||
Party | Candidate | Votes | % | ±% | |
---|---|---|---|---|---|
Liberal | John Livingston | 15,590 | 59.0 | −0.5 | |
Labor | William Sampson | 10,849 | 41.0 | +0.5 | |
Total formal votes | 26,439 | 95.0 | |||
Informal votes | 1,392 | 5.0 | |||
Turnout | 27,831 | 79.7 | |||
Liberal hold | Swing | −0.5 | |||
Party | Candidate | Votes | % | ±% | |
---|---|---|---|---|---|
Labor | George Dankel | 16,976 | 53.0 | −13.8 | |
Liberal | David Gordon | 15,035 | 47.0 | +13.8 | |
Total formal votes | 32,011 | 96.5 | |||
Informal votes | 1,158 | 3.5 | |||
Turnout | 33,169 | 80.5 | |||
Labor gain from Liberal | Swing | −10.8 | |||
Party | Candidate | Votes | % | ±% | |
---|---|---|---|---|---|
Labor | Alexander Poynton | 12,622 | 52.0 | -48.0 | |
Liberal | Arthur McDonald | 11,642 | 48.0 | +48.0 | |
Total formal votes | 24,264 | 95.6 | |||
Informal votes | 1,108 | 4.4 | |||
Turnout | 25,372 | 78.9 | |||
Labor hold | Swing | -48.0 | |||
Party | Candidate | Votes | % | ±% | |
---|---|---|---|---|---|
Labor | William Archibald | unopposed | |||
Labor hold | Swing | ||||
Party | Candidate | Votes | % | ±% | |
---|---|---|---|---|---|
Liberal | Richard Foster | 14,193 | 53.7 | +3.8 | |
Labor | William Harvey | 12,213 | 46.3 | -2.1 | |
Total formal votes | 26,406 | 94.8 | |||
Informal votes | 1,450 | 5.2 | |||
Turnout | 27,856 | 84.2 | |||
Liberal hold | Swing | +2.9 | |||
Party | Candidate | Votes | % | ±% | |
---|---|---|---|---|---|
Liberal | Henry Gregory | 12,463 | 52.6 | +2.2 | |
Labor | Hugh Mahon | 11,222 | 47.4 | −1.5 | |
Total formal votes | 23,685 | 96.1 | |||
Informal votes | 958 | 3.9 | |||
Turnout | 24,643 | 68.4 | |||
Liberal hold | Swing | +1.8 | |||
Party | Candidate | Votes | % | ±% | |
---|---|---|---|---|---|
Labor | Reginald Burchell | 15,428 | 55.8 | +11.4 | |
Liberal | William Hedges | 12,225 | 44.2 | -11.4 | |
Total formal votes | 27,653 | 96.6 | |||
Informal votes | 975 | 3.4 | |||
Turnout | 28,628 | 77.8 | |||
Labor gain from Liberal | Swing | +11.4 | |||
Party | Candidate | Votes | % | ±% | |
---|---|---|---|---|---|
Labor | Charlie Frazer | unopposed | |||
Labor hold | Swing | ||||
Party | Candidate | Votes | % | ±% | |
---|---|---|---|---|---|
Liberal | James Fowler | 14,846 | 53.3 | -7.9 | |
Labor | Alick McCallum | 13,001 | 46.7 | +7.9 | |
Total formal votes | 27,847 | 97.1 | |||
Informal votes | 1,116 | 3.9 | |||
Turnout | 28,963 | 71.6 | |||
Liberal hold | Swing | -7.9 | |||
Party | Candidate | Votes | % | ±% | |
---|---|---|---|---|---|
Liberal | Sir John Forrest | 15,055 | 54.9 | -1.4 | |
Labor | Peter O'Loghlen | 12,379 | 45.1 | +1.4 | |
Total formal votes | 27,434 | 98.6 | |||
Informal votes | 396 | 1.4 | |||
Turnout | 27,830 | 76.5 | |||
Liberal hold | Swing | -1.4 | |||
Party | Candidate | Votes | % | ±% | |
---|---|---|---|---|---|
Labor | Jens Jensen | 7,945 | 52.4 | −4.4 | |
Liberal | Stephen Margetts | 7,212 | 47.6 | +47.6 | |
Total formal votes | 15,166 | 97.1 | |||
Informal votes | 457 | 2.9 | |||
Turnout | 15,623 | 73.4 | |||
Labor hold | Swing | −4.4 | |||
Party | Candidate | Votes | % | ±% | |
---|---|---|---|---|---|
Labor | King O'Malley | 8,312 | 52.1 | -11.2 | |
Liberal | Alexander Marshall | 7,652 | 47.9 | +11.2 | |
Total formal votes | 15,964 | 97.6 | |||
Informal votes | 396 | 2.4 | |||
Turnout | 16,360 | 76.7 | |||
Labor hold | Swing | -11.2 | |||
Party | Candidate | Votes | % | ±% | |
---|---|---|---|---|---|
Labor | William Laird Smith | 8,943 | 52.5 | -5.6 | |
Liberal | William Trenwith | 7,839 | 46.0 | +4.1 | |
Independent | Alicia O'Shea Petersen | 261 | 1.5 | +1.5 | |
Total formal votes | 17,043 | 96.3 | |||
Informal votes | 653 | 3.7 | |||
Turnout | 17,696 | 76.6 | |||
Labor hold | Swing | -4.8 | |||
Party | Candidate | Votes | % | ±% | |
---|---|---|---|---|---|
Liberal | William McWilliams | 9,202 | 55.8 | +2.4 | |
Labor | William Shoobridge | 7,299 | 44.2 | -2.4 | |
Total formal votes | 16,501 | 96.8 | |||
Informal votes | 551 | 3.2 | |||
Turnout | 17,052 | 76.4 | |||
Liberal hold | Swing | +2.4 | |||
Party | Candidate | Votes | % | ±% | |
---|---|---|---|---|---|
Liberal | Llewellyn Atkinson | 8,251 | 62.6 | +6.0 | |
Labor | Henry McFie | 4,922 | 37.4 | -6.0 | |
Total formal votes | 13,173 | 96.4 | |||
Informal votes | 494 | 3.6 | |||
Turnout | 13,667 | 73.0 | |||
Liberal hold | Swing | +6.0 | |||
The Protectionist Party, also known as the Protectionist Liberal Party or Liberal Protectionist Party, was an Australian political party, formally organised from 1887 until 1909, with policies centred on protectionism. The party advocated protective tariffs, arguing it would allow Australian industry to grow and provide employment. It had its greatest strength in Victoria and in the rural areas of New South Wales. Its most prominent leaders were Sir Edmund Barton and Alfred Deakin, who were the first and second prime ministers of Australia.
The Liberal Party was a parliamentary party in Australian federal politics between 1909 and 1917. The party was founded under Alfred Deakin's leadership as a merger of the Protectionist Party and Anti-Socialist Party, an event known as the Fusion.
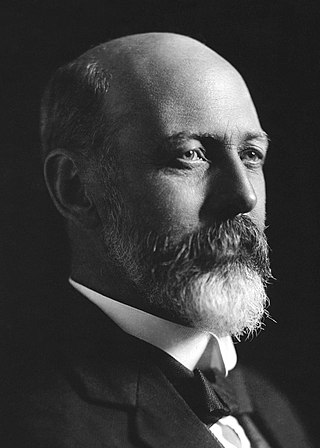
The 1913 Australian federal election was held in Australia on 31 May 1913. All 75 seats in the House of Representatives, and 18 of the 36 seats in the Senate were up for election. The incumbent Labor Party, led by Prime Minister Andrew Fisher, was defeated by the opposition Commonwealth Liberal Party under Joseph Cook, marking the second time an Australian Prime Minister was defeated at an election. The new government had a majority of just a single seat, and held a minority of seats in the Senate. It would last only 15 months, suffering defeat at the 1914 election.
The 1910 Australian federal election was held in Australia on 13 April 1910. All 75 seats in the House of Representatives, and 18 of the 36 seats in the Senate were up for election. The incumbent Liberal Party led by Prime Minister Alfred Deakin was defeated by the opposition Australian Labor Party (ALP) led by Andrew Fisher.
Queanbeyan was an electoral district of the Legislative Assembly in the Australian state of New South Wales from 1859 to 1913, in the Queanbeyan area. It replaced parts of the electoral district of United Counties of Murray and St Vincent and the electoral district of Southern Boroughs. It was merged with the electoral district of Monaro in 1913, when much of its former territory had been absorbed in the Australian Capital Territory.
State elections were held in South Australia on 27 March 1915. All 46 seats in the South Australian House of Assembly were up for election. The incumbent Liberal Union government led by Premier of South Australia Archibald Peake was defeated by the opposition United Labor Party led by Leader of the Opposition Crawford Vaughan. Each district elected multiple members, with voters casting multiple votes.
This is a list of electoral results for the Division of Werriwa in Australian federal elections from the division's creation in 1901 until the present.
This is a list of electoral results for the Division of Batman in Australian federal elections from the division's creation in 1906 until its abolition in 2019. The Division was then renamed Cooper
This is a list of electoral results for the Division of Henty in Australian federal elections from the division's creation in 1913 until its abolition in 1990.
This is a list of electoral results for the Division of Laanecoorie in Australian federal elections from the division's creation in 1901 until its abolition in 1913.
This is a list of electoral results for the Division of Mernda in Australian federal elections from the division's creation in 1901 until its abolition in 1913.
This is a list of electoral results for the Division of Lilley in Australian federal elections from the division's creation in 1913 until the present.
This is a list of electoral results for the Division of Kalgoorlie in Australian federal elections from the division's creation in 1901 until its abolition in 2010.
The 1914 Victorian state election was held in the Australian state of Victoria on Thursday, 26 November 1914 to elect 49 of the 65 members of the state's Legislative Assembly.
This is a list of electoral division results for the Australian 1910 federal election.
The Australian Labor Party held a leadership spill on 8 July 1913, following the party's defeat at the May 1913 federal election. Andrew Fisher was re-elected to the leadership, defeating William Higgs. It was the first occasion on which a sitting leader had faced a challenge.
Darling Harbour, an electoral district of the Legislative Assembly in the Australian state of New South Wales was created in 1904 and abolished in 1913.
The Australian states each elected three members of the Australian Senate at the 1910 federal election to serve a six-year term starting on 1 July 1910.
The Australian states each elected three members of the Australian Senate at the 1913 federal election to serve a six-year term starting on 1 July 1913.