Bowling Green metropolitan area, Kentucky

Last updated
Bowling Green Metro
Bowling Green Metropolitan Statistical Area
Fountain Square Park, Bowling Green, Kentucky.JPG
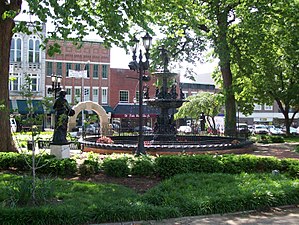
Fountain Square Park, 2008
Bowling Green metropolitan area, Kentucky
Bowling Green–Glasgow–Franklin, KY CSA
Country Flag of United States.svg United States
State Flag of Kentucky.svg Kentucky
Largest city Bowling Green
Other cities - Brownsville
 - Scottsville
 - Morgantown
 - Smiths Grove
 - Woodburn
Area
  Total
548 sq mi (1,420 km2)
Highest elevation
Pilot Knob [1] 935 ft (285 m)
Lowest elevation
Confluence of the Green
and Barren Rivers [2]
395 ft (120 m)
Population
  Total
165,732 (2,014) [3]
  Rank 246th in the U.S.
  Density220.06/sq mi (54.4/km2)
Shops along Fountain Square in Downtown Bowling Green. Shops along Fountain Square in Bowling Green, Kentucky 2008.JPG
Shops along Fountain Square in Downtown Bowling Green.

The Bowling Green Metropolitan Statistical Area, as defined by the United States Census Bureau, is an area consisting of four counties in Kentucky, anchored by the city of Bowling Green. As of 2014, the MSA had an estimated population of 165,732.

Contents

Counties

Communities

Incorporated places

Unincorporated places

Demographics

As of the census [4] of 2000, there were 104,166 people, 40,013 households, and 26,873 families residing within the MSA. The racial makeup of the MSA was 88.25% White, 7.68% African American, 0.26% Native American, 1.21% Asian, 0.07% Pacific Islander, 1.19% from other races, and 1.35% from two or more races. Hispanic or Latino of any race were 2.43% of the population.

The median income for a household in the MSA was $30,782, and the median income for a family was $38,493. Males had a median income of $29,417 versus $19,968 for females. The per capita income for the MSA was $16,664.

Combined Statistical Area

The Bowling Green–Glasgow–Franklin Combined Statistical Area (CSA) as defined by the United States Census Bureau in 2023 consists of the 7 counties in Bowling Green MSA, Franklin, KY μSA, and Glasgow, KY μSA. [5]

CBSA2023 Population (est.)County2023 Population (est.) [6] 2020 Population2010 Population2000 Population1950 Population1900 Population
Bowling Green, KY MSA 185,682 Warren County, Kentucky 142,229134,554113,79292,52242,75829,970
Allen County, Kentucky 21,78820,58819,95817,80013,78714,657
Butler County, Kentucky 12,37512,37112,69013,01011,30915,896
Edmonson County, Kentucky 12,44812,12612,16111,6449,37610,080
Glasgow, KY μSA 55,224 Barren County, Kentucky 45,00844,48542,17338,03328,46123,197
Metcalfe County, Kentucky 10,48210,28610,09910,0379,8519,988
Franklin, KY μSA 20,195 Simpson County, Kentucky 20,19519,59417,32716,40511,67811,624
Bowling Green–Glasgow–Franklin, KY CSA264,525

See also

References

  1. "Pilot Knob". Geographic Names Information System . United States Geological Survey, United States Department of the Interior. Retrieved on 2010-12-23
  2. Groundwater Resources of Warren County, Kentucky Retrieved on 2010-12-23
  3. "Archived copy". Archived from the original on 2015-05-04. Retrieved 2015-05-20.{{cite web}}: CS1 maint: archived copy as title (link)
  4. "U.S. Census website". United States Census Bureau . Retrieved 2008-01-31.
  5. "Revised Delineations of Metropolitan Statistical Areas, Micropolitan Statistical Areas, and Combined Statistical Areas, and Guidance on Uses of the Delineations of These Areas" (PDF). July 21, 2023. Retrieved March 12, 2024.
  6. "County Population Totals and Components of Change: 2020-2023". Census.gov. Retrieved 2024-03-14.