International roughness index

Last updated
Roughness progression for a road in Texas, US. Blue dots show the times of maintenance. IRI progression.png
Roughness progression for a road in Texas, US. Blue dots show the times of maintenance.

The international roughness index (IRI) is the roughness index most commonly obtained from measured longitudinal road profiles. It is calculated using a quarter-car vehicle math model, whose response is accumulated to yield a roughness index with units of slope (in/mi, m/km, etc.). [1] [2] Although a universal term, IRI is calculated per wheelpath, but can be expanded to a Mean Roughness Index (MRI) when both wheelpath profiles are collected. This performance measure has less stochasticity and subjectivity in comparison to other pavement performance indicators, such as PCI, but it is not completely devoid of randomness. [3] The sources of variability in IRI data include the difference among the readings of different runs of the test vehicle and the difference between the readings of the right and left wheel paths. [4] [5] Despite these facts, since its introduction in 1986, [6] [7] [8] the IRI has become the road roughness index most commonly used worldwide for evaluating and managing road systems.

Contents

The measurement of IRI is required for data provided to the United States Federal Highway Administration, [1] [9] and is covered in several standards from ASTM International: ASTM E1926 - 08, [10] ASTM E1364 - 95(2005), [11] and others. IRI is also used to evaluate new pavement construction, to determine penalties or bonus payments based on smoothness.

History

In the early 1980s the highway engineering community identified road roughness as the primary indicator of the utility of a highway network to road users. However, existing methods used to characterize roughness were not reproducible by different agencies using different measuring equipment and methods. Even within a given agency, the methods were not necessarily repeatable. Nor were they stable with time.

The United States National Cooperative Highway Research Program initiated a research project to help state agencies improve their use of roughness measuring equipment. [12] The work was continued by The World Bank [6] to determine how to compare or convert data obtained from different countries (mostly developing countries) involved in World Bank projects. Findings from the World Bank testing showed that most equipment in use could produce useful roughness measures on a single scale if methods were standardized. The roughness scale that was defined and tested was eventually named the International Roughness Index. [8] The IRI is used in managing pavement assets, as well as sometimes in evaluating new construction to determine bonus/penalty payments for contractors or for identifying specific locations where repairs or improvements (e.g., grinding or resurfacing) are recommended. The IRI is also a key determinant of vehicle operating costs which are used to determine the economic viability of road improvement projects. [13]

Definition

Golden car for IRI measurement as a spring Montaje Golden Car peke.JPG
Golden car for IRI measurement as a spring

The IRI was defined as a mathematical property of a two-dimensional road profile (a longitudinal slice of the road showing elevation as it varies with longitudinal distance along a travelled track on the road). As such, it can be calculated from profiles obtained with any valid measurement method, ranging from static rod and level surveying equipment to high-speed inertial profiling systems.

The quarter-car math model replicates roughness measurements that were in use by highway agencies in the 1970s and 1980s. The IRI is statistically equivalent to the methods that were in use, in the sense that correlation of IRI with a typical instrumented vehicle (called a "response type road roughness measuring system", RTRRMS) was as good as the correlation between the measures from any two RTRRMS's. As a profile-based statistic, the IRI had the advantage of being repeatable, reproducible, and stable with time. The IRI is based on the concept of a 'golden car' whose suspension properties are known. The IRI is calculated by simulating the response of this 'golden car' to the road profile. In the simulation, the simulated vehicle speed is 80 km/h (49.7 mi/h). The properties of the 'golden car' were selected in earlier research [12] to provide high correlation with the ride response of a wide range of automobiles that might be instrumented to measure a slope statistic (m/km). The damping in the IRI is higher than most vehicles, to prevent the math model from "tuning in" to specific wavelengths and producing a sensitivity not shared by the vehicle population at large.

The slope statistic of the IRI was chosen for backward compatibility with roughness measures in use. It is the average absolute (rectified) relative velocity of the suspension, divided by vehicle speed to convert from rate (e.g. m/s) to slope (m/km). The frequency content of the suspension movement rate is similar to the frequency content of chassis vertical acceleration and also tire/road vertical loading. Thus, IRI is highly correlated to the overall ride vibration level and to the overall pavement loading vibration level. Although it is not optimized to match any particular vehicle with full fidelity, it is so strongly correlated with ride quality and road loading that most research projects that have tested alternate statistics have not found significant improvements in correlation.

The frequency of the suspension response at the golden-car simulation speed also determines the final IRI ride value. The IRI sensitivity is focused on wavelengths between 0.82 and nearly 200-feet (0.25 to 61 meters). Although, if any wavelengths are equal to 7.9 or 50 feet (2.4 or 15.2 meters) the IRI values are weighted higher. [2] The quarter car model has higher correlations to light trucks and heavy trucks. [2]

IRI values are reported as inches per mile (in/mi), meters per kilometer (m/km), or millimeters per kilometer (mm/km) based upon the movement of the suspension over the distance driven. Highway agencies use IRI thresholds to characterize road condition; for example, in the United States, an IRI of less than 95 in/mi (1.50 m/km) is generally considered by the Federal Highway Administration to be in "good" condition, an IRI from 96 to 170 in/mi (1.51 to 2.68 m/km) is considered "acceptable", and an IRI exceeding 170 in/mile (2.68 m/km) is considered "poor". [14]

Measurement

The IRI is calculated from the road profile. This profile can be measured in several different ways. The most common measurements are with Class 1 instruments, capable of directly measuring the road profile, and Class 3 instruments, which use correlation equations. Using World Bank terminology, these correspond to Information Quality Level (IQL) 1 and IQL-3 devices, representing the relative accuracy of the measurements. [15] A common misconception is that the 80 km/h used in the simulation must also be used when physically measuring roughness with an instrumented vehicle. IQL-1 systems measure the elevation profile, independent of speed, and IQL-3 systems typically have correlation equations for different speeds to relate the actual measurements to IRI. If the captured profiles are the same, the IRI values will be the same.

IQL-1 systems can report varying intervals of roughness. IRI is reported at 10–20-meter or 528-foot (160-meter) intervals for project level collections. IQL-3 at 100m+ intervals.

Early measurements were done with a rod-and-level survey technique. The Transportation Research Laboratory developed a beam which had a vertical displacement transducer. From the late 1990s the use of the Dipstick Profiler, [16] with a reported accuracy of .01 mm ( 0.0004 inches), became quite common. [17] The ROMDAS Z-250 operates in a similar manner to the Dipstick. The ARRB TR walking profiler, ICC SurPRO, and SSI CS8800 Walking Profiler were major innovations to collect accurate profiles at walking speed. The ARRB, ICC, and SSI walking profiler units regularly collect data for FHWA Reference Profiler Rodeos (Data Collections 2009-2013& Report DTFH61-10-D-00026). These units can be used to certify inertial profilers as a reference device since they have a sampling interval less than 2.75-inches per AASHTO PP49. [18]

Dynamic measurements of the road profile are done with vehicle mounted instruments. The approach consisted of a sensor (initially ultrasonic but later laser) which measures the height of the vehicle relative to the road. An accelerometer is double integrated to give the height of the sensor relative to datum. The difference between the two is the relative elevation profile of the road. This elevation profile is then processed through the quarter-car algorithm to obtain the IRI. The most common approaches see the IRI measured in each wheelpath. The two wheelpath IRIs need to be combined to obtain the overall IRI "roughness profile". [19] for the lane. There are two ways this can be done. A 'half-car' (HRI) model simulates the vehicle travelling along both wheelpaths, while a 'quarter car' model simulates one wheel on each wheelpath and the average is the lane IRI. The quarter-car approach is considered more accurate in representing the motion felt by users and is most common.

A major issue with the profilers has to do with their contact areas compared to the footprint of a tyre. The latter is much larger than any of the static/slow speed Class 1 profilers or a typical laser profilometer. This can be addressed with a 4-inch or 6-inch line laser mounted in the wheelpaths to mimic the tire patch width. Or a high definition scanning laser can be used which create a 3D model of the pavement surface. An example of this is the Pavemetrics system which has been adopted by many different OEM suppliers of network-level profilometer equipment around the world. In addition to measuring roughness this system also measures other key pavement attributes such as cracking, rut depth and texture.

Less expensive alternatives to profilometers are RTRRMS which do not record the profile but rather are installed in vehicles and measure how the vehicle responds to the pavement profile. These need to be calibrated against IRI to obtain an estimate of the IRI. Since RTRRMS are generally affected by pavement texture and speed, it is common to have different calibration equations to correct the readings for these effects.

RTRRMS can be grouped into three broad categories and are generally IQL-3 except arguably most cell phone based systems which are IQL-4:

Relationship with PCI

The IRI generally has a reverse relationship with the PCI. A smooth road with low IRI usually has a high PCI. However, this is not always the case, and a road with low IRI could have a low PCI too and vise versa. [5] [20] Therefore, one of these performance indicators is not necessarily enough to describe the road condition comprehensively. It is reported that the prediction of future IRI values may be easier than PCI as it includes less uncertainty. [1]

See also

Related Research Articles

<span class="mw-page-title-main">Intelligent transportation system</span> Advanced application

An intelligent transportation system (ITS) is an advanced application which aims to provide innovative services relating to different modes of transport and traffic management and enable users to be better informed and make safer, more coordinated, and 'smarter' use of transport networks.

<span class="mw-page-title-main">Road surface</span> Road covered with durable surface material

A road surface, or pavement, is the durable surface material laid down on an area intended to sustain vehicular or foot traffic, such as a road or walkway. In the past, gravel road surfaces, macadam, hoggin, cobblestone and granite setts were extensively used, but these have mostly been replaced by asphalt or concrete laid on a compacted base course. Asphalt mixtures have been used in pavement construction since the beginning of the 20th century and are of two types: metalled (hard-surfaced) and unmetalled roads. Metalled roadways are made to sustain vehicular load and so are usually made on frequently used roads. Unmetalled roads, also known as gravel roads, are rough and can sustain less weight. Road surfaces are frequently marked to guide traffic.

<span class="mw-page-title-main">Dipstick</span> Measuring device

A dipstick is one of several measurement devices.

<span class="mw-page-title-main">Falling weight deflectometer</span>

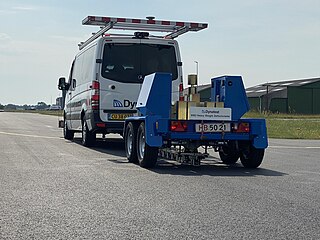
A falling weight deflectometer (FWD) is a testing device used by civil engineers to evaluate the physical properties of pavement in highways, local roads, airport pavements, harbor areas, railway tracks and elsewhere. The data acquired from FWDs is primarily used to estimate pavement structural capacity, to facilitate overlay design or determine if a pavement is being overloaded. Depending on its design, a FWD may be contained within a towable trailer or it may be built into a self-propelled vehicle such as a truck or van. Comprehensive road survey vehicles typically consist of a FWD mounted on a heavy truck together with a ground-penetrating radar and impact attenuator.

Weigh-in-motion or weighing-in-motion (WIM) devices are designed to capture and record the axle weights and gross vehicle weights as vehicles drive over a measurement site. Unlike static scales, WIM systems are capable of measuring vehicles traveling at a reduced or normal traffic speed and do not require the vehicle to come to a stop. This makes the weighing process more efficient, and, in the case of commercial vehicles, allows for trucks under the weight limit to bypass static scales or inspection.

<span class="mw-page-title-main">AASHO Road Test</span> AASHO experiment for studying highway pavements deterioration

The AASHO Road Test was a series of experiments carried out by the American Association of State Highway and Transportation Officials (AASHTO), to determine how traffic contributed to the deterioration of highway pavements.

The pavement condition index (PCI) is a numerical index between 0 and 100, which is used to indicate the general condition of a pavement section. The PCI is widely used in transportation civil engineering and asset management, and many municipalities use it to measure the performance of their road infrastructure and their levels of service. It is a statistical measure and requires manual survey of the pavement. This index was originally developed by the United States Army Corps of Engineers as an airfield pavement rating system, but later modified for roadway pavements and standardized by the ASTM. The surveying processes and calculation methods have been documented and standardized by ASTM for both roads and airport pavements:

<span class="mw-page-title-main">Types of road</span>

A road is a thoroughfare, route, or way on land between two places that has been surfaced or otherwise improved to allow travel by foot or some form of conveyance, including a motor vehicle, cart, bicycle, or horse. Roads have been adapted to a large range of structures and types in order to achieve a common goal of transportation under a large and wide range of conditions. The specific purpose, mode of transport, material and location of a road determine the characteristics it must have in order to maximize its usefulness. Following is one classification scheme.

<span class="mw-page-title-main">Road slipperiness</span>

Road slipperiness is a condition of low skid resistance due to insufficient road friction. It is a result of snow, ice, water, loose material and the texture of the road surface on the traction produced by the wheels of a vehicle.

Pavement management is the process of planning the maintenance and repair of a network of roadways or other paved facilities in order to optimize pavement conditions over the entire network.

Road surface textures are deviations from a planar and smooth surface, affecting the vehicle/tyre interaction. Pavement texture is divided into: microtexture with wavelengths from 0 mm to 0.5 millimetres (0.020 in), macrotexture with wavelengths from 0.5 millimetres (0.020 in) to 50 millimetres (2.0 in) and megatexture with wavelengths from 50 millimetres (2.0 in) to 500 millimetres (20 in).

<span class="mw-page-title-main">Traffic count</span> Determination of the number of vehicles

A traffic count is a count of vehicular or pedestrian traffic, which is conducted along a particular road, path, or intersection. A traffic count is commonly undertaken either automatically, or manually by observers who visually count and record traffic on a hand-held electronic device or tally sheet. Traffic counts can be used by local councils to identify which routes are used most, and to either improve that road or provide an alternative if there is an excessive amount of traffic. Also, some geography fieldwork involves a traffic count. Traffic counts provide the source data used to calculate the Annual Average Daily Traffic (AADT), which is the common indicator used to represent traffic volume. Traffic counts are useful for comparing two or more roads, and can also be used alongside other methods to find out where the central business district (CBD) of a settlement is located. Traffic counts that include speeds are used in speed limit enforcement efforts, highlighting peak speeding periods to optimise speed camera use and educational efforts.

Bleeding or flushing is shiny, black surface film of asphalt on the road surface caused by upward movement of asphalt in the pavement surface. Common causes of bleeding are too much asphalt in asphalt concrete, hot weather, low space air void content and quality of asphalt. Bleeding is a safety concern since it results in a very smooth surface, without the texture required to prevent hydroplaning. Road performance measures such as IRI cannot capture the existence of bleeding as it does not increase the surface roughness. But other performance measures such as PCI do include bleeding.

<span class="mw-page-title-main">Transportation Research Center</span>

The Transportation Research Center (TRC) is North America's largest multi-user automotive proving ground. It is operated by TRC Inc. The center occupies 4,500 acres in East Liberty, Ohio, just 40 miles northwest of Columbus, Ohio. These 4,500 acres are split between the main TRC property and a rural road/ATV course located approximately 2.5 miles from the main property.

<span class="mw-page-title-main">Pavement performance modeling</span>

Pavement performance modeling or pavement deterioration modeling is the study of pavement deterioration throughout its life-cycle. The health of pavement is assessed using different performance indicators. Some of the most well-known performance indicators are Pavement Condition Index (PCI), International Roughness Index (IRI) and Present Serviceability Index (PSI), but sometimes a single distress such as rutting or the extent of crack is used. Among the most frequently used methods for pavement performance modeling are mechanistic models, mechanistic-empirical models, survival curves and Markov models. Recently, machine learning algorithms have been used for this purpose as well. Most studies on pavement performance modeling are based on IRI.

<span class="mw-page-title-main">Deterioration modeling</span>

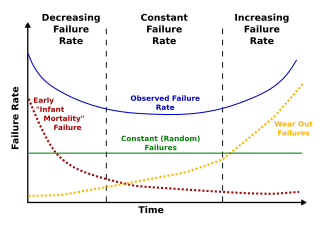
Deterioration modeling is the process of modeling and predicting the physical conditions of equipment, structures, infrastructure or any other physical assets. The condition of infrastructure is represented either using a deterministic index or the probability of failure. Examples of such performance measures are pavement condition index for roads or bridge condition index for bridges. For probabilistic measures, which are the focus of reliability theory, probability of failure or reliability index are used. Deterioration models are instrumental to infrastructure asset management and are the basis for maintenance and rehabilitation decision-making. The condition of all physical infrastructure degrade over time. A deterioration model can help decision-makers to understand how fast the condition drops or violates a certain threshold.

<span class="mw-page-title-main">Levels of service</span> Quality control assessment for numerous types of assets

Levels of service (LOS) is a term in asset management referring to the quality of a given service. Defining and measuring levels of service is a key activity in developing infrastructure asset management plans. Levels of service may be tied to physical performance of assets or be defined via customer expectation and satisfaction. The latter is more service-centric rather than asset-centric. For instance, when measuring the LOS of a road, it could be measured by a physical performance indicator such as Pavement Condition Index (PCI) or by a measure related to customer satisfaction such as the number of complaints per month about that certain road section. Or in the case of traffic level of service, it could be measured by the geometry of road or by travel time of the vehicles, which reflects the quality of traffic flow. So, levels of service can have multiple facets: customer satisfaction, environmental requirements and legal requirements.

The rolling straight-edge is an instrument used to measure the surface regularity of roads and similar structures such as airport runways. It consists of a straightedge of a fixed distance mounted on wheels with a sensor at the centrepoint measuring deviation in height. It is rolled along the road surface and set to specific trigger levels which can be logged automatically or by means of an audible alarm. The rolling straight-edge was developed by the British Road Research Laboratory to replace earlier manual methods of measurement using rulers. It has been used by several countries and remains in use in the United Kingdom, Germany and Taiwan.

<span class="mw-page-title-main">Granular base equivalency</span> Measure of road pavement thickness

Granular base equivalency or granular base equivalence (GBE) is a measure of total pavement thickness. Since pavement is composed of multiple layers with different physical properties, its total thickness is measured by GBE. GBE translates the thickness of different road layers to a number using a set of coefficients. So, to calculate the GBE, the depth of each layer should be multiplied by the granular equivalency factor for the material in that layer. In the next step the sum of the converted layer thicknesses is calculated. This sum is called granular base equivalency, which is a popular and important measure in pavement design and pavement performance modeling.

The present serviceability index (PSI) is a pavement performance measure. Introduced by the American Association of State Highway and Transportation Officials (AASHTO), the PSI is one of the most widely used pavement performance indicators after pavement condition index (PCI) and international roughness index (IRI). This performance indicator ranges between 0 and 5, 0 representing a failed pavement and 5 an excellent one. Since the PSI entails slope variance, it is correlated with performance indicators related to roughness such as IRI.

References

  1. 1 2 3 Piryonesi, S. Madeh; El-Diraby, Tamer E. (2021-02-01). "Using Machine Learning to Examine Impact of Type of Performance Indicator on Flexible Pavement Deterioration Modeling". Journal of Infrastructure Systems. 27 (2): 04021005. doi:10.1061/(ASCE)IS.1943-555X.0000602. ISSN   1076-0342. S2CID   233550030.
  2. 1 2 3 Sayers, M.W.; Karamihas, S.M. (1998). "Little Book of Profiling" (PDF). University of Michigan Transportation Research Institute. Archived from the original (PDF) on 2018-05-17. Retrieved 2010-03-07.
  3. Piryonesi, S. Madeh; El-Diraby, Tamer E. (2021-02-01). "Using Machine Learning to Examine Impact of Type of Performance Indicator on Flexible Pavement Deterioration Modeling". Journal of Infrastructure Systems. 27 (2): 04021005. doi:10.1061/(ASCE)IS.1943-555X.0000602. ISSN   1076-0342. S2CID   233550030.
  4. Piryonesi, S. M. (2019). The Application of Data Analytics to Asset Management: Deterioration and Climate Change Adaptation in Ontario Roads (PhD dissertation). University of Toronto.
  5. 1 2 Piryonesi, S. Madeh; El-Diraby, Tamer E. (2020-09-11). "Examining the Relationship Between Two Road Performance Indicators: Pavement Condition Index and International Roughness Index". Transportation Geotechnics. 26: 100441. doi:10.1016/j.trgeo.2020.100441. S2CID   225253229 via Elsevier Science Direct.
  6. 1 2 Sayers, M.W., Gillespie, T. D., and Paterson, W.D. Guidelines for the Conduct and Calibration of Road Roughness Measurements, World Bank Technical Paper No. 46, The World Bank, Washington DC, 1986.
  7. Sayers, M. (1984). Guidelines for the conduct and calibration of road roughness measurements. University of Michigan, Highway Safety Research Institute. OCLC   173314520.
  8. 1 2 Sayers, M. W. (Michael W.) (1986). International road roughness experiment : establishing methods for correlation and a calibration standard for measurements. World Bank Technical Paper No. 45. Washington, D.C.: World Bank. ISBN   0-8213-0589-1. OCLC   1006487409.
  9. "National Performance Management Measures; Assessing Pavement Condition for the National Highway Performance Program and Bridge Condition for the National Highway Performance Program". Federal Register. 2017-01-18. Retrieved 2021-02-25.
  10. "ASTM E1926 - 08(2015) Standard Practice for Computing International Roughness Index of Roads from Longitudinal Profile Measurements". www.astm.org. Retrieved 2019-12-19.
  11. "ASTM E1926 - 08(2015) Standard Practice for Computing International Roughness Index of Roads from Longitudinal Profile Measurements". www.astm.org. Retrieved 2019-12-19.
  12. 1 2 Gillespie, T.D.; Sayers, M.W.; Segel, L. (December 1980). "Calibration of Response-Type Road Roughness Measuring Systems". NCHRP Report. Washington, D.C.: Transportation Research Board (228).
  13. Greenwood, Ian; Bennett, Christopher R. (2004). Modelling Road User and Environmental Costs in HDM-4 (Report). La Défense, France: PIARC - World Road Association. ISBN   2-84060-103-6. HDM4-Volume7EN.
  14. Our Nations Highways 2011 (Report). Washington, D.C.: Office of Highway Policy Information, Federal Highway Administration. 2014.
  15. Data Collection Technologies for Road Management
  16. Face® Dipstick® website home page
  17. Comparison of Roughness Calibration Equipment - with a View to Increased Confidence in Network Level Data; G. Morrow, A. Francis, S.B. Costello, R.C.M. Dunn, 2006 Archived 2015-04-03 at the Wayback Machine
  18. "Evaluation of Surpro as a Reference Device For High-Speed Inertial Profilers" (PDF). fdot.gov. Florida Department of Transportation. February 1, 2008. Retrieved 10 May 2022.
  19. Sayers, M.W., Profiles of Roughness. Transportation Research Record 1260, Transportation Research Board, National Research Council, Washington, D.C. 1990
  20. Bryce, J.; Boadi, R.; Groeger, J. (2019). "Relating Pavement Condition Index and Present Serviceability Rating for Asphalt-Surfaced Pavements". Transportation Research Record: Journal of the Transportation Research Board. 2673 (3): 308–312. doi:10.1177/0361198119833671. S2CID   116809787.

Further reading