Misery index (economics)

Last updated
Misery Index
.mw-parser-output .legend{page-break-inside:avoid;break-inside:avoid-column}.mw-parser-output .legend-color{display:inline-block;min-width:1.25em;height:1.25em;line-height:1.25;margin:1px 0;text-align:center;border:1px solid black;background-color:transparent;color:black}.mw-parser-output .legend-text{}
Misery Index
Unemployment rate
Inflation rate CPI Misery Index.webp
Misery Index
  Misery Index
   Unemployment rate
  Inflation rate CPI

The misery index is an economic indicator, created by the American economist Arthur Okun. The index helps determine how the average citizen is doing economically and is calculated by adding the seasonally adjusted unemployment rate to the annual inflation rate. It is assumed that both a higher rate of unemployment and a worsening of inflation create economic and social costs for a country. [1]

Contents

Misery index by US presidential administration

Index = Unemployment rate + Inflation rate (lower number is better)
PresidentTime PeriodAverageLowHighStartEndChange
Harry Truman 194819527.883.45 Dec 195213.63 Jan 194813.633.45-10.18
Dwight D. Eisenhower 195319609.262.97 Jul 195310.98 Apr 19583.289.96+5.68
John F. Kennedy 196119637.146.40 Jul 19628.38 Jul 19618.316.82-1.49
Lyndon B. Johnson 196319686.775.70 Nov 19658.19 Jul 19687.028.12+1.10
Richard Nixon 1969197410.577.80 Jan 196917.01 Jul 19747.8017.01+9.21
Gerald Ford 1974197616.0012.66 Dec 197619.90 Jan 197516.3612.66-3.70
Jimmy Carter 1977198016.2612.60 Apr 197821.98 Jun 198012.7219.72+7.00
Ronald Reagan 1981198812.197.70 Dec 198619.33 Jan 198119.339.72-9.61
George H. W. Bush 1989199210.689.64 Sep 198914.47 Nov 199010.0710.30+0.23
Bill Clinton 199320007.805.74 Apr 199810.56 Jan 199310.567.29-3.27
George W. Bush 200120088.115.71 Oct 200611.47 Aug 20087.937.39-0.54
Barack Obama 200920168.835.06 Sep 2015
12.87 Sep 20117.836.77-1.06
Donald Trump 201720206.915.21 Sep 2019
15.03 Apr 20207.308.06+0.76
Joe Biden 2021202310.166.79 Feb 2024
11.29 Jun 20217.706.79-0.91

[2]

Variations

Harvard Economist Robert Barro created what he dubbed the "Barro Misery Index" (BMI), in 1999. [3] The BMI takes the sum of the inflation and unemployment rates, and adds to that the interest rate, plus (minus) the shortfall (surplus) between the actual and trend rate of GDP growth.

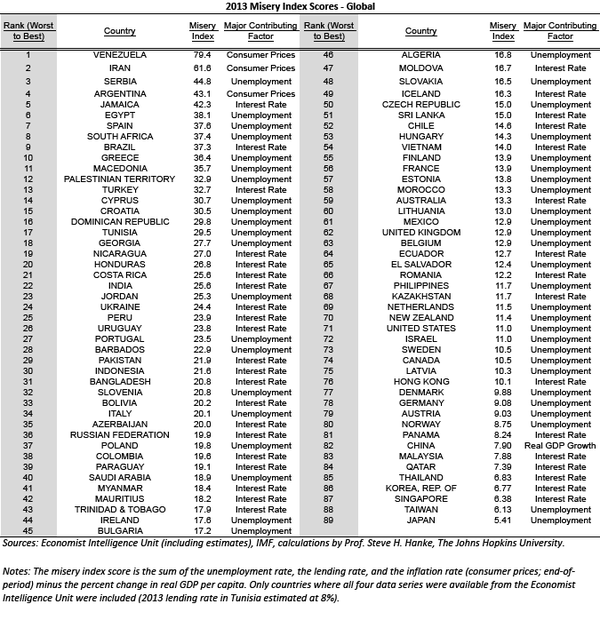
In the late 2000s, Johns Hopkins economist Steve Hanke built upon Barro's misery index and began applying it to countries beyond the United States. His modified misery index is the sum of the interest, inflation, and unemployment rates, minus the year-over-year percent change in per-capita GDP growth. [4]

In 2013 Hanke constructed a World Table of Misery Index Scores by exclusively relying on data reported by the Economist Intelligence Unit. [5] This table includes a list of 89 countries, ranked from worst to best, with data as of December 31, 2013 (see table below).

World Table of Misery Index Scores as of December 31, 2013. World Table of Misery Index Scores.png
World Table of Misery Index Scores as of December 31, 2013.

Political economists Jonathan Nitzan and Shimshon Bichler found a negative correlation between a similar "stagflation index" and corporate amalgamation (i.e. mergers and acquisitions) in the United States since the 1930s. In their theory, stagflation is a form of political economic sabotage employed by corporations to achieve differential accumulation, in this case as an alternative to amalgamation when merger and acquisition opportunities have run out. [6]

Hanke's Misery Index

Ranked from worst to best
Country/Territory2020 [7] 2022 [8]
Flag of Venezuela.svg Venezuela 3827.6330.8
Flag of Zimbabwe.svg Zimbabwe 547.0414.7
Flag of Syria (2025-).svg Syria N/A225.4
Flag of Yemen.svg Yemen N/A116.2
Flag of Ghana.svg Ghana N/A86.8
Flag of Barbados.svg Barbados N/A31.5
Flag of Sudan.svg Sudan 193.9176.1
Flag of Lebanon.svg Lebanon 177.1190.337
Flag of Suriname.svg Suriname 145.380.5
Flag of Libya.svg Libya 105.760.3
Flag of Argentina.svg Argentina 95.0156.192
Flag of Iran.svg Iran 92.173.3
Flag of Angola.svg Angola 60.693.518
Flag of Madagascar.svg Madagascar 60.463.6
Flag of Brazil.svg Brazil 53.461.785
Flag of South Africa.svg South Africa 49.383.492
Flag of Haiti.svg Haiti 48.995.4
Flag of Kyrgyzstan.svg Kyrgyzstan 47.140.977
Flag of Nigeria.svg Nigeria 45.647.2
Flag of Eswatini.svg Eswatini 42.763.1
Flag of Lesotho.svg Lesotho 42.451.6
Flag of Peru.svg Peru 42.234.835
Flag of Zambia.svg Zambia 41.632
Flag of South Sudan.svg South Sudan 41.2176.1
Flag of Turkey.svg Turkey 41.2101.601
Flag of Namibia.svg Namibia 40.755.7
Flag of Gabon.svg Gabon 40.562.4
Flag of the Republic of the Congo.svg Congo 40.361.5
Flag of Botswana.svg Botswana 39.764.023
Flag of Iraq.svg Iraq 39.542.3
Flag of Sao Tome and Principe.svg São Tomé and Príncipe 39.362.3
Flag of Liberia.svg Liberia 39.126.32
Flag of Jamaica.svg Jamaica 38.641
Flag of Malawi.svg Malawi 37.963.5
Flag of Jordan.svg Jordan 37.956.3
Flag of Guinea.svg Guinea 36.838.9
Flag of Uruguay.svg Uruguay 36.730.296
Flag of Armenia.svg Armenia 36.733.7
Flag of Montenegro.svg Montenegro 36.252.653
Flag of Tunisia.svg Tunisia 36.146.905
Flag of Ethiopia.svg Ethiopia 36.161
Flag of Honduras (2022-).svg Honduras 35.842.2
Flag of India.svg India 35.822.58
Flag of Panama.svg Panama 35.719.21
Flag of Colombia.svg Colombia 35.444.531
Flag of Mongolia.svg Mongolia 35.442.98
Flag of Georgia.svg Georgia 34.852.5
Flag of Uzbekistan.svg Uzbekistan 34.144.4
Flag of the Dominican Republic.svg Dominican Republic 34.027.2
Flag of Ukraine.svg Ukraine 33.5110.003
Flag of Saudi Arabia.svg Saudi Arabia 33.124.603
Flag of Algeria.svg Algeria 32.750.2
Flag of Pakistan.svg Pakistan 32.552.6
Flag of Costa Rica.svg Costa Rica 32.437.077
Flag of Paraguay.svg Paraguay 32.043.7
Flag of Trinidad and Tobago.svg Trinidad and Tobago 31.521.98
Flag of Greece.svg Greece 31.331.128
Flag of Mauritius.svg Mauritius 30.429.884
Flag of The Gambia.svg Gambia 30.241.2
Flag of Cape Verde.svg Cape Verde 29.926.3
Flag of Bolivia.svg Bolivia 29.918.9
Flag of Kazakhstan.svg Kazakhstan 29.543.854
Flag of Guatemala.svg Guatemala 29.326.3
Flag of Burundi.svg Burundi 28.741
Flag of the Philippines.svg Philippines 28.319.552
Flag of Azerbaijan.svg Azerbaijan 28.238.131
Flag of Spain.svg Spain 28.228.16
Flag of North Macedonia.svg North Macedonia 28.150.4
Flag of Belize.svg Belize 27.8
Flag of the Democratic Republic of the Congo.svg Democratic Republic of the Congo 27.438.64
Flag of Equatorial Guinea.svg Equatorial Guinea 27.131.8
Flag of the Comoros.svg Comoros 26.237.1
Flag of Myanmar.svg Myanmar 26.250.4
Flag of El Salvador.svg El Salvador 26.028.4
Flag of Mozambique.svg Mozambique 25.836.9
Flag of Nicaragua.svg Nicaragua 25.718.725
Flag of Mexico.svg Mexico 25.620.3
Flag of Sri Lanka.svg Sri Lanka 24.399.634
Flag of Chile.svg Chile 23.936.846
Flag of Albania.svg Albania 23.825.6
Flag of Bosnia and Herzegovina.svg Bosnia and Herzegovina 23.875.9
Flag of Iceland.svg Iceland 23.521.525
Flag of Ecuador.svg Ecuador 23.317.5
Flag of Fiji.svg Fiji 23.217.5
Flag of Mauritania.svg Mauritania 23.245.4
Flag of Morocco.svg Morocco 22.836.565
Flag of New Zealand.svg New Zealand 22.222.441
Flag of Belarus.svg Belarus 22.039.2
Flag of Italy.svg Italy 22.026.451
Flag of Oman.svg Oman 21.611.3
Flag of the United Kingdom.svg United Kingdom 22.517.659
Flag of Egypt.svg Egypt 20.941.832
Flag of Indonesia.svg Indonesia 20.921.727
Flag of Kenya.svg Kenya 20.829.264
Flag of Vanuatu.svg Vanuatu 20.418.3
Flag of Kuwait.svg Kuwait 20.38.6
Flag of Papua New Guinea.svg Papua New Guinea 20.118
Flag of Russia.svg Russia 19.933.202
Flag of Nepal.svg   Nepal 19.937.18
Flag of Romania.svg Romania 18.532.271
Flag of Serbia.svg Serbia 18.441.138
Flag of France.svg France 18.419.935
Flag of Croatia.svg Croatia 18.325.5
Flag of Hong Kong.svg Hong Kong 18.218.191
Flag of Canada (Pantone).svg Canada 18.120.676
Flag of Malta.svg Malta 18.011.062
Flag of Portugal (official).svg Portugal 18.018.615
Flag of Uganda.svg Uganda 17.635.235
Flag of Mali.svg Mali 17.532.7
Flag of Estonia.svg Estonia 17.134.692
Flag of Latvia.svg Latvia 17.135.49
Flag of Slovenia.svg Slovenia 17.019.919
Flag of the United States.svg United States 16.716.882
Flag of Moldova.svg Moldova 16.452.9
Flag of Cyprus.svg Cyprus 16.320.6
Flag of Slovakia.svg Slovakia 16.232.051
Flag of Bulgaria.svg Bulgaria 16.024.6
Flag of Laos.svg Laos 16.052.16
Flag of Australia (converted).svg Australia 15.920.059
Flag of Burkina Faso.svg Burkina Faso 15.926.3
Flag of Cuba.svg Cuba 15.8102
Flag of the Czech Republic.svg Czech Republic 15.722.2
Flag of Cameroon.svg Cameroon 15.519
Flag of Belgium (civil).svg Belgium 15.420.608
Flag of Hungary.svg Hungary 14.840.242
Flag of Singapore.svg Singapore 14.615.986
Flag of Austria.svg Austria 14.517.063
Flag of Lithuania.svg Lithuania 14.532.87
Flag of Malaysia.svg Malaysia 14.59.075
Flag of Guinea-Bissau.svg Guinea-Bissau 14.417.2
Flag of Israel.svg Israel 14.412.384
Flag of Luxembourg.svg Luxembourg 14.318.316
Flag of Bangladesh.svg Bangladesh 14.020.107
Flag of Poland.svg Poland 13.933.761
Flag of Vietnam.svg Vietnam 13.414.839
Flag of Bahrain.svg Bahrain 13.222.2
Flag of the Central African Republic.svg Central African Republic 13.235.4
Flag of the Netherlands.svg Netherlands 13.014.973
Flag of Ireland.svg Ireland 12.98.602
Flag of Finland.svg Finland 12.821.629
Flag of Norway.svg Norway 12.813.542
Flag of Sweden.svg Sweden 12.729.198
Flag of Thailand.svg Thailand 12.610.219
Flag of Denmark.svg Denmark 11.815.785
Flag of the United Arab Emirates.svg United Arab Emirates 11.813
Flag of Tanzania.svg Tanzania 11.625.132
Flag of Chad.svg Chad 11.623.34
Flag of Tonga.svg Tonga 11.488.1
Flag of Germany.svg Germany 10.916.381
Flag of Cote d'Ivoire.svg Côte d'Ivoire 10.811.622
Flag of Rwanda.svg Rwanda 10.669.192
Flag of Niger.svg Niger 10.59.77
Flag of Togo (3-2).svg Togo 9.510.95
Flag of Switzerland (Pantone).svg  Switzerland 8.68.518
Flag of South Korea.svg South Korea 8.312.515
Flag of the People's Republic of China.svg China 8.313.1
Flag of Japan.svg Japan 8.19.071
Flag of Qatar.svg Qatar 5.313.591
Flag of the Republic of China.svg Taiwan 3.89.399
Flag of Guyana.svg Guyana −3.3

Criticism

A 2001 paper looking at large-scale surveys in Europe and the United States concluded that unemployment more heavily influences unhappiness than inflation. This implies that the basic misery index underweights the unhappiness attributable to the unemployment rate: "the estimates suggest that people would trade off a 1-percentage-point increase in the employment rate for a 1.7-percentage-point increase in the inflation rate." [9]

Misery and crime

Some economists, such as Hooi Hooi Lean, posit that the components of the Misery Index drive the crime rate to a degree. Using data from 1960 to 2005, they have found that the Misery Index and the crime rate correlate strongly and that the Misery Index seems to lead the crime rate by a year or so. [10] In fact, the correlation is so strong that the two can be said to be cointegrated, and stronger than correlation with either the unemployment rate or inflation rate alone.[ citation needed ]

Data sources

The data for the misery index is obtained from unemployment data published by the U.S. Department of Labor (U3) and the Inflation Rate (CPI-U) from the Bureau of Labor Statistics. The exact methods used for measuring unemployment and inflation have changed over time, although past data is usually normalized so that past and future metrics are comparable.

See also

References

  1. "The US Misery Index". Inflationdata.com.
  2. "US Misery Index by President".
  3. Robert J. Barro (22 February 1999). "Reagan Vs. Clinton: Who's The Economic Champ?". Bloomberg. Archived from the original on October 22, 2012.
  4. Steve H. Hanke (March 2011). "Misery in MENA". Cato Institute: appeared in Globe Asia.
  5. Steve H. Hanke (May 2014). "Measuring Misery around the World". Cato Institute: appeared in Globe Asia.
  6. Nitzan, Jonathan; Bichler, Shimshon (2009). Capital as Power: A Study of Order and Creorder. RIPE Series in Global Political Economy. Routledge. pp. 384–386.
  7. Hanke, Steve H. (14 April 2021). "Hanke's 2020 Misery Index: Who's Miserable and Who's Happy?". National Review. Retrieved 23 March 2022.
  8. HANKE, STEVE H. (May 18, 2023). "Hanke's 2022 Misery Index". National Review .
  9. Di Tella, Rafael; MacCulloch, Robert J.; Oswald, Andrew (2001). "Preferences over Inflation and Unemployment: Evidence from Surveys of Happiness" (PDF). American Economic Review . 91 (1): 335–341, 340. doi:10.1257/aer.91.1.335. S2CID   14823969.
  10. Tang, Chor Foon; Lean, Hooi Hooi (2009). "New evidence from the misery index in the crime function" . Economics Letters. 102 (2): 112–115. doi:10.1016/j.econlet.2008.11.026.