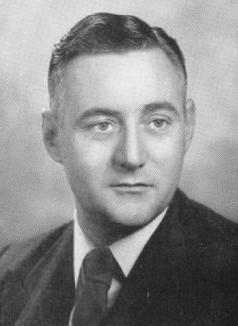
This is a list of electoral division results for the Australian 1914 federal election.
Party | Candidate | Votes | % | ±% | |
---|---|---|---|---|---|
Labor | Josiah Thomas | 16,063 | 79.7 | +2.9 | |
Liberal | William Ferguson | 4,094 | 20.3 | −2.9 | |
Total formal votes | 20,157 | 97.6 | |||
Informal votes | 498 | 2.4 | |||
Turnout | 20,655 | 56.3 | |||
Labor hold | Swing | +2.9 | |||
Party | Candidate | Votes | % | ±% | |
---|---|---|---|---|---|
Liberal | Henry Pigott | 12,770 | 51.2 | −0.9 | |
Labor | William Johnson | 12,169 | 48.8 | +0.9 | |
Total formal votes | 24,939 | 97.5 | |||
Informal votes | 635 | 2.5 | |||
Turnout | 25,574 | 77.9 | |||
Liberal hold | Swing | −0.9 | |||
Party | Candidate | Votes | % | ±% | |
---|---|---|---|---|---|
Labor | James Catts | 16,568 | 60.7 | +2.0 | |
Liberal | Stanley Yarrington | 10,197 | 37.4 | −1.6 | |
Socialist | Emily Paul | 509 | 1.9 | −0.3 | |
Total formal votes | 27,274 | 97.7 | |||
Informal votes | 629 | 2.3 | |||
Turnout | 27,903 | 60.6 | |||
Labor hold | Swing | +1.8 | |||
Party | Candidate | Votes | % | ±% | |
---|---|---|---|---|---|
Liberal | John Thomson | unopposed | |||
Liberal hold | Swing | ||||
Party | Candidate | Votes | % | ±% | |
---|---|---|---|---|---|
Labor | Robert Howe | 14,963 | 61.3 | +3.6 | |
Liberal | John McEachern | 9,450 | 38.7 | −3.6 | |
Total formal votes | 24,413 | 97.7 | |||
Informal votes | 587 | 2.3 | |||
Turnout | 25,000 | 58.5 | |||
Labor hold | Swing | +3.6 | |||
Party | Candidate | Votes | % | ±% | |
---|---|---|---|---|---|
Labor | William Spence | 12,309 | 60.5 | +0.0 | |
Liberal | William Kelk | 8,036 | 39.5 | −0.0 | |
Total formal votes | 20,345 | 96.1 | |||
Informal votes | 818 | 3.9 | |||
Turnout | 21,163 | 69.5 | |||
Labor hold | Swing | +0.0 | |||
Party | Candidate | Votes | % | ±% | |
---|---|---|---|---|---|
Labor | John West | 12,831 | 57.3 | +1.2 | |
Liberal | Lindsay Thompson | 9,568 | 42.7 | -1.2 | |
Total formal votes | 22,399 | 96.8 | |||
Informal votes | 736 | 3.2 | |||
Turnout | 23,135 | 51.1 | |||
Labor hold | Swing | +1.2 | |||
Party | Candidate | Votes | % | ±% | |
---|---|---|---|---|---|
Liberal | Austin Chapman | 13,439 | 59.2 | +0.5 | |
Labor | Harry Lestrange | 9,261 | 40.8 | -0.5 | |
Total formal votes | 22,700 | 97.6 | |||
Informal votes | 589 | 2.5 | |||
Turnout | 23,289 | 72.7 | |||
Liberal hold | Swing | +0.5 | |||
Party | Candidate | Votes | % | ±% | |
---|---|---|---|---|---|
Labor | William Webster | 13,560 | 53.8 | +1.6 | |
Liberal | John Blackney | 11,658 | 46.2 | -1.6 | |
Total formal votes | 25,218 | 97.2 | |||
Informal votes | 719 | 2.8 | |||
Turnout | 25,937 | 73.3 | |||
Labor hold | Swing | +1.6 | |||
Party | Candidate | Votes | % | ±% | |
---|---|---|---|---|---|
Liberal | Robert Patten | 13,841 | 51.0 | +0.3 | |
Labor | Patrick Sullivan | 13,320 | 49.0 | +49.0 | |
Total formal votes | 27,161 | 97.7 | |||
Informal votes | 645 | 2.3 | |||
Turnout | 27,806 | 76.2 | |||
Liberal hold | Swing | +0.3 | |||
Party | Candidate | Votes | % | ±% | |
---|---|---|---|---|---|
Labor | Matthew Charlton | 12,057 | 54.6 | +0.1 | |
Liberal | Alexander Hay | 10,045 | 45.4 | -0.1 | |
Total formal votes | 22,102 | 98.1 | |||
Informal votes | 429 | 1.9 | |||
Turnout | 22,531 | 61.5 | |||
Labor hold | Swing | +0.1 | |||
Party | Candidate | Votes | % | ±% | |
---|---|---|---|---|---|
Labor | George Burns | 17,884 | 54.2 | +4.0 | |
Liberal | George Fuller | 15,096 | 45.8 | -4.0 | |
Total formal votes | 32,980 | 98.9 | |||
Informal votes | 382 | 1.1 | |||
Turnout | 33,362 | 75.7 | |||
Labor hold | Swing | +4.0 | |||
Party | Candidate | Votes | % | ±% | |
---|---|---|---|---|---|
Liberal | Elliot Johnson | 16,556 | 53.5 | -3.6 | |
Labor | Hector Lamond | 14,391 | 46.5 | +3.6 | |
Total formal votes | 30,947 | 98.0 | |||
Informal votes | 639 | 2.0 | |||
Turnout | 31,586 | 64.2 | |||
Liberal hold | Swing | -3.6 | |||
Party | Candidate | Votes | % | ±% | |
---|---|---|---|---|---|
Labor | Ernest Carr | 12,888 | 53.3 | +3.3 | |
Liberal | Robert Moore | 11,288 | 46.7 | -0.2 | |
Total formal votes | 24,176 | 97.8 | |||
Informal votes | 538 | 2.2 | |||
Turnout | 24,714 | 74.3 | |||
Labor hold | Swing | +1.7 | |||
Party | Candidate | Votes | % | ±% | |
---|---|---|---|---|---|
Liberal | Richard Orchard | 16,815 | 52.7 | -1.5 | |
Labor | Voltaire Molesworth | 15,092 | 47.3 | +4.3 | |
Total formal votes | 31,907 | 97.7 | |||
Informal votes | 747 | 2.3 | |||
Turnout | 32,654 | 69.2 | |||
Liberal hold | Swing | -2.9 | |||
Party | Candidate | Votes | % | ±% | |
---|---|---|---|---|---|
Liberal | Percy Abbott | 13,929 | 56.7 | +0.2 | |
Labor | Edward Bowman | 10,633 | 43.3 | -0.2 | |
Total formal votes | 24,562 | 97.9 | |||
Informal votes | 533 | 2.1 | |||
Turnout | 25,095 | 73.8 | |||
Liberal hold | Swing | +0.2 | |||
Party | Candidate | Votes | % | ±% | |
---|---|---|---|---|---|
Labor | David Watkins | unopposed | |||
Labor hold | Swing | ||||
Party | Candidate | Votes | % | ±% | |
---|---|---|---|---|---|
Liberal | Granville Ryrie | 19,810 | 67.6 | -1.5 | |
Labor | Roland Bradley | 9,507 | 32.4 | +1.5 | |
Total formal votes | 29,317 | 97.2 | |||
Informal votes | 853 | 2.8 | |||
Turnout | 30,170 | 63.7 | |||
Liberal hold | Swing | -1.5 | |||
Party | Candidate | Votes | % | ±% | |
---|---|---|---|---|---|
Liberal | Bruce Smith | 19,259 | 58.5 | -3.4 | |
Labor | William Russell | 13,676 | 41.5 | +3.4 | |
Total formal votes | 32,935 | 97.9 | |||
Informal votes | 722 | 2.1 | |||
Turnout | 33,657 | 64.9 | |||
Liberal hold | Swing | -3.4 | |||
Party | Candidate | Votes | % | ±% | |
---|---|---|---|---|---|
Liberal | Joseph Cook | unopposed | |||
Liberal hold | Swing | ||||
Party | Candidate | Votes | % | ±% | |
---|---|---|---|---|---|
Liberal | Walter Massy-Greene | unopposed | |||
Liberal hold | Swing | unopposed | |||
Party | Candidate | Votes | % | ±% | |
---|---|---|---|---|---|
Labor | John Chanter | 14,454 | 52.1 | +3.1 | |
Liberal | Franc Falkiner | 13,315 | 47.9 | -3.1 | |
Total formal votes | 27,769 | 97.3 | |||
Informal votes | 773 | 2.7 | |||
Turnout | 28,542 | 74.3 | |||
Labor gain from Liberal | Swing | +3.1 | |||
Party | Candidate | Votes | % | ±% | |
---|---|---|---|---|---|
Liberal | William Fleming | 11,822 | 53.4 | -1.9 | |
Labor | John Fraser | 10,337 | 46.6 | +1.9 | |
Total formal votes | 22,159 | 97.4 | |||
Informal votes | 591 | 2.6 | |||
Turnout | 22,750 | 69.8 | |||
Liberal hold | Swing | -1.9 | |||
Party | Candidate | Votes | % | ±% | |
---|---|---|---|---|---|
Labor | Edward Riley | 15,792 | 68.8 | +3.8 | |
Liberal | George Pitt | 7,157 | 31.2 | -3.8 | |
Total formal votes | 22,949 | 97.1 | |||
Informal votes | 680 | 2.9 | |||
Turnout | 23,629 | 52.8 | |||
Labor hold | Swing | +3.8 | |||
Party | Candidate | Votes | % | ±% | |
---|---|---|---|---|---|
Liberal | Willie Kelly | 17,079 | 56.5 | -5.2 | |
Labor | Robert Cruickshank | 13,171 | 43.5 | +5.2 | |
Total formal votes | 30,250 | 97.5 | |||
Informal votes | 790 | 2.5 | |||
Turnout | 31,040 | 63.9 | |||
Liberal hold | Swing | -5.2 | |||
Party | Candidate | Votes | % | ±% | |
---|---|---|---|---|---|
Labor | John Lynch | 13,162 | 50.0 | +5.9 | |
Liberal | Alfred Conroy | 13,155 | 50.0 | −5.9 | |
Total formal votes | 26,317 | 97.9 | |||
Informal votes | 552 | 2.1 | |||
Turnout | 26,869 | 75.7 | |||
Labor gain from Liberal | Swing | +5.9 | |||
Party | Candidate | Votes | % | ±% | |
---|---|---|---|---|---|
Labor | Billy Hughes | 15,774 | 75.3 | +4.0 | |
Liberal | Walter Finch | 5,187 | 24.7 | -4.0 | |
Total formal votes | 20,961 | 96.6 | |||
Informal votes | 731 | 3.4 | |||
Turnout | 21,692 | 54.8 | |||
Labor hold | Swing | +4.0 | |||
Party | Candidate | Votes | % | ±% | |
---|---|---|---|---|---|
Liberal | William Watt | 17,607 | 58.4 | −6.6 | |
Labor | John Curtin | 12,526 | 41.6 | +6.6 | |
Total formal votes | 30,133 | 97.7 | |||
Informal votes | 719 | 2.3 | |||
Turnout | 30,852 | 78.5 | |||
Liberal hold | Swing | −6.6 | |||
Party | Candidate | Votes | % | ±% | |
---|---|---|---|---|---|
Labor | Charles McGrath | 16,734 | 51.2 | +0.6 | |
Liberal | Russell Coldham | 15,963 | 48.8 | −0.6 | |
Total formal votes | 32,697 | 98.3 | |||
Informal votes | 566 | 1.7 | |||
Turnout | 33,263 | 87.3 | |||
Labor hold | Swing | +0.6 | |||
Party | Candidate | Votes | % | ±% | |
---|---|---|---|---|---|
Labor | Frank Brennan | unopposed | |||
Labor hold | Swing | ||||
Party | Candidate | Votes | % | ±% | |
---|---|---|---|---|---|
Labor | John Arthur | 16,134 | 55.1 | +4.6 | |
Liberal | Frank Maldon Robb | 13,145 | 44.9 | −1.7 | |
Total formal votes | 29,279 | 99.3 | |||
Informal votes | 509 | 1.7 | |||
Turnout | 29,788 | 83.8 | |||
Labor hold | Swing | +3.1 | |||
Party | Candidate | Votes | % | ±% | |
---|---|---|---|---|---|
Labor | Frank Anstey | 22,075 | 65.9 | +5.9 | |
Liberal | Richard Jennings | 11,407 | 34.1 | −5.9 | |
Total formal votes | 33,482 | 98.3 | |||
Informal votes | 583 | 1.7 | |||
Turnout | 34,065 | 76.3 | |||
Labor hold | Swing | +5.9 | |||
Party | Candidate | Votes | % | ±% | |
---|---|---|---|---|---|
Liberal | Chester Manifold | 16,575 | 51.6 | −0.6 | |
Labor | Thomas Burke | 15,535 | 48.4 | +0.6 | |
Total formal votes | 32,110 | 98.4 | |||
Informal votes | 530 | 1.6 | |||
Turnout | 32,640 | 85.8 | |||
Liberal hold | Swing | −0.6 | |||
Party | Candidate | Votes | % | ±% | |
---|---|---|---|---|---|
Labor | Alfred Ozanne | 16,064 | 51.2 | +3.3 | |
Liberal | William Kendell | 15,316 | 48.8 | −2.6 | |
Total formal votes | 31,380 | 98.4 | |||
Informal votes | 519 | 1.6 | |||
Turnout | 31,899 | 82.4 | |||
Labor gain from Liberal | Swing | +3.0 | |||
Party | Candidate | Votes | % | ±% | |
---|---|---|---|---|---|
Liberal | Albert Palmer | 16,805 | 58.2 | +0.6 | |
Labor | James Gourley | 12,053 | 41.8 | +6.1 | |
Total formal votes | 28,858 | 98.0 | |||
Informal votes | 589 | 2.0 | |||
Turnout | 29,447 | 80.7 | |||
Liberal hold | Swing | -2.8 | |||
Party | Candidate | Votes | % | ±% | |
---|---|---|---|---|---|
Labor | Joseph Hannan | 17,483 | 59.3 | +6.0 | |
Liberal | Frank Carse | 11,981 | 40.7 | -6.0 | |
Total formal votes | 29,464 | 97.9 | |||
Informal votes | 626 | 2.1 | |||
Turnout | 30,090 | 75.7 | |||
Labor hold | Swing | +6.0 | |||
Party | Candidate | Votes | % | ±% | |
---|---|---|---|---|---|
Liberal | Sir William Irvine | 14,956 | 52.7 | -5.1 | |
Labor | John McDougall | 13,448 | 47.3 | +5.1 | |
Total formal votes | 28,404 | 97.8 | |||
Informal votes | 629 | 2.2 | |||
Turnout | 29,033 | 77.6 | |||
Liberal hold | Swing | -5.1 | |||
Party | Candidate | Votes | % | ±% | |
---|---|---|---|---|---|
Independent Labor | George Wise | 15,484 | 51.0 | +6.0 | |
Liberal | James Bennett | 14,874 | 49.0 | -6.0 | |
Total formal votes | 30,358 | 98.5 | |||
Informal votes | 473 | 1.5 | |||
Turnout | 30,831 | 83.3 | |||
Independent Labor gain from Liberal | Swing | +6.0 | |||
Party | Candidate | Votes | % | ±% | |
---|---|---|---|---|---|
Labor | Edward Jolley | 14,694 | 50.3 | +4.2 | |
Liberal | Hans Irvine | 14,517 | 49.7 | -4.2 | |
Total formal votes | 29,211 | 98.3 | |||
Informal votes | 495 | 1.7 | |||
Turnout | 29,706 | 85.5 | |||
Labor gain from Liberal | Swing | +4.2 | |||
Party | Candidate | Votes | % | ±% | |
---|---|---|---|---|---|
Liberal | James Boyd | 17,742 | 42.8 | -13.5 | |
Labor | Albert Andrews | 12,607 | 37.5 | +5.3 | |
Independent | Richard Crouch | 3,238 | 9.6 | +9.6 | |
Total formal votes | 33,587 | 97.8 | |||
Informal votes | 753 | 2.2 | |||
Turnout | 34,340 | 74.7 | |||
Liberal hold | Swing | -9.4 | |||
Party | Candidate | Votes | % | ±% | |
---|---|---|---|---|---|
Labor | Parker Moloney | 15,519 | 51.0 | +3.1 | |
Liberal | Cornelius Ahern | 14,900 | 49.0 | −2.8 | |
Total formal votes | 30,419 | 99.3 | |||
Informal votes | 217 | 0.7 | |||
Turnout | 30,636 | 86.9 | |||
Labor gain from Liberal | Swing | +3.0 | |||
Party | Candidate | Votes | % | ±% | |
---|---|---|---|---|---|
Liberal | Sir Robert Best | 18,545 | 59.4 | −2.5 | |
Independent Socialist | Vida Goldstein | 10,264 | 32.9 | −5.2 | |
Independent | Edward Terry | 2,420 | 7.7 | +7.7 | |
Total formal votes | 31,229 | 98.0 | |||
Informal votes | 636 | 2.0 | |||
Turnout | 31,865 | 76.3 | |||
Liberal hold | Swing | +1.4 | |||
Party | Candidate | Votes | % | ±% | |
---|---|---|---|---|---|
Labor | James Fenton | 20,834 | 64.3 | +3.5 | |
Liberal | Edward Reynolds | 11,574 | 35.7 | -3.5 | |
Total formal votes | 32,408 | 98.2 | |||
Informal votes | 583 | 1.8 | |||
Turnout | 32,991 | 72.4 | |||
Labor hold | Swing | +3.5 | |||
Party | Candidate | Votes | % | ±% | |
---|---|---|---|---|---|
Labor | William Maloney | 18,471 | 69.3 | -2.6 | |
Liberal | Wilfrid Kent Hughes | 8,194 | 30.7 | +30.7 | |
Total formal votes | 26,665 | 97.1 | |||
Informal votes | 807 | 2.9 | |||
Turnout | 27,472 | 72.9 | |||
Labor hold | Swing | -2.6 | |||
Party | Candidate | Votes | % | ±% | |
---|---|---|---|---|---|
Labor | James Mathews | unopposed | |||
Labor hold | Swing | ||||
Party | Candidate | Votes | % | ±% | |
---|---|---|---|---|---|
Liberal | Arthur Rodgers | 16,079 | 53.6 | -0.6 | |
Labor | Neil Mackinnon | 13,902 | 46.4 | +0.6 | |
Total formal votes | 29,981 | 98.4 | |||
Informal votes | 480 | 1.6 | |||
Turnout | 30,461 | 85.9 | |||
Liberal hold | Swing | -0.6 | |||
Party | Candidate | Votes | % | ±% | |
---|---|---|---|---|---|
Liberal | Sydney Sampson | unopposed | |||
Liberal hold | Swing | ||||
Party | Candidate | Votes | % | ±% | |
---|---|---|---|---|---|
Labor | Frank Tudor | unopposed | |||
Labor hold | Swing | ||||
Party | Candidate | Votes | % | ±% | |
---|---|---|---|---|---|
Labor | William Finlayson | 18,743 | 60.3 | +3.4 | |
Liberal | John Lackey | 12,353 | 39.7 | −3.4 | |
Total formal votes | 31,096 | 97.5 | |||
Informal votes | 809 | 2.5 | |||
Turnout | 31,905 | 74.7 | |||
Labor hold | Swing | +3.4 | |||
Party | Candidate | Votes | % | ±% | |
---|---|---|---|---|---|
Labor | William Higgs | 15,475 | 67.4 | +3.3 | |
Liberal | Neal Macrossan | 7,489 | 32.6 | −3.3 | |
Total formal votes | 22,964 | 97.0 | |||
Informal votes | 700 | 3.0 | |||
Turnout | 23,664 | 70.9 | |||
Labor hold | Swing | +3.3 | |||
Party | Candidate | Votes | % | ±% | |
---|---|---|---|---|---|
Liberal | Littleton Groom | 15,148 | 56.9 | -3.1 | |
Labor | Paul Bauers | 11,495 | 43.1 | +3.1 | |
Total formal votes | 26,643 | 96.7 | |||
Informal votes | 914 | 3.3 | |||
Turnout | 27,557 | 78.0 | |||
Liberal hold | Swing | -3.1 | |||
Party | Candidate | Votes | % | ±% | |
---|---|---|---|---|---|
Labor | Fred Bamford | 18,700 | 64.4 | +6.4 | |
Liberal | Frank Fraser | 10,350 | 35.6 | -6.4 | |
Total formal votes | 29,050 | 97.2 | |||
Informal votes | 829 | 2.8 | |||
Turnout | 29,879 | 74.2 | |||
Labor hold | Swing | +6.4 | |||
Party | Candidate | Votes | % | ±% | |
---|---|---|---|---|---|
Labor | Charles McDonald | unopposed | |||
Labor hold | Swing | ||||
Party | Candidate | Votes | % | ±% | |
---|---|---|---|---|---|
Liberal | Jacob Stumm | 15,475 | 52.3 | -2.4 | |
Labor | Arthur Lilley | 14,102 | 47.7 | +2.4 | |
Total formal votes | 29,577 | 97.7 | |||
Informal votes | 705 | 2.3 | |||
Turnout | 30,282 | 77.6 | |||
Liberal hold | Swing | -2.4 | |||
Party | Candidate | Votes | % | ±% | |
---|---|---|---|---|---|
Labor | Jim Page | unopposed | |||
Labor hold | Swing | ||||
Party | Candidate | Votes | % | ±% | |
---|---|---|---|---|---|
Liberal | Hugh Sinclair | 15,811 | 57.3 | -3.4 | |
Labor | John Sherlock | 11,774 | 42.7 | +3.4 | |
Total formal votes | 27,585 | 97.6 | |||
Informal votes | 667 | 2.4 | |||
Turnout | 28,252 | 77.8 | |||
Liberal hold | Swing | -3.4 | |||
Party | Candidate | Votes | % | ±% | |
---|---|---|---|---|---|
Labor | James Sharpe | 18,234 | 56.8 | +2.4 | |
Liberal | James Bayley | 13,841 | 43.2 | -2.4 | |
Total formal votes | 32,075 | 97.6 | |||
Informal votes | 805 | 2.4 | |||
Turnout | 32,880 | 79.2 | |||
Labor hold | Swing | +2.4 | |||
Party | Candidate | Votes | % | ±% | |
---|---|---|---|---|---|
Labor | Andrew Fisher | 16,494 | 64.3 | +8.7 | |
Queensland Farmers | John Austin | 9,155 | 35.7 | +35.7 | |
Total formal votes | 25,649 | 97.0 | |||
Informal votes | 788 | 3.0 | |||
Turnout | 26,437 | 78.1 | |||
Labor hold | Swing | +8.7 | |||
Party | Candidate | Votes | % | ±% | |
---|---|---|---|---|---|
Labor | George Edwin Yates | 16,762 | 66.4 | +0.3 | |
Liberal | Walter Hamilton | 8,461 | 33.5 | +4.1 | |
Total formal votes | 25,223 | 97.6 | |||
Informal votes | 612 | 2.4 | |||
Turnout | 25,835 | 73.3 | |||
Labor hold | Swing | −2.0 | |||
Party | Candidate | Votes | % | ±% | |
---|---|---|---|---|---|
Liberal | Paddy Glynn | unopposed | |||
Liberal hold | Swing | ||||
Party | Candidate | Votes | % | ±% | |
---|---|---|---|---|---|
Liberal | John Livingston | 16,866 | 56.7 | −2.3 | |
Labor | William Sampson | 12,876 | 43.3 | +2.3 | |
Total formal votes | 29,742 | 97.3 | |||
Informal votes | 814 | 2.7 | |||
Turnout | 30,556 | 81.7 | |||
Liberal hold | Swing | −2.3 | |||
Party | Candidate | Votes | % | ±% | |
---|---|---|---|---|---|
Labor | George Dankel | 18,822 | 55.3 | +2.3 | |
Liberal | Samuel Hunt | 15,227 | 44.7 | −2.3 | |
Total formal votes | 34,049 | 97.8 | |||
Informal votes | 755 | 2.2 | |||
Turnout | 34,804 | 81.8 | |||
Labor hold | Swing | +2.3 | |||
Party | Candidate | Votes | % | ±% | |
---|---|---|---|---|---|
Labor | Alexander Poynton | 14,218 | 54.0 | +2.0 | |
Liberal | William Morrow | 12,116 | 46.0 | -2.0 | |
Total formal votes | 26,334 | 97.9 | |||
Informal votes | 565 | 2.1 | |||
Turnout | 26,899 | 80.3 | |||
Labor hold | Swing | +2.0 | |||
Party | Candidate | Votes | % | ±% | |
---|---|---|---|---|---|
Labor | William Archibald | 25,913 | 74.4 | -25.6 | |
Liberal | James Craig | 8,895 | 25.6 | +25.6 | |
Total formal votes | 34,808 | 97.6 | |||
Informal votes | 839 | 2.4 | |||
Turnout | 35,647 | 77.8 | |||
Labor hold | Swing | -25.6 | |||
Party | Candidate | Votes | % | ±% | |
---|---|---|---|---|---|
Liberal | Richard Foster | 14,505 | 52.4 | -1.3 | |
Labor | William Harvey | 13,197 | 47.6 | +1.3 | |
Total formal votes | 27,702 | 97.6 | |||
Informal votes | 695 | 2.4 | |||
Turnout | 28,397 | 84.7 | |||
Liberal hold | Swing | -1.3 | |||
Party | Candidate | Votes | % | ±% | |
---|---|---|---|---|---|
Liberal | Henry Gregory | 12,817 | 53.9 | +1.3 | |
Labor | Patrick Coffey | 10,941 | 46.1 | −1.3 | |
Total formal votes | 23,758 | 95.9 | |||
Informal votes | 1,007 | 4.1 | |||
Turnout | 24,765 | 68.9 | |||
Liberal hold | Swing | +1.3 | |||
Party | Candidate | Votes | % | ±% | |
---|---|---|---|---|---|
Labor | Reginald Burchell | 16,385 | 56.3 | +0.5 | |
Liberal | Thomas Briggs | 12,705 | 43.7 | -0.5 | |
Total formal votes | 29,090 | 96.9 | |||
Informal votes | 937 | 3.1 | |||
Turnout | 30,027 | 77.1 | |||
Labor hold | Swing | +0.5 | |||
Party | Candidate | Votes | % | ±% | |
---|---|---|---|---|---|
Labor | Hugh Mahon | unopposed | |||
Labor hold | Swing | ||||
Party | Candidate | Votes | % | ±% | |
---|---|---|---|---|---|
Liberal | James Fowler | 15,256 | 55.8 | +2.5 | |
Labor | Alick McCallum | 12,071 | 44.2 | -2.5 | |
Total formal votes | 27,327 | 97.0 | |||
Informal votes | 836 | 3.0 | |||
Turnout | 28,163 | 67.7 | |||
Liberal hold | Swing | +2.5 | |||
Party | Candidate | Votes | % | ±% | |
---|---|---|---|---|---|
Liberal | Sir John Forrest | 15,950 | 59.2 | +4.3 | |
Labor | Walter Peters | 10,985 | 40.8 | -4.3 | |
Total formal votes | 26,935 | 97.2 | |||
Informal votes | 787 | 2.8 | |||
Turnout | 27,722 | 72.8 | |||
Liberal hold | Swing | +4.3 | |||
Party | Candidate | Votes | % | ±% | |
---|---|---|---|---|---|
Labor | Jens Jensen | 9,731 | 56.0 | +3.6 | |
Liberal | Alexander Marshall | 7,638 | 44.0 | −3.6 | |
Total formal votes | 17,369 | 98.5 | |||
Informal votes | 270 | 1.5 | |||
Turnout | 17,639 | 79.0 | |||
Labor hold | Swing | +3.6 | |||
Party | Candidate | Votes | % | ±% | |
---|---|---|---|---|---|
Labor | King O'Malley | 8,585 | 56.1 | +4.0 | |
Liberal | Ernest Plummer | 6,723 | 43.9 | -4.0 | |
Total formal votes | 15,308 | 97.8 | |||
Informal votes | 340 | 2.2 | |||
Turnout | 15,648 | 78.6 | |||
Labor hold | Swing | +4.0 | |||
Party | Candidate | Votes | % | ±% | |
---|---|---|---|---|---|
Labor | William Laird Smith | 9,752 | 55.9 | +3.4 | |
Liberal | Arthur Clerke | 7,701 | 44.1 | -1.9 | |
Total formal votes | 17,453 | 97.0 | |||
Informal votes | 535 | 3.0 | |||
Turnout | 17,988 | 77.5 | |||
Labor hold | Swing | +2.6 | |||
Party | Candidate | Votes | % | ±% | |
---|---|---|---|---|---|
Liberal | William McWilliams | unopposed | |||
Liberal hold | Swing | ||||
Party | Candidate | Votes | % | ±% | |
---|---|---|---|---|---|
Liberal | Llewellyn Atkinson | 8,169 | 60.9 | -1.7 | |
Labor | Henry McFie | 5,255 | 39.1 | +1.7 | |
Total formal votes | 13,424 | 97.1 | |||
Informal votes | 404 | 2.9 | |||
Turnout | 13,828 | 74.0 | |||
Liberal hold | Swing | -1.7 | |||
Philip Ernest Lucock, CBE was an Australian politician and Presbysterian minister. He served in the House of Representatives from 1952 to 1980, representing the Division of Lyne for the Country Party. He was Deputy Speaker for a record span of over 13 years.
William Henry Carpenter was an Australian politician. He held seats in three parliaments: the South Australian Legislative Assembly, the Australian House of Representatives and the Western Australian Legislative Assembly.
This is a list of electoral results for the Division of Calare in Australian federal elections from the division's creation in 1906 until the present.
Francis Clarke was an Australian politician.
Edmund Lonsdale was an Australian politician. Born in Morpeth, New South Wales, he was schooled in Maitland before becoming a bricklayer, builder and contractor. He was also an alderman on Armidale Shire Council.
Francis James Foster, JP, MP was an Australian politician, representing the Division of New England in the House of Representatives for the Australian Labor Party from 1906 to 1913.
Alexander Hay was a New Zealand-born Australian pastoralist, businessman and politician. He was a member of the Australian House of Representatives from 1919 to 1922, representing the electorate of New England for the Nationalist Party (1919–1920), Country Party (1920–1921) and as an independent (1921–1922).
This is a list of electoral results for the Division of Newcastle in Australian federal elections from the electorate's creation in 1901 until the present.
This is a list of electoral results for the Division of Parramatta in Australian federal elections from the division's creation in 1901 until the present.
This is a list of electoral results for the Division of Corio in Australian federal elections from the division's creation in 1901 until the present.
This is a list of electoral results for the Division of Canning in Australian federal elections from the division's creation in 1949 until the present.
This is a list of electoral results for the Division of Kalgoorlie in Australian federal elections from the division's creation in 1901 until its abolition in 2010.
This is a list of electoral results for the Division of Adelaide in Australian federal elections from the division's creation in 1903 until the present.
This is a list of electoral results for the Division of Angas in Australian federal elections from the division's creation in 1949 until its abolition in 1977.
This is a list of electoral results for the Division of Bass in Australian federal elections from the division's creation in 1903 until the present.
This is a list of electoral results for the Division of Franklin in Australian federal elections from the division's creation in 1903 until the present.
This is a list of electoral results for the Division of Darwin in Australian federal elections from the division's creation in 1903 until its abolition in 1955.
This is a list of electoral division results for the Australian 1963 federal election.
The Australian states each elected three members of the Australian Senate at the 1913 federal election to serve a six-year term starting on 1 July 1913.
The 5 September 1914 election was a double dissolution election which meant all 36 seats in the Senate were up for election, with each Australian states electing six members, with half to serve a six-year term and the rest to serve a three year term. Terms were taken to have commenced on 1 July 1914. The Senate resolved that in each State the three senators who received the most votes would sit for a six-year term, finishing on 30 June 1920 while the other half would sit for a three-year term, finishing on 30 June 1917.