| |||||||||||||||||||||||||||||||||||||||||||||||||||||||||||||||||
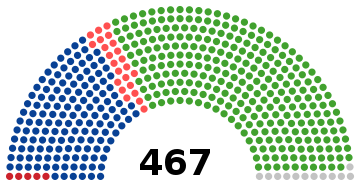
All 467 seats in the House of Representatives 234 seats needed for a majority | |||||||||||||||||||||||||||||||||||||||||||||||||||||||||||||||||
|---|---|---|---|---|---|---|---|---|---|---|---|---|---|---|---|---|---|---|---|---|---|---|---|---|---|---|---|---|---|---|---|---|---|---|---|---|---|---|---|---|---|---|---|---|---|---|---|---|---|---|---|---|---|---|---|---|---|---|---|---|---|---|---|---|---|
| Turnout | 71.14% ( | ||||||||||||||||||||||||||||||||||||||||||||||||||||||||||||||||
| |||||||||||||||||||||||||||||||||||||||||||||||||||||||||||||||||
 Districts shaded according to winners' vote strength | |||||||||||||||||||||||||||||||||||||||||||||||||||||||||||||||||
| |||||||||||||||||||||||||||||||||||||||||||||||||||||||||||||||||


| This article is part of a series on |
 |
|---|
|
General elections were held in Japan on 21 November 1963. The result was a victory for the Liberal Democratic Party (LDP), which won 283 of the 467 seats. [1] Voter turnout was 71.1%.
Contents
Most commentators believed that the election results would not radically alter the Japanese political landscape, and this was confirmed in the results, which did not see any party win or lose a large number of seats. Although the LDP lost 13 seats, 12 LDP-aligned independents were also elected. The highest gain in seats came from the Democratic Socialist Party (DSP), which tactically fielded far fewer candidates than the previous elections and concentrated on fewer districts, gaining six seats, which was more than any of the other opposition parties gained. The elections also saw the defeat of two former prime ministers: Tetsu Katayama of the DSP (formerly of the JSP) and Tanzan Ishibashi of the LDP. [2]