23 January 1949 | |||||||||||||||||||||||||||||||||||||||||||||||||||||||||||||||||||||||||||||||||||||
All 466 seats in the House of Representatives 234 seats needed for a majority | |||||||||||||||||||||||||||||||||||||||||||||||||||||||||||||||||||||||||||||||||||||
|---|---|---|---|---|---|---|---|---|---|---|---|---|---|---|---|---|---|---|---|---|---|---|---|---|---|---|---|---|---|---|---|---|---|---|---|---|---|---|---|---|---|---|---|---|---|---|---|---|---|---|---|---|---|---|---|---|---|---|---|---|---|---|---|---|---|---|---|---|---|---|---|---|---|---|---|---|---|---|---|---|---|---|---|---|---|
| Turnout | 74.04% ( | ||||||||||||||||||||||||||||||||||||||||||||||||||||||||||||||||||||||||||||||||||||
| |||||||||||||||||||||||||||||||||||||||||||||||||||||||||||||||||||||||||||||||||||||
 Districts shaded according to winners' vote strength | |||||||||||||||||||||||||||||||||||||||||||||||||||||||||||||||||||||||||||||||||||||
| |||||||||||||||||||||||||||||||||||||||||||||||||||||||||||||||||||||||||||||||||||||


| This article is part of a series on |
 |
|---|
|
General elections were held in Japan on 23 January 1949. The result was a landslide victory for the Democratic Liberal Party, which won 269 of the 466 seats. [1] Voter turnout was 74.0%. It was the first election held following the enactment of the current Constitution of Japan.
Contents
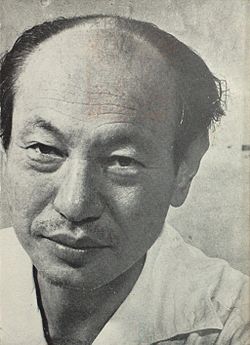
Future prime ministers Hayato Ikeda and Eisaku Satō and future Foreign Minister and Chief Cabinet Secretary Katsuo Okazaki were first elected in this election.
The second cabinet of Prime Minister Shigeru Yoshida was formed following the election.
The Japanese Communist Party's best prefecture performance was 20.07% in Osaka and its worst was 2.63% in Kagoshima. [2] This was the best performance of the JCP [3] until the 1972 election.
