California's 25th congressional district | |
---|---|
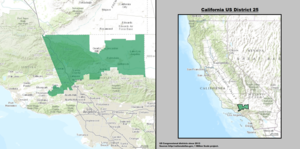
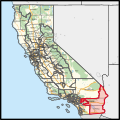
Interactive map of district boundaries
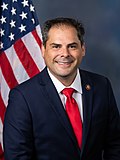
 since 2023 (Used in the 2022 elections) | |
Representative | |
Population (2023) | 779,900 |
Median household income | $64,962 [1] |
Ethnicity |
|
Cook PVI | D+6 [2] |
California's 25th congressional district is a congressional district in the U.S. state of California. The district is currently represented by Democrat Raul Ruiz.
The district includes all of Imperial County and parts of Riverside County and San Bernardino County. Cities in the new 25th district include Cathedral City, Indio, Coachella, El Centro, Calexico, San Jacinto, Hemet, and Needles. [3] Most of the majority-Latino parts of the Coachella Valley are in the 25th, while the rest of the valley is in the 41st district.
According to the APM Research Lab's Voter Profile Tools (featuring the U.S. Census Bureau's 2019 American Community Survey), the district contained about 491,000 potential voters (citizens, age 18+). Of these, 44% are White, 34% Latino, 10% Black, and 9% Asian. Immigrants make up 17% of the district's potential voters. Median income among households (with one or more potential voter) in the district is about $86,600, while 9% of households live below the poverty line. 12% of residents 25 years and older have not graduated high school, while 26% hold a bachelor's degree or higher.
Year | Office | Results [4] [5] [6] [7] [8] |
---|---|---|
2008 | President | Obama 54% - 45% |
2012 | President | Obama 55% - 43% |
2016 | President | Clinton 56% - 39% |
2018 | Governor | Newsom 55% - 45% |
Attorney General | Becerra 57% - 43% | |
2020 | President | Biden 57% - 41% |
2022 | Senate (Reg.) | Padilla 55% - 45% |
Governor | Newsom 53% - 47% | |
Lt. Governor | Kounalakis 52% - 48% | |
Secretary of State | Weber 54% - 46% | |
Attorney General | Bonta 53% - 47% | |
Treasurer | Ma 52% - 48% | |
Controller | Cohen 52% - 48% | |
2024 | President | Harris 50% - 48% |
Senate (Reg.) | Schiff 51% - 49% |
# | County | Seat | Population |
---|---|---|---|
25 | Imperial | El Centro | 179,057 |
65 | Riverside | Riverside | 2,492,442 |
71 | San Bernardino | San Bernardino | 2,195,611 |
As of the 2020 redistricting, California's 25th congressional district is located in the Mojave Desert. It encompasses Imperial County, most of Riverside County, and the eastern edge of San Bernardino. The district covers the entirety of the Arizona-California border.
Riverside County is split between this district and the 41st district. They are partitioned by Terwillinger Rd, Bailey Rd, Candelaria, Elder Creek Rd, Bonny Ln, Tule Peak Rd, Eastgate Trail, Goldrush Rd, Rule Valley Rd, Laura Ln, Dove Dr, Lago Grande, Barbara Trail, Valley Dr, Foolish Pleasure Rd, Highway 371, Gelding Way, Puckit Dr, Indian Rd, Wellman Rd, El Toro Rd, Burnt Valley Rd, Cahuilla Rd, Highway 74, Bull Canyon Rd, Santa Rosa-San Jacinto Mountains National Monument, Fred Waring Dr, Washington St, Highway 10, Davall Dr, Dinah Shore Dr, Plumley Rd, Gerald Ford Dr, E Ramon Rd, San Luis Rey Dr, San Joaquin Dr, Clubhouse View Dr, Mount San Jacinto State Park, Azalea Creek, Black Mountain Trail, Highway 243, North Fork San Jacinto River, Stetson Ave, Hemet St, Cornell St, Girard St, E Newport Rd, Domenigoni Parkway, Leon Rd, Grand Ave, State Highway 74, California Ave, W Devonshire Ave, Warren Rd, Ramona Expressway, San Jacinto River, Highway 79, Oak Valley Parkway, Champions Dr, Union St, Brookside Ave. The 25th district takes in the cities of Coachella, Banning, Desert Hot Springs, Indio, San Jacinto, Hemet, Beaumont, Blythe, and Cathedral City as well as the census-designated places Valle Vista, East Hemet, Winchester, Cabazon, Whitewater, Desert Edge, Sky Valley, Thousand Palms, Indio Hills, Desert Palms, Bermuda Dunes, Vista Santa Rosa, Thermal, Oasis, Mecca, North Shore, Desert Center, Mesa Verde, and Ripley
Party | Candidate | Votes | % | |
---|---|---|---|---|
Republican | Patrick J. Hillings (Incumbent) | 135,465 | 64.3 | |
Democratic | Woodrow Wilson Sayre | 75,125 | 35.7 | |
Total votes | 210,590 | 100.0 | ||
Turnout | ||||
Republican hold |
Party | Candidate | Votes | % | |
---|---|---|---|---|
Republican | Patrick J. Hillings (Incumbent) | 113,027 | 65.2 | |
Democratic | John S. Sobieski | 60,370 | 34.8 | |
Total votes | 173,397 | 100.0 | ||
Turnout | ||||
Republican hold |
Party | Candidate | Votes | % | |
---|---|---|---|---|
Republican | Patrick J. Hillings (Incumbent) | 166,305 | 63.8 | |
Democratic | John S. Sobieski | 94,180 | 36.2 | |
Total votes | 260,485 | 100.0 | ||
Turnout | ||||
Republican hold |
Party | Candidate | Votes | % | |||
---|---|---|---|---|---|---|
Democratic | George A. Kasem | 135,009 | 50.1 | |||
Republican | Prescott O. Lieberg | 134,406 | 49.9 | |||
Total votes | 269,415 | 100.0 | ||||
Turnout | ||||||
Democratic gain from Republican |
Party | Candidate | Votes | % | |||
---|---|---|---|---|---|---|
Republican | John H. Rousselot | 182,545 | 53.6 | |||
Democratic | George A. Kasem (Incumbent) | 158,289 | 46.4 | |||
Total votes | 340,834 | 100.0 | ||||
Turnout | ||||||
Republican gain from Democratic |
Party | Candidate | Votes | % | |||
---|---|---|---|---|---|---|
Democratic | Ronald B. Cameron | 62,371 | 53.6 | |||
Republican | John H. Rousselot (Incumbent) | 53,961 | 46.4 | |||
Total votes | 116,332 | 100.0 | ||||
Turnout | ||||||
Democratic gain from Republican |
Party | Candidate | Votes | % | |
---|---|---|---|---|
Democratic | Ronald B. Cameron (Incumbent) | 81,320 | 55.4 | |
Republican | Frank J. Walton | 65,344 | 44.6 | |
Total votes | 146,664 | 100.0 | ||
Turnout | ||||
Democratic hold |
Party | Candidate | Votes | % | |||
---|---|---|---|---|---|---|
Republican | Charles E. Wiggins | 70,154 | 52.6 | |||
Democratic | Ronald B. Cameron (Incumbent) | 63,345 | 47.4 | |||
Total votes | 133,499 | |||||
Republican gain from Democratic |
Party | Candidate | Votes | % | |
---|---|---|---|---|
Republican | Charles E. Wiggins (Incumbent) | 141,600 | 68.6 | |
Democratic | Keith F. Shirey | 64,732 | 31.4 | |
Total votes | 206,332 | 100.0 | ||
Turnout | ||||
Republican hold |
Party | Candidate | Votes | % | |
---|---|---|---|---|
Republican | Charles E. Wiggins (Incumbent) | 116,169 | 63.3 | |
Democratic | Leslie W. "Les" Craven | 64,386 | 35.1 | |
American Independent | Kevin Scanlon | 2,994 | 1.6 | |
Total votes | 183,549 | 100.0 | ||
Turnout | ||||
Republican hold |
Party | Candidate | Votes | % | |
---|---|---|---|---|
Republican | Charles E. Wiggins (Incumbent) | 115,908 | 64.9 | |
Democratic | Leslie W. "Les" Craven | 50,015 | 31.9 | |
American Independent | Alfred Romirez | 5,541 | 3.1 | |
Total votes | 171,464 | 100.0 | ||
Turnout | ||||
Republican hold |
Party | Candidate | Votes | % | |||
---|---|---|---|---|---|---|
Democratic | Edward R. Roybal (Incumbent) | 43,998 | 100.0 | |||
Turnout | ||||||
Democratic gain from Republican |
Party | Candidate | Votes | % | |
---|---|---|---|---|
Democratic | Edward R. Roybal (Incumbent) | 57,966 | 71.9 | |
Republican | Robert K. Watson | 17,737 | 22.0 | |
Peace and Freedom | Marilyn Se | 4,922 | 6.1 | |
Total votes | 80,625 | 100.0 | ||
Turnout | ||||
Democratic hold |
Party | Candidate | Votes | % | |
---|---|---|---|---|
Democratic | Edward R. Roybal (Incumbent) | 45,881 | 67.4 | |
Republican | Robert K. Watson | 22,205 | 32.6 | |
Total votes | 68,086 | 100.0 | ||
Turnout | ||||
Democratic hold |
Party | Candidate | Votes | % | |
---|---|---|---|---|
Democratic | Edward R. Roybal (Incumbent) | 49,080 | 66.0 | |
Republican | Richard E. Ferraro | 21,116 | 28.4 | |
Libertarian | William D. Mitchell | 4,169 | 5.6 | |
Total votes | 74,365 | 100.0 | ||
Turnout | ||||
Democratic hold |
Party | Candidate | Votes | % | |
---|---|---|---|---|
Democratic | Edward R. Roybal (Incumbent) | 71,106 | 84.5 | |
Libertarian | Daniel John Gorham | 12,060 | 14.5 | |
Total votes | 83,166 | 100.0 | ||
Turnout | ||||
Democratic hold |
Party | Candidate | Votes | % | |
---|---|---|---|---|
Democratic | Edward R. Roybal (Incumbent) | 74,261 | 71.7 | |
Republican | Roy D. "Bill" Bloxom | 24,968 | 24.1 | |
Libertarian | Anthony G. Bajada | 4,370 | 4.2 | |
Total votes | 103,599 | 100.0 | ||
Turnout | ||||
Democratic hold |
Party | Candidate | Votes | % | |
---|---|---|---|---|
Democratic | Edward R. Roybal (Incumbent) | 62,692 | 76.1 | |
Republican | Gregory L. Hardy | 17,558 | 21.3 | |
Libertarian | Ted Brown | 2,163 | 2.6 | |
Total votes | 82,413 | 100.0 | ||
Turnout | ||||
Democratic hold |
Party | Candidate | Votes | % | |
---|---|---|---|---|
Democratic | Edward R. Roybal (Incumbent) | 85,378 | 85.5 | |
Peace and Freedom | Paul Reyes | 8,746 | 8.8 | |
Libertarian | John C. Thie | 5,752 | 5.8 | |
Total votes | 98,876 | 100.0 | ||
Turnout | ||||
Democratic hold |
Party | Candidate | Votes | % | |
---|---|---|---|---|
Democratic | Edward R. Roybal (Incumbent) | 48,120 | 70.0 | |
Republican | Steven J. Renshaw | 17,021 | 24.8 | |
Libertarian | Robert H. Scott | 3,576 | 5.2 | |
Total votes | 68,717 | 100.0 | ||
Turnout | ||||
Democratic hold |
Party | Candidate | Votes | % | ||
---|---|---|---|---|---|
Republican | Buck McKeon | 113,611 | 51.9 | ||
Democratic | James H. Gilmartin | 72,233 | 33.0 | ||
Independent | Rick Pamplin | 13,930 | 6.4 | ||
Libertarian | Peggy L. Christensen | 6,932 | 3.2 | ||
Green | Charles Wilken | 6,919 | 3.2 | ||
Peace and Freedom | Nancy Lawrence | 5,090 | 2.3 | ||
Total votes | 218,715 | 100.0 | |||
Turnout | |||||
Republican win (new seat) |
Party | Candidate | Votes | % | |
---|---|---|---|---|
Republican | Buck McKeon (Incumbent) | 110,301 | 64.89 | |
Democratic | James H. Gilmartin | 53,445 | 31.44 | |
Libertarian | Devin Cutler | 6,205 | 3.65 | |
No party | Tulley (write-in) | 20 | 0.01 | |
Total votes | 169,971 | 100.0 | ||
Turnout | ||||
Republican hold |
Party | Candidate | Votes | % | |
---|---|---|---|---|
Republican | Buck McKeon (Incumbent) | 122,428 | 62.4 | |
Democratic | Diane Trautman | 65,089 | 33.2 | |
Libertarian | Bruce Acker | 6,173 | 3.2 | |
Peace and Freedom | Justin Gerber | 2,513 | 1.2 | |
Total votes | 196,203 | 100.0 | ||
Turnout | ||||
Republican hold |
Party | Candidate | Votes | % | |
---|---|---|---|---|
Republican | Buck McKeon (Incumbent) | 114,013 | 74.67 | |
Libertarian | Bruce Acker | 38,669 | 25.33 | |
Total votes | 152,682 | 100.0 | ||
Turnout | ||||
Republican hold |
Party | Candidate | Votes | % | |
---|---|---|---|---|
Republican | Buck McKeon (Incumbent) | 138,628 | 62.3 | |
Democratic | Sid Gold | 73,921 | 33.2 | |
Libertarian | Bruce R. Acker | 7,219 | 3.2 | |
Natural Law | Mews Small | 3,010 | 1.3 | |
Total votes | 222,778 | 100.0 | ||
Turnout | ||||
Republican hold |
Party | Candidate | Votes | % | |
---|---|---|---|---|
Republican | Buck McKeon (Incumbent) | 80,775 | 65.0 | |
Democratic | Bob Conaway | 38,674 | 31.1 | |
Libertarian | Frank M. Consolo Jr. | 4,887 | 3.9 | |
Total votes | 124,336 | 100.0 | ||
Turnout | ||||
Republican hold |
Party | Candidate | Votes | % | |
---|---|---|---|---|
Republican | Buck McKeon (Incumbent) | 145,575 | 64.5 | |
Democratic | Fred "Tim" Willoughby | 80,395 | 35.5 | |
Total votes | 225,970 | 100.0 | ||
Turnout | ||||
Republican hold |
Party | Candidate | Votes | % | |
---|---|---|---|---|
Republican | Buck McKeon (Incumbent) | 93,987 | 60.0 | |
Democratic | Robert Rodriguez | 55,913 | 35.7 | |
Libertarian | David W. Erickson | 6,873 | 4.3 | |
Total votes | 156,773 | 100.0 | ||
Turnout | ||||
Republican hold |
Party | Candidate | Votes | % | |
---|---|---|---|---|
Republican | Buck McKeon (Incumbent) | 144,660 | 57.73 | |
Democratic | Jackie Conaway | 105,929 | 42.27 | |
Total votes | 250,589 | 100.0 | ||
Turnout | 72.24 | |||
Republican hold |
Party | Candidate | Votes | % | |
---|---|---|---|---|
Republican | Buck McKeon (Incumbent) | 118,308 | 61.83 | |
Democratic | Jackie Conaway | 73,028 | 38.17 | |
Total votes | 191,336 | 100.0 | ||
Turnout | ||||
Republican hold |
Party | Candidate | Votes | % | |
---|---|---|---|---|
Republican | Buck McKeon (Incumbent) | 121,593 | 53.2 | |
Democratic | Lee Rogers | 106,982 | 46.8 | |
Total votes | 228,575 | 100.0 | ||
Turnout | ||||
Republican hold |
Party | Candidate | Votes | % | |
---|---|---|---|---|
Republican | Steve Knight | 60,847 | 53.3 | |
Republican | Tony Strickland | 53,225 | 46.7 | |
Total votes | 114,072 | 100.0 | ||
Turnout | ||||
Republican hold |
Party | Candidate | Votes | % | |
---|---|---|---|---|
Republican | Steve Knight (Incumbent) | 138,755 | 53.1 | |
Democratic | Bryan Caforio | 122,406 | 46.9 | |
Total votes | 261,161 | 100.0 | ||
Republican hold |
Party | Candidate | Votes | % | |
---|---|---|---|---|
Democratic | Katie Hill | 133,209 | 54.4 | |
Republican | Steve Knight (Incumbent) | 111,813 | 45.6 | |
Total votes | 245,022 | 100.0 | ||
Democratic gain from Republican |
Party | Candidate | Votes | % | ||
---|---|---|---|---|---|
Republican | Mike Garcia | 95,383 | 54.9 | ||
Democratic | Christy Smith | 78,406 | 45.1 | ||
Total votes | 173,868 | 100.0 | |||
Republican gain from Democratic |
Party | Candidate | Votes | % | |
---|---|---|---|---|
Republican | Mike Garcia (Incumbent) | 169,638 | 50.05 | |
Democratic | Christy Smith | 169,305 | 49.95 | |
Total votes | 338,943 | 100.0 | ||
Republican hold |
Party | Candidate | Votes | % | |
---|---|---|---|---|
Democratic | Raul Ruiz (Incumbent) | 87,641 | 57.4 | |
Republican | Brian Hawkins | 65,101 | 42.6 | |
Total votes | 152,742 | 100.0 | ||
Democratic hold |
{{cite web}}
: CS1 maint: archived copy as title (link){{cite web}}
: CS1 maint: archived copy as title (link)