Jarrahwood Western Australia | |||||||||
---|---|---|---|---|---|---|---|---|---|
![]() | |||||||||
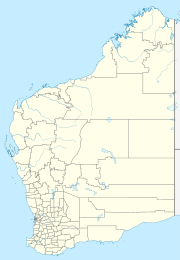
Coordinates | 33°48′S115°40′E / 33.80°S 115.67°E | ||||||||
Population | 9 (SAL 2021) [1] | ||||||||
Established | 1932 | ||||||||
Postcode(s) | 6275 | ||||||||
Elevation | 130 m (427 ft) [2] | ||||||||
Area | 1 km2 (0.39 sq mi) | ||||||||
Location | |||||||||
LGA(s) | City of Busselton | ||||||||
State electorate(s) | Vasse | ||||||||
Federal division(s) | Forrest | ||||||||
|
Jarrahwood is a small town located in the South West region of Western Australia, near the Vasse Highway between Busselton and Nannup. At the 2021 census, the area had a population of nine.
The town is named for the Jarrah Wood and Saw Mills Company which operated in the area and operated a private railway from the district to Wonnerup, which was purchased by the Government in 1906. It was gazetted in 1932. [3] The town lost much of its population after the closure of the local mill in 1982. A newspaper report from around this time described the town as containing "two schools, a hospital, a sizeable town hall, a number of diverse shops, a post office and about 50 company cottages". [4]
Jarrahwood experiences a Mediterranean climate (Köppen climate classification Csb) with warm-to-hot summers and cool winters. [2] It generally receives more rainfall and cooler minimum temperatures than Busselton. [4]
Climate data for Jarrahwood | |||||||||||||
---|---|---|---|---|---|---|---|---|---|---|---|---|---|
Month | Jan | Feb | Mar | Apr | May | Jun | Jul | Aug | Sep | Oct | Nov | Dec | Year |
Record high °C (°F) | 43.7 (110.7) | 42.5 (108.5) | 41.2 (106.2) | 35.0 (95.0) | 29.5 (85.1) | 24.0 (75.2) | 23.9 (75.0) | 25.7 (78.3) | 30.5 (86.9) | 34.3 (93.7) | 38.5 (101.3) | 40.5 (104.9) | 43.7 (110.7) |
Mean daily maximum °C (°F) | 30.0 (86.0) | 30.2 (86.4) | 27.8 (82.0) | 23.9 (75.0) | 20.1 (68.2) | 17.3 (63.1) | 16.5 (61.7) | 17.0 (62.6) | 18.4 (65.1) | 20.9 (69.6) | 24.1 (75.4) | 27.6 (81.7) | 22.8 (73.0) |
Mean daily minimum °C (°F) | 12.8 (55.0) | 13.6 (56.5) | 11.9 (53.4) | 8.8 (47.8) | 6.8 (44.2) | 5.4 (41.7) | 5.0 (41.0) | 5.3 (41.5) | 6.0 (42.8) | 7.5 (45.5) | 9.6 (49.3) | 11.2 (52.2) | 8.7 (47.7) |
Record low °C (°F) | 1.5 (34.7) | 3.2 (37.8) | 1.0 (33.8) | −1.2 (29.8) | −3.0 (26.6) | −4.4 (24.1) | −3.2 (26.2) | −2.5 (27.5) | −2.7 (27.1) | −2.0 (28.4) | −1.5 (29.3) | 1.0 (33.8) | −4.4 (24.1) |
Average precipitation mm (inches) | 15.5 (0.61) | 12.9 (0.51) | 22.1 (0.87) | 48.7 (1.92) | 121.4 (4.78) | 153.7 (6.05) | 178.1 (7.01) | 147.7 (5.81) | 101.2 (3.98) | 55.0 (2.17) | 39.7 (1.56) | 16.4 (0.65) | 908.5 (35.77) |
Source: Bureau of Meteorology [2] |