| Member | Party | Years | Cong
ress | Electoral history | Location |
|---|
| District established March 4, 1913 |

Joseph Howell
(Logan) | Republican | March 4, 1913 –
March 3, 1917 | 63rd
64th | Redistricted from the at-large district and re-elected in 1912.
Re-elected in 1914.
Retired. | |

Milton H. Welling
(Fielding) | Democratic | March 4, 1917 –
March 3, 1921 | 65th
66th | Elected in 1916.
Re-elected in 1918.
Retired to run for U.S. Senator. |

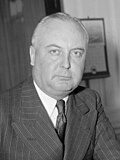
Don B. Colton
(Vernal) | Republican | March 4, 1921 –
March 3, 1933 | 67th
68th
69th
70th
71st
72nd | Elected in 1920.
Re-elected in 1922.
Re-elected in 1924.
Re-elected in 1926.
Re-elected in 1928.
Re-elected in 1930.
Lost re-election. |
Abe Murdock
(Beaver) | Democratic | March 4, 1933 –
January 3, 1941 | 73rd
74th
75th
76th | Elected in 1932.
Re-elected in 1934.
Re-elected in 1936.
Re-elected in 1938.
Retired to run for U.S. Senator. |

Walter K. Granger
(Cedar City) | Democratic | January 3, 1941 –
January 3, 1953 | 77th
78th
79th
80th
81st
82nd | Elected in 1940.
Re-elected in 1942.
Re-elected in 1944.
Re-elected in 1946.
Re-elected in 1948.
Re-elected in 1950.
Retired to run for U.S. Senator. |
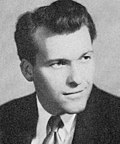
Douglas R. Stringfellow
(Ogden) | Republican | January 3, 1953 –
January 3, 1955 | 83rd | Elected in 1952.
Renominated, but replaced on ballot
due to personal scandal. |

Henry Aldous Dixon
(Ogden) | Republican | January 3, 1955 –
January 3, 1961 | 84th
85th
86th | Elected in 1954.
Re-elected in 1956.
Re-elected in 1958.
Retired. |

M. Blaine Peterson
(Ogden) | Democratic | January 3, 1961 –
January 3, 1963 | 87th | Elected in 1960.
Lost re-election. |

Laurence J. Burton
(Ogden) | Republican | January 3, 1963 –
January 3, 1971 | 88th
89th
90th
91st | Elected in 1962.
Re-elected in 1964.
Re-elected in 1966.
Re-elected in 1968.
Retired to run for U.S. Senator. |
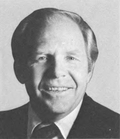
K. Gunn McKay
(Huntsville) | Democratic | January 3, 1971 –
January 3, 1981 | 92nd
93rd
94th
95th
96th | Elected in 1970.
Re-elected in 1972.
Re-elected in 1974.
Re-elected in 1976.
Re-elected in 1978.
Lost re-election. |

Jim Hansen
(Farmington) | Republican | January 3, 1981 –
January 3, 2003 | 97th
98th
99th
100th
101st
102nd
103rd
104th
105th
106th
107th | Elected in 1980.
Re-elected in 1982.
Re-elected in 1984.
Re-elected in 1986.
Re-elected in 1988.
Re-elected in 1990.
Re-elected in 1992.
Re-elected in 1994.
Re-elected in 1996.
Re-elected in 1998.
Re-elected in 2000.
Retired. |

Rob Bishop
(Brigham City) | Republican | January 3, 2003 –
January 3, 2021 | 108th
109th
110th
111th
112th
113th
114th
115th
116th | Elected in 2002.
Re-elected in 2004.
Re-elected in 2006.
Re-elected in 2008.
Re-elected in 2010.
Re-elected in 2012.
Re-elected in 2014.
Re-elected in 2016.
Re-elected in 2018.
Retired to join Thomas Wright's gubernatorial ticket. | 2003–2013:
 |
2013–2023:
 |

Blake Moore
(Salt Lake City) | Republican | January 3, 2021 –
present | 117th
118th
119th | Elected in 2020.
Re-elected in 2022.
Re-elected in 2024. |
2023–present:
 |


