This is a list of electoral division results for the Australian 1928 federal election.
Party | Candidate | Votes | % | ±% | |
---|---|---|---|---|---|
Labor | James Tully | 32,316 | 56.3 | +7.3 | |
Nationalist | Thomas Ley | 25,070 | 43.7 | −7.3 | |
Total formal votes | 57,386 | 95.4 | |||
Informal votes | 2,768 | 4.6 | |||
Turnout | 60,154 | 96.7 | |||
Labor gain from Nationalist | Swing | +7.3 | |||
Party | Candidate | Votes | % | ±% | |
---|---|---|---|---|---|
Nationalist | Sir Neville Howse | 22,673 | 60.7 | +1.6 | |
Labor | James O'Donnell | 14,664 | 39.3 | −0.3 | |
Total formal votes | 37,337 | 95.9 | |||
Informal votes | 1,581 | 4.1 | |||
Turnout | 38,918 | 93.7 | |||
Nationalist hold | Swing | +0.9 | |||
Party | Candidate | Votes | % | ±% | |
---|---|---|---|---|---|
Labor | Edward Riley | 28,326 | 75.5 | +7.7 | |
Nationalist | Humphrey Earl | 9,197 | 24.5 | −7.7 | |
Total formal votes | 37,523 | 94.5 | |||
Informal votes | 2,202 | 5.5 | |||
Turnout | 39,725 | 95.1 | |||
Labor hold | Swing | +7.7 | |||
Party | Candidate | Votes | % | ±% | |
---|---|---|---|---|---|
Country | Earle Page | 27,556 | 76.8 | +6.8 | |
Labor | Tom Swiney | 8,336 | 23.2 | −6.8 | |
Total formal votes | 35,892 | 95.6 | |||
Informal votes | 1,659 | 4.4 | |||
Turnout | 37,551 | 95.7 | |||
Country hold | Swing | +6.8 | |||
Party | Candidate | Votes | % | ±% | |
---|---|---|---|---|---|
Labor | Ted Theodore | 24,328 | 64.2 | +0.1 | |
Nationalist | Hedley Rogers | 7,704 | 20.3 | −15.6 | |
Independent Labor | Albert Gardiner | 5,888 | 15.5 | +15.5 | |
Total formal votes | 37,920 | 94.2 | |||
Informal votes | 2,319 | 5.8 | |||
Turnout | 40,239 | 95.7 | |||
Two-party-preferred result | |||||
Labor | Ted Theodore | 69.3 | +5.2 | ||
Nationalist | Hedley Rogers | 30.7 | −5.2 | ||
Labor hold | Swing | +5.2 | |||
Party | Candidate | Votes | % | ±% | |
---|---|---|---|---|---|
Labor | Arthur Blakeley | 24,056 | 70.9 | +5.4 | |
Nationalist | Frederick Drury | 9,862 | 29.1 | −5.4 | |
Total formal votes | 33,918 | 94.7 | |||
Informal votes | 1,881 | 5.3 | |||
Turnout | 35,799 | 86.9 | |||
Labor hold | Swing | +5.4 | |||
Party | Candidate | Votes | % | ±% | |
---|---|---|---|---|---|
Labor | John West | 19,651 | 58.4 | +4.6 | |
Nationalist | Julian Simpson | 13,994 | 41.6 | -4.6 | |
Total formal votes | 33,645 | 94.8 | |||
Informal votes | 1,852 | 5.2 | |||
Turnout | 35,497 | 87.9 | |||
Labor hold | Swing | +4.6 | |||
Party | Candidate | Votes | % | ±% | |
---|---|---|---|---|---|
Nationalist | John Perkins | 21,158 | 57.6 | -7.0 | |
Labor | John Cusack | 15,590 | 42.4 | +7.0 | |
Total formal votes | 36,748 | 94.5 | |||
Informal votes | 2,131 | 5.5 | |||
Turnout | 38,879 | 93.5 | |||
Nationalist hold | Swing | -7.0 | |||
Party | Candidate | Votes | % | ±% | |
---|---|---|---|---|---|
Country | Aubrey Abbott | 18,959 | 52.3 | +21.5 | |
Labor | Lou Cunningham | 17,266 | 47.7 | +2.2 | |
Total formal votes | 36,225 | 95.2 | |||
Informal votes | 1,811 | 4.8 | |||
Turnout | 38,036 | 92.1 | |||
Country hold | Swing | -0.8 | |||
Party | Candidate | Votes | % | ±% | |
---|---|---|---|---|---|
Labor | Parker Moloney | 20,852 | 52.7 | +2.3 | |
Country | William Fleming | 10,797 | 27.3 | +11.2 | |
Nationalist | Jack Garry | 7,906 | 20.0 | −13.5 | |
Total formal votes | 39,555 | 97.0 | |||
Informal votes | 1,235 | 3.0 | |||
Turnout | 40,790 | 93.8 | |||
Two-party-preferred result | |||||
Labor | Parker Moloney | 54.7 | +2.7 | ||
Country | William Fleming | 45.3 | −2.7 | ||
Labor hold | Swing | +2.7 | |||
Party | Candidate | Votes | % | ±% | |
---|---|---|---|---|---|
Labor | Rowley James | 28,331 | 62.2 | -9.1 | |
Nationalist | Ernest Carr | 9,145 | 20.1 | -8.6 | |
Independent Labor | Jim Brown | 8,073 | 17.7 | +17.7 | |
Total formal votes | 45,549 | 94.5 | |||
Informal votes | 2,640 | 5.5 | |||
Turnout | 48,189 | 95.5 | |||
Two-party-preferred result | |||||
Labor | Rowley James | 70.6 | -0.7 | ||
Nationalist | Ernest Carr | 39.4 | +0.7 | ||
Labor hold | Swing | -0.7 | |||
Party | Candidate | Votes | % | ±% | |
---|---|---|---|---|---|
Labor | William Long | 21,918 | 53.5 | +9.4 | |
Nationalist | Sir Elliot Johnson | 19,082 | 46.5 | -9.4 | |
Total formal votes | 41,000 | 94.7 | |||
Informal votes | 2,314 | 5.3 | |||
Turnout | 43,314 | 92.9 | |||
Labor gain from Nationalist | Swing | +9.4 | |||
Party | Candidate | Votes | % | ±% | |
---|---|---|---|---|---|
Labor | Ben Chifley | 20,155 | 54.9 | +6.2 | |
Nationalist | Arthur Manning | 16,577 | 45.1 | -6.2 | |
Total formal votes | 36,732 | 96.2 | |||
Informal votes | 1,439 | 3.8 | |||
Turnout | 38,171 | 94.5 | |||
Labor gain from Nationalist | Swing | +6.2 | |||
Party | Candidate | Votes | % | ±% | |
---|---|---|---|---|---|
Nationalist | Graham Pratten | 31,166 | 56.88 | -7.88 | |
Labor | Percy Hannett | 23,631 | 43.12 | +7.88 | |
Total formal votes | 54,797 | 95.46 | –2.57 | ||
Informal votes | 2,609 | 4.54 | +2.57 | ||
Turnout | 57,406 | 94.47 | +0.63 | ||
Nationalist hold | Swing | -7.88 | |||
Party | Candidate | Votes | % | ±% | |
---|---|---|---|---|---|
Country | Victor Thompson | unopposed | |||
Country hold | Swing | ||||
Party | Candidate | Votes | % | ±% | |
---|---|---|---|---|---|
Labor | David Watkins | 26,952 | 57.1 | -5.4 | |
Protestant Labor | Walter Skelton | 20,212 | 42.9 | +42.9 | |
Total formal votes | 47,164 | 95.9 | |||
Informal votes | 2,028 | 4.1 | |||
Turnout | 49,192 | 94.3 | |||
Labor hold | Swing | -5.4 | |||
Party | Candidate | Votes | % | ±% | |
---|---|---|---|---|---|
Nationalist | Billy Hughes | 32,734 | 66.2 | -5.3 | |
Labor | Ben Howe | 16,736 | 33.8 | +5.3 | |
Total formal votes | 49,470 | 94.8 | |||
Informal votes | 2,718 | 5.2 | |||
Turnout | 52,188 | 94.6 | |||
Nationalist hold | Swing | -5.3 | |||
Party | Candidate | Votes | % | ±% | |
---|---|---|---|---|---|
Nationalist | Charles Marr | 28,798 | 57.4 | -5.4 | |
Labor | George Sherringham | 21,343 | 42.6 | +5.4 | |
Total formal votes | 50,141 | 93.6 | |||
Informal votes | 2,627 | 6.4 | |||
Turnout | 52,768 | 93.5 | |||
Nationalist hold | Swing | -5.4 | |||
Party | Candidate | Votes | % | ±% | |
---|---|---|---|---|---|
Nationalist | Eric Bowden | 30,867 | 60.1 | -5.6 | |
Labor | Albert Rowe | 20,492 | 39.9 | +5.6 | |
Total formal votes | 51,359 | 94.8 | |||
Informal votes | 2,798 | 5.2 | |||
Turnout | 54,157 | 93.8 | |||
Nationalist hold | Swing | -5.6 | |||
Party | Candidate | Votes | % | ±% | |
---|---|---|---|---|---|
Labor | Percy Coleman | 40,495 | 66.1 | +11.4 | |
Nationalist | George Tomlinson | 20,761 | 33.9 | -11.4 | |
Total formal votes | 61,256 | 95.1 | |||
Informal votes | 3,186 | 4.9 | |||
Turnout | 64,442 | 94.4 | |||
Labor hold | Swing | +11.4 | |||
Party | Candidate | Votes | % | ±% | |
---|---|---|---|---|---|
Country | Roland Green | unopposed | |||
Country hold | Swing | ||||
Party | Candidate | Votes | % | ±% | |
---|---|---|---|---|---|
Country | William Killen | 22,377 | 57.5 | +3.2 | |
Labor | Joseph Casserly | 16,538 | 42.5 | -3.2 | |
Total formal votes | 38,915 | 94.8 | |||
Informal votes | 2,143 | 5.2 | |||
Turnout | 41,058 | 90.4 | |||
Country hold | Swing | +3.2 | |||
Party | Candidate | Votes | % | ±% | |
---|---|---|---|---|---|
Nationalist | Sydney Gardner | unopposed | |||
Nationalist hold | Swing | ||||
Party | Candidate | Votes | % | ±% | |
---|---|---|---|---|---|
Labor | Edward Riley | 25,915 | 54.2 | +3.1 | |
Nationalist | George Baker | 21,874 | 45.8 | -3.1 | |
Total formal votes | 47,789 | 95.4 | |||
Informal votes | 2,297 | 4.6 | |||
Turnout | 50,086 | 89.9 | |||
Labor hold | Swing | +3.1 | |||
Party | Candidate | Votes | % | ±% | |
---|---|---|---|---|---|
Nationalist | Archdale Parkhill | unopposed | |||
Nationalist hold | Swing | ||||
Party | Candidate | Votes | % | ±% | |
---|---|---|---|---|---|
Nationalist | Walter Marks | 29,639 | 61.5 | -2.9 | |
Labor | Bob O'Halloran | 18,539 | 38.5 | +2.9 | |
Total formal votes | 48,178 | 95.7 | |||
Informal votes | 2,161 | 4.3 | |||
Turnout | 50,339 | 89.7 | |||
Nationalist hold | Swing | -2.9 | |||
Party | Candidate | Votes | % | ±% | |
---|---|---|---|---|---|
Labor | Bert Lazzarini | 24,842 | 61.7 | +8.0 | |
Nationalist | Herbert Ogilvie | 15,407 | 38.3 | −8.0 | |
Total formal votes | 40,249 | 95.5 | |||
Informal votes | 1,900 | 4.5 | |||
Turnout | 42,149 | 93.1 | |||
Labor hold | Swing | +8.0 | |||
Party | Candidate | Votes | % | ±% | |
---|---|---|---|---|---|
Labor | Jack Beasley | 25,286 | 81.7 | +7.7 | |
Nationalist | Alfred Benjamin | 5,649 | 18.3 | -7.7 | |
Total formal votes | 30,935 | 94.1 | |||
Informal votes | 1,930 | 5.9 | |||
Turnout | 32,865 | 91.4 | |||
Labor hold | Swing | +7.7 | |||
Party | Candidate | Votes | % | ±% | |
---|---|---|---|---|---|
Nationalist | William Watt | 31,977 | 63.2 | −6.5 | |
Ind. Nationalist | Edward Price | 18,651 | 36.8 | +36.8 | |
Total formal votes | 50,628 | 94.7 | |||
Informal votes | 2,850 | 5.3 | |||
Turnout | 53,478 | 95.1 | |||
Nationalist hold | Swing | −6.5 | |||
Party | Candidate | Votes | % | ±% | |
---|---|---|---|---|---|
Labor | Charles McGrath | 19,528 | 52.6 | +1.3 | |
Nationalist | Matthew Baird | 17,616 | 47.4 | −1.3 | |
Total formal votes | 37,144 | 98.2 | |||
Informal votes | 682 | 1.8 | |||
Turnout | 37,826 | 97.1 | |||
Labor hold | Swing | +1.3 | |||
Party | Candidate | Votes | % | ±% | |
---|---|---|---|---|---|
Labor | Frank Brennan | 37,947 | 63.8 | +4.8 | |
Nationalist | Angus McDonald | 21,512 | 36.2 | -4.8 | |
Total formal votes | 59,459 | 96.5 | |||
Informal votes | 2,170 | 3.5 | |||
Turnout | 61,629 | 91.8 | |||
Labor hold | Swing | +4.8 | |||
Party | Candidate | Votes | % | ±% | |
---|---|---|---|---|---|
Labor | James McDonald | 15,849 | 42.4 | −4.1 | |
Nationalist | Geoffry Hurry | 14,074 | 37.6 | −15.9 | |
Country | Cyril James | 7,489 | 20.0 | +20.0 | |
Total formal votes | 37,412 | 97.8 | |||
Informal votes | 855 | 2.2 | |||
Turnout | 38,267 | 95.7 | |||
Two-party-preferred result | |||||
Nationalist | Geoffry Hurry | 19,882 | 53.1 | −0.4 | |
Labor | James McDonald | 17,530 | 46.9 | +0.4 | |
Nationalist hold | Swing | −0.4 | |||
Party | Candidate | Votes | % | ±% | |
---|---|---|---|---|---|
Labor | Frank Anstey | 36,835 | 68.7 | +6.2 | |
Nationalist | Leonard Smith | 16,797 | 31.3 | −6.2 | |
Total formal votes | 53,632 | 95.9 | |||
Informal votes | 2,276 | 4.1 | |||
Turnout | 55,908 | 95.5 | |||
Labor hold | Swing | +6.2 | |||
Party | Candidate | Votes | % | ±% | |
---|---|---|---|---|---|
Country | William Gibson | 20,501 | 53.0 | −2.5 | |
Labor | Richard Crouch | 18,211 | 47.0 | +2.5 | |
Total formal votes | 38,712 | 97.6 | |||
Informal votes | 959 | 2.4 | |||
Turnout | 39,671 | 95.4 | |||
Country hold | Swing | −2.5 | |||
Party | Candidate | Votes | % | ±% | |
---|---|---|---|---|---|
Nationalist | John Lister | 27,497 | 58.5 | +1.8 | |
Labor | Peter Randles | 19,500 | 41.5 | −1.8 | |
Total formal votes | 46,997 | 97.5 | |||
Informal votes | 1,223 | 2.5 | |||
Turnout | 48,220 | 93.8 | |||
Nationalist hold | Swing | +1.8 | |||
Party | Candidate | Votes | % | ±% | |
---|---|---|---|---|---|
Country | William Hill | 23,265 | 60.0 | -5.3 | |
Country Progressive | Frederick Churches | 15,486 | 40.0 | +40.0 | |
Total formal votes | 38,751 | 96.8 | |||
Informal votes | 1,263 | 3.2 | |||
Turnout | 40,014 | 94.4 | |||
Country hold | Swing | -5.3 | |||
Party | Candidate | Votes | % | ±% | |
---|---|---|---|---|---|
Nationalist | George Maxwell | 25,388 | 61.7 | +2.3 | |
Labor | Nicholas Roberts | 15,731 | 38.3 | -2.3 | |
Total formal votes | 41,119 | 96.8 | |||
Informal votes | 1,356 | 3.2 | |||
Turnout | 42,475 | 92.1 | |||
Nationalist hold | Swing | +2.3 | |||
Party | Candidate | Votes | % | ±% | |
---|---|---|---|---|---|
Nationalist | Stanley Bruce | 34,823 | 59.4 | -3.3 | |
Labor | Jack Holloway | 22,372 | 38.2 | +0.9 | |
Ind. Nationalist | Clarence Robertson | 1,447 | 2.5 | +2.5 | |
Total formal votes | 58,642 | 96.6 | |||
Informal votes | 2,073 | 3.4 | |||
Turnout | 60,715 | 95.0 | |||
Two-party-preferred result | |||||
Nationalist | Stanley Bruce | 60.7 | -1.9 | ||
Labor | Jack Holloway | 39.3 | +1.9 | ||
Nationalist hold | Swing | -1.9 | |||
Party | Candidate | Votes | % | ±% | |
---|---|---|---|---|---|
Country | Thomas Paterson | 24,100 | 57.7 | +13.1 | |
Independent Liberal | George Wise | 17,643 | 42.3 | +19.5 | |
Total formal votes | 41,743 | 97.4 | |||
Informal votes | 1,101 | 2.6 | |||
Turnout | 42,844 | 95.4 | |||
Country hold | Swing | -5.4 | |||
Party | Candidate | Votes | % | ±% | |
---|---|---|---|---|---|
Nationalist | Henry Gullett | 45,489 | 66.6 | +15.1 | |
Labor | Edward Stewart | 22,839 | 33.4 | +3.7 | |
Total formal votes | 68,328 | 96.8 | |||
Informal votes | 2,249 | 3.2 | |||
Turnout | 70,577 | 94.4 | |||
Nationalist hold | Swing | +5.7 | |||
Party | Candidate | Votes | % | ±% | |
---|---|---|---|---|---|
Labor | Paul Jones | unopposed | |||
Labor gain from Country | Swing | ||||
Party | Candidate | Votes | % | ±% | |
---|---|---|---|---|---|
Nationalist | John Latham | 39,988 | 66.5 | −1.2 | |
Labor | Joseph Hannan | 20,124 | 33.5 | +1.2 | |
Total formal votes | 60,112 | 97.1 | |||
Informal votes | 1,773 | 2.9 | |||
Turnout | 61,885 | 95.5 | |||
Nationalist hold | Swing | −1.2 | |||
Party | Candidate | Votes | % | ±% | |
---|---|---|---|---|---|
Labor | James Fenton | 31,022 | 59.9 | +0.4 | |
Nationalist | Arthur Fenton | 20,765 | 40.1 | -0.4 | |
Total formal votes | 51,787 | 97.0 | |||
Informal votes | 1,614 | 3.0 | |||
Turnout | 53,401 | 97.6 | |||
Labor hold | Swing | +0.4 | |||
Party | Candidate | Votes | % | ±% | |
---|---|---|---|---|---|
Labor | William Maloney | 27,532 | 74.4 | +7.4 | |
Nationalist | Norman O'Brien | 9,457 | 25.6 | -7.4 | |
Total formal votes | 36,989 | 95.7 | |||
Informal votes | 1,667 | 4.3 | |||
Turnout | 38,656 | 96.5 | |||
Labor hold | Swing | +7.4 | |||
Party | Candidate | Votes | % | ±% | |
---|---|---|---|---|---|
Labor | James Mathews | unopposed | |||
Labor hold | Swing | ||||
Party | Candidate | Votes | % | ±% | |
---|---|---|---|---|---|
Nationalist | Arthur Rodgers | 21,016 | 52.8 | +10.3 | |
Labor | John McNeill | 18,807 | 47.2 | +4.9 | |
Total formal votes | 39,823 | 98.2 | |||
Informal votes | 742 | 1.8 | |||
Turnout | 40,565 | 95.7 | |||
Nationalist hold | Swing | -1.2 | |||
Party | Candidate | Votes | % | ±% | |
---|---|---|---|---|---|
Country Progressive | Percy Stewart | 26,227 | 58.4 | -30.6 | |
Country | John Harris | 18,716 | 41.6 | +41.6 | |
Total formal votes | 44,943 | 97.6 | |||
Informal votes | 1,090 | 2.4 | |||
Turnout | 46,033 | 92.5 | |||
Country Progressive gain from Independent Country | Swing | -30.6 | |||
Party | Candidate | Votes | % | ±% | |
---|---|---|---|---|---|
Labor | James Scullin | 28,495 | 74.8 | +0.0 | |
Nationalist | Cecil Keeley | 9,618 | 25.2 | +0.0 | |
Total formal votes | 38,113 | 94.7 | |||
Informal votes | 2,115 | 5.3 | |||
Turnout | 40,228 | 93.6 | |||
Labor hold | Swing | +0.0 | |||
Party | Candidate | Votes | % | ±% | |
---|---|---|---|---|---|
Nationalist | Donald Cameron | 21,563 | 56.7 | +1.6 | |
Labor | Frank Burke | 16,500 | 43.3 | −0.8 | |
Total formal votes | 38,063 | 93.6 | |||
Informal votes | 2,592 | 6.4 | |||
Turnout | 40,655 | 92.6 | |||
Nationalist hold | Swing | +1.2 | |||
Party | Candidate | Votes | % | ±% | |
---|---|---|---|---|---|
Labor | Frank Forde | 23,376 | 52.5 | +0.6 | |
Country | Robert Staines | 21,114 | 47.5 | −0.6 | |
Total formal votes | 44,490 | 96.3 | |||
Informal votes | 1,728 | 3.7 | |||
Turnout | 46,218 | 93.8 | |||
Labor hold | Swing | +0.6 | |||
Party | Candidate | Votes | % | ±% | |
---|---|---|---|---|---|
Nationalist | Sir Littleton Groom | unopposed | |||
Nationalist hold | Swing | ||||
Party | Candidate | Votes | % | ±% | |
---|---|---|---|---|---|
Labor | George Martens | 25,462 | 50.2 | +0.5 | |
Nationalist | Lewis Nott | 25,308 | 49.8 | -0.5 | |
Total formal votes | 50,770 | 93.9 | |||
Informal votes | 3,312 | 6.1 | |||
Turnout | 54,082 | 93.5 | |||
Labor gain from Nationalist | Swing | +0.5 | |||
Party | Candidate | Votes | % | ±% | |
---|---|---|---|---|---|
Nationalist | Grosvenor Francis | 14,336 | 52.4 | -47.6 | |
Labor | Jim Riordan | 13,041 | 47.6 | +47.6 | |
Total formal votes | 27,377 | 94.7 | |||
Informal votes | 1,527 | 5.3 | |||
Turnout | 28,904 | 88.5 | |||
Nationalist hold | Swing | -47.6 | |||
Party | Candidate | Votes | % | ±% | |
---|---|---|---|---|---|
Nationalist | George Mackay | unopposed | |||
Nationalist hold | Swing | ||||
Party | Candidate | Votes | % | ±% | |
---|---|---|---|---|---|
Country | James Hunter | 16,837 | 58.3 | +5.7 | |
Labor | Jack Reid | 12,024 | 41.7 | -5.7 | |
Total formal votes | 28,861 | 95.7 | |||
Informal votes | 1,289 | 4.3 | |||
Turnout | 30,150 | 90.6 | |||
Country hold | Swing | +5.7 | |||
Party | Candidate | Votes | % | ±% | |
---|---|---|---|---|---|
Nationalist | Josiah Francis | unopposed | |||
Nationalist hold | Swing | ||||
Party | Candidate | Votes | % | ±% | |
---|---|---|---|---|---|
Nationalist | James Bayley | 26,223 | 53.7 | -2.0 | |
Labor | Francis Baker | 22,579 | 46.3 | +2.0 | |
Total formal votes | 48,802 | 93.5 | |||
Informal votes | 3,376 | 6.5 | |||
Turnout | 52,178 | 93.8 | |||
Nationalist hold | Swing | -2.0 | |||
Party | Candidate | Votes | % | ±% | |
---|---|---|---|---|---|
Country | Bernard Corser | unopposed | |||
Country hold | Swing | ||||
Party | Candidate | Votes | % | ±% | |
---|---|---|---|---|---|
Labor | George Edwin Yates | 20,410 | 55.9 | +5.0 | |
Nationalist | George McLeay | 16,114 | 44.1 | −5.0 | |
Total formal votes | 36,524 | 89.9 | |||
Informal votes | 4,099 | 10.1 | |||
Turnout | 40,623 | 92.1 | |||
Labor hold | Swing | +5.0 | |||
Party | Candidate | Votes | % | ±% | |
---|---|---|---|---|---|
Nationalist | Walter Parsons | 25,372 | 59.4 | +9.1 | |
Labor | Michael Woods | 17,325 | 40.6 | −9.1 | |
Total formal votes | 42,697 | 90.1 | |||
Informal votes | 4,689 | 9.9 | |||
Turnout | 47,386 | 95.3 | |||
Nationalist hold | Swing | +9.1 | |||
Party | Candidate | Votes | % | ±% | |
---|---|---|---|---|---|
Nationalist | Malcolm Cameron | 21,883 | 52.6 | −9.0 | |
Country | Ronald Hunt | 19,699 | 47.4 | +47.4 | |
Total formal votes | 41,582 | 90.2 | |||
Informal votes | 4,523 | 9.8 | |||
Turnout | 46,105 | 95.4 | |||
Nationalist hold | Swing | −9.0 | |||
Party | Candidate | Votes | % | ±% | |
---|---|---|---|---|---|
Labor | John Price | 20,666 | 50.1 | +7.7 | |
Nationalist | Jack Duncan-Hughes | 20,582 | 49.9 | −7.7 | |
Total formal votes | 41,248 | 91.4 | |||
Informal votes | 3,886 | 8.6 | |||
Turnout | 45,134 | 93.8 | |||
Labor gain from Nationalist | Swing | +7.7 | |||
Party | Candidate | Votes | % | ±% | |
---|---|---|---|---|---|
Labor | Andrew Lacey | 17,904 | 55.8 | +3.2 | |
Nationalist | William Blight | 14,174 | 44.2 | -3.2 | |
Total formal votes | 32,078 | 91.9 | |||
Informal votes | 2,839 | 8.1 | |||
Turnout | 34,917 | 92.0 | |||
Labor hold | Swing | +3.2 | |||
Party | Candidate | Votes | % | ±% | |
---|---|---|---|---|---|
Labor | Norman Makin | 33,241 | 70.6 | +5.4 | |
Nationalist | Henry Dunks | 8,748 | 18.6 | -16.2 | |
Independent | Ross Graham | 5,081 | 10.8 | +10.8 | |
Total formal votes | 47,070 | 91.1 | |||
Informal votes | 4,626 | 8.9 | |||
Turnout | 51,696 | 94.7 | |||
Two-party-preferred result | |||||
Labor | Norman Makin | 73.3 | +8.1 | ||
Nationalist | Henry Dunks | 26.7 | -8.1 | ||
Labor hold | Swing | +8.1 | |||
Party | Candidate | Votes | % | ±% | |
---|---|---|---|---|---|
Country | Maurice Collins | 18,813 | 59.6 | +59.6 | |
Nationalist | Richard Foster | 12,755 | 40.4 | -24.4 | |
Total formal votes | 31,568 | 89.4 | |||
Informal votes | 3,750 | 10.6 | |||
Turnout | 35,318 | 96.1 | |||
Country gain from Nationalist | Swing | +24.4 | |||
Party | Candidate | Votes | % | ±% | |
---|---|---|---|---|---|
Country | John Prowse | 21,463 | 60.4 | -0.5 | |
Labor | Cornelius Buckley | 14,049 | 39.6 | +0.5 | |
Total formal votes | 35,512 | 96.4 | |||
Informal votes | 1,309 | 3.6 | |||
Turnout | 36,821 | 90.3 | |||
Country hold | Swing | -0.5 | |||
Party | Candidate | Votes | % | ±% | |
---|---|---|---|---|---|
Labor | John Curtin | 19,433 | 49.2 | +7.3 | |
Nationalist | Frank Gibson | 11,402 | 28.8 | +28.8 | |
Independent | Keith Watson | 8,697 | 22.0 | +22.0 | |
Total formal votes | 39,532 | 96.9 | |||
Informal votes | 1,253 | 3.1 | |||
Turnout | 40,785 | 93.0 | |||
Two-party-preferred result | |||||
Labor | John Curtin | 20,589 | 52.1 | +10.2 | |
Nationalist | Frank Gibson | 18,943 | 47.9 | +47.9 | |
Labor gain from Independent | Swing | +10.2 | |||
Party | Candidate | Votes | % | ±% | |
---|---|---|---|---|---|
Labor | Albert Green | unopposed | |||
Labor hold | Swing | ||||
Party | Candidate | Votes | % | ±% | |
---|---|---|---|---|---|
Nationalist | Edward Mann | 22,002 | 61.8 | -1.0 | |
Labor | Arthur Watts | 12,082 | 34.0 | -3.2 | |
Independent | John McCoo | 1,499 | 4.2 | +4.2 | |
Total formal votes | 35,583 | 95.2 | |||
Informal votes | 1,803 | 4.8 | |||
Turnout | 37,386 | 91.8 | |||
Two-party-preferred result | |||||
Nationalist | Edward Mann | 64.9 | +2.1 | ||
Labor | Arthur Watts | 35.1 | -2.1 | ||
Nationalist hold | Swing | +2.1 | |||
Party | Candidate | Votes | % | ±% | |
---|---|---|---|---|---|
Country | Henry Gregory | unopposed | |||
Country hold | Swing | ||||
Party | Candidate | Votes | % | ±% | |
---|---|---|---|---|---|
Labor | Thomas Wilson | 8,621 | 42.6 | −0.4 | |
Nationalist | Syd Jackson | 5,991 | 29.6 | +0.3 | |
Nationalist | William Judd | 5,606 | 27.7 | +27.7 | |
Total formal votes | 20,218 | 95.0 | |||
Informal votes | 1,067 | 5.0 | |||
Turnout | 21,285 | 92.5 | |||
Two-party-preferred result | |||||
Nationalist | Syd Jackson | 10,736 | 53.1 | −5.2 | |
Labor | Thomas Wilson | 9,482 | 46.9 | +5.2 | |
Nationalist hold | Swing | −5.2 | |||
Party | Candidate | Votes | % | ±% | |
---|---|---|---|---|---|
Nationalist | George Bell | 14,880 | 71.9 | +9.4 | |
Independent | James Campbell | 5,813 | 28.1 | +28.1 | |
Total formal votes | 20,693 | 93.7 | |||
Informal votes | 1,385 | 6.3 | |||
Turnout | 22,078 | 94.0 | |||
Nationalist hold | Swing | +10.6 | |||
Party | Candidate | Votes | % | ±% | |
---|---|---|---|---|---|
Nationalist | Sir John Gellibrand | 9,486 | 47.6 | -4.6 | |
Labor | Charles Culley | 7,824 | 39.3 | +4.6 | |
Labor | Thomas Jude | 2,618 | 13.1 | +13.1 | |
Total formal votes | 19,928 | 94.4 | |||
Informal votes | 1,171 | 5.6 | |||
Turnout | 21,099 | 92.5 | |||
Two-party-preferred result | |||||
Labor | Charles Culley | 10,028 | 50.3 | +2.5 | |
Nationalist | Sir John Gellibrand | 9,900 | 49.7 | -2.5 | |
Labor gain from Nationalist | Swing | +2.5 | |||
Party | Candidate | Votes | % | ±% | |
---|---|---|---|---|---|
Nationalist | Alfred Seabrook | 9,173 | 44.8 | -6.3 | |
Independent | William McWilliams | 9,121 | 44.5 | +44.5 | |
Nationalist | Francis Foster | 2,195 | 10.7 | +10.7 | |
Total formal votes | 20,489 | 93.7 | |||
Informal votes | 1,380 | 6.3 | |||
Turnout | 21,869 | 91.7 | |||
Two-party-preferred result | |||||
Independent | William McWilliams | 10,567 | 51.6 | +51.6 | |
Nationalist | Alfred Seabrook | 9,922 | 48.4 | -7.2 | |
Independent gain from Nationalist | Swing | +7.2 | |||
Party | Candidate | Votes | % | ±% | |
---|---|---|---|---|---|
Nationalist | Llewellyn Atkinson | 7,791 | 43.3 | -0.1 | |
Independent | George Flowers | 6,534 | 36.3 | +36.3 | |
Nationalist | Hector McFie | 3,658 | 20.3 | +20.3 | |
Total formal votes | 17,983 | 90.7 | |||
Informal votes | 1,839 | 9.3 | |||
Turnout | 19,822 | 92.8 | |||
Two-party-preferred result | |||||
Nationalist | Llewellyn Atkinson | 9,814 | 54.6 | -2.4 | |
Independent | George Flowers | 8,169 | 45.4 | +2.4 | |
Nationalist gain from Country | Swing | -2.4 | |||
Party | Candidate | Votes | % | ±% | |
---|---|---|---|---|---|
Labor | Harold Nelson | 902 | 68.1 | +5.7 | |
Independent | Douglas Watts | 250 | 18.9 | +18.9 | |
Independent Labor | Arthur Love | 173 | 13.1 | +13.1 | |
Total formal votes | 1,325 | 96.7 | |||
Informal votes | 45 | 3.3 | |||
Turnout | 1,370 | 65.3 | |||
Two-party-preferred result | |||||
Labor | Harold Nelson | 75.2 | +12.8 | ||
Independent | Douglas Watts | 24.8 | +24.8 | ||
Labor hold | Swing | +12.8 | |||
The Protectionist Party, also known as the Protectionist Liberal Party or Liberal Protectionist Party, was an Australian political party, formally organised from 1887 until 1909, with policies centred on protectionism. The party advocated protective tariffs, arguing it would allow Australian industry to grow and provide employment. It had its greatest strength in Victoria and in the rural areas of New South Wales. Its most prominent leaders were Sir Edmund Barton and Alfred Deakin, who were the first and second prime ministers of Australia.
The Australian Electoral Commission (AEC) is the independent statutory authority and agency of the Australian Government responsible for the management of federal Australian elections, by-elections and referendums.
The Constitution Alteration 1928, was an amendment to the Australian Constitution approved by referendum on 17 November 1928. It concerned financial relations between the federal level of government and the Australian states. It became law on 13 February 1929.
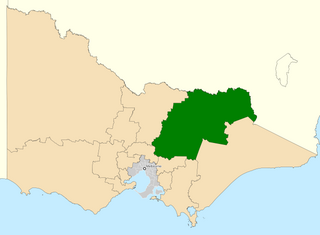
The Division of Indi ( "IN-dye") is an Australian electoral division in the state of Victoria. The division is located in the north-east of the state, adjoining the border with New South Wales. The largest settlements in the division are the regional cities of Wodonga, Wangaratta, and Benalla. Other towns in the electorate include Rutherglen, Mansfield, Beechworth, Myrtleford, Bright, Alexandra, Tallangatta, Corryong and a number of other small villages. While Indi is one of the largest electorates in Victoria, much of it is located within the largely uninhabited Australian Alps. While Wodonga serves as a regional hub for much of the more heavily populated northern part of the electorate, the southern part is closer to Melbourne than Wodonga.
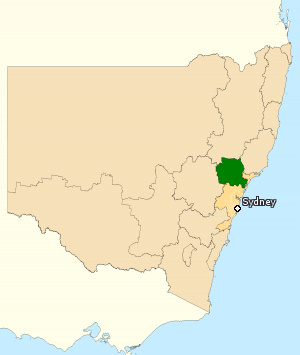
The Division of Hunter is an Australian electoral division in the state of New South Wales. The division was proclaimed in 1900, and was one of the original 65 divisions to be contested at the first federal election. The division was named after Captain John Hunter, the second Governor of New South Wales. It covers rural, regional and suburban areas centred on the Hunter Valley, including the towns of Singleton, Muswellbrook and Cessnock. It also extends into parts of Greater Newcastle, covering suburbs such as Cameron Park, Edgeworth, Toronto and Morisset.
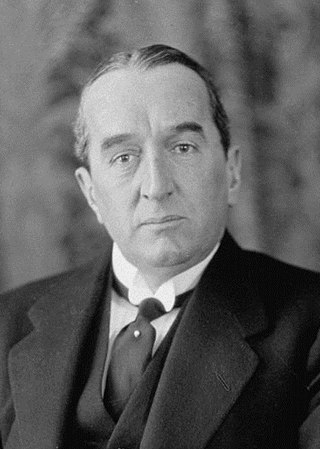
The 1928 Australian federal election was held in Australia on 17 November 1928. All 75 seats in the House of Representatives and 19 of the 36 seats in the Senate were up for election. The incumbent Nationalist–Country coalition, led by Prime Minister Stanley Bruce won a record fifth consecutive election defeating the opposition Labor Party led by James Scullin.
The 1925 Australian federal election was held in Australia on 14 November 1925. All 75 seats in the House of Representatives and 22 of the 36 seats in the Senate were up for election. The incumbent Nationalist–Country coalition, led by Prime Minister Stanley Bruce, defeated the opposition Labor Party led by Matthew Charlton in a landslide. This was the first time any party had won a fourth consecutive federal election.
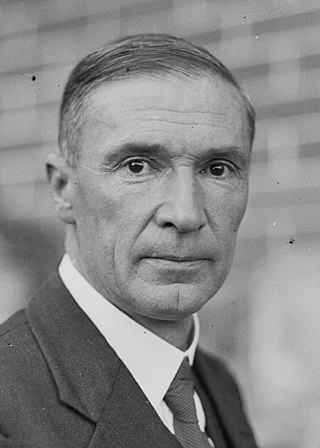
Thomas Paterson was an Australian politician who served as deputy leader of the Country Party from 1929 to 1937. He held ministerial office in the governments of Stanley Bruce and Joseph Lyons, representing the Division of Gippsland in Victoria from 1922 to 1943. He played a leading role in the creation of the Victorian Country Party as the political arm of the Victorian Farmers' Union.
The 1928 Tasmanian state election was held on Wednesday, 30 May 1928 in the Australian state of Tasmania to elect 30 members of the Tasmanian House of Assembly. The election used the Hare-Clark proportional representation system — six members were elected from each of five electorates.
The 1931 Tasmanian state election was held on 9 May 1931 in the Australian state of Tasmania to elect 30 members of the Tasmanian House of Assembly. The election used the Hare-Clark proportional representation system — six members were elected from each of five electorates. For the first time, voting was compulsory, resulting in a high voter turnout.
This is a list of members of the Western Australian Legislative Assembly between the 1927 election and the 1930 election, together known as the 13th Parliament.
This is a list of members of the Tasmanian House of Assembly between the 30 May 1928 election and the 9 May 1931 election. The 1928 election failed to deliver a majority, and the Nationalists' John McPhee took over from Labor's Joseph Lyons as Premier of Tasmania. Lyons subsequently retired from state politics, obtaining election to the Federal seat of Wilmot and going on to become Prime Minister of Australia in 1931.
This is a list of members of the 24th Legislative Assembly of Queensland from 1926 to 1929, as elected at the 1926 state election held on 8 May 1926.
This is a list of electoral results for the Division of Warringah in Australian federal elections from the division's creation in 1922 until the present.
This is a list of electoral results for the Division of Dalley in Australian federal elections from the division's creation in 1901 until its abolition in 1969.
This is a list of electoral results for the Division of Balaclava in Australian federal elections from the division's creation in 1901 until its abolition in 1984.
This is a list of electoral results for the district of Bendigo East in Victorian state elections.
The Territory Labor Party, officially known as the Australian Labor Party (Northern Territory Branch) and commonly referred to simply as Territory Labor, is the Northern Territory branch of the Australian Labor Party. It is the current ruling party in the Northern Territory and is led by Natasha Fyles, who has concurrently served as chief minister of the Northern Territory since 2022, and previously Michael Gunner from 2016 to 2022.
This is a list of electoral division results for the Australian 1925 federal election.