Texas's 27th congressional district

Last updated

Texas's 27th congressional district
Texas US Congressional District 27 (since 2021).tif
Texas's 27th congressional district
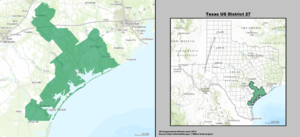
Interactive map of district boundaries since January 3, 2023
Representative
Distribution
  • 74.99% urban [1]
  • 25.01% rural
Population (2023)779,431 [2]
Median household
income
$64,983 [3]
Ethnicity
Cook PVI R+13 [4]

Texas's 27th congressional district of the United States House of Representatives covers the coastal bend of Texas' Gulf Coast consisting of Corpus Christi and Victoria up to Bastrop County near Austin. Its current representative is Republican Michael Cloud. Cloud was elected to the district in a special election on June 30, 2018, to replace former Republican representative Blake Farenthold, who had resigned on April 6. [5] [6]

Contents

The 27th district was created as a result of the redistricting cycle after the 1980 census.

The district is slightly less than 50% Hispanic, down from the 70% Hispanic population in the 2002–2010 cycles when the district reached from Corpus Christi to Brownsville. [7]

In August 2017, a panel of federal judges ruled that the 27th district is unconstitutional, arguing that it displaces a Hispanic-opportunity district. [8] However, the United States Supreme Court later reversed the ruling, pronouncing the district constitutional in Abbott v. Perez .

Recent election results from statewide races

YearOfficeResults [9] [10]
2008 President McCain 58% - 41%
2012 President Romney 60% - 40%
2014 Senate Cornyn 68% - 32%
Governor Abbott 64% - 36%
2016 President Trump 59% - 37%
2018 Senate Cruz 60% - 40%
Governor Abbott 65% - 34%
Lt. Governor Patrick 59% - 39%
Attorney General Paxton 58% - 39%
2020 President Trump 61% - 38%
Senate Cornyn 61% - 37%
2022 Governor Abbott 64% - 35%
Lt. Governor Patrick 63% - 34%
Attorney General Paxton 62% - 35%
Comptroller of Public Accounts Hegar 64% - 33%
2024 President Trump 64% - 35%
Senate Cruz 61% - 37%

Composition

For the 118th and successive Congresses (based on redistricting following the 2020 census), the district contains all or portions of the following counties and communities: [11]

AransasCounty (6)

All 6 communities

BastropCounty (7)

Bastrop (part; also 10th), Cedar Creek, Mustang Ridge (shared with Caldwell and Travis counties), Red Rock, Rosanky, Smithville (part; also 10th), Wyldwood

BeeCounty (9)

All 9 communities

CaldwellCounty (7)

All 7 communities

CalhounCounty (6)

All 6 communities

DeWittCounty (4)

All 4 communities

GoliadCounty (1)

Goliad

GonzalesCounty (4)

All 4 communities

JacksonCounty (5)

All 5 communities

LavacaCounty (4)

All 4 communities

NuecesCounty (18)

All 18 communities

RefugioCounty (5)

All 5 communities

San PatricioCounty (26)

All 26 communities

VictoriaCounty (5)

All 5 communities

List of members representing the district

MemberPartyYearsCong
ress
Electoral historyDistrict location
District established January 3, 1983
SolomonOrtiz.jpg
Solomon P. Ortiz
(Corpus Christi)
Democratic January 3, 1983 –
January 3, 2011
98th
99th
100th
101st
102nd
103rd
104th
105th
106th
107th
108th
109th
110th
111th
Elected in 1982.
Re-elected in 1984.
Re-elected in 1986.
Re-elected in 1988.
Re-elected in 1990.
Re-elected in 1992.
Re-elected in 1994.
Re-elected in 1996.
Re-elected in 1998.
Re-elected in 2000.
Re-elected in 2002.
Re-elected in 2004.
Re-elected in 2006.
Re-elected in 2008.
Lost re-election.
1983–1985
[ data missing ]
1985–1993
[ data missing ]
1993–2003
Cameron, Kenedy, and Nueces; parts of Kleberg and Willacy
2003–2005
Cameron, Kenedy, and Willacy; parts of Kleberg and Nueces
2005–2013
TX27 109.gif
Kenedy, Kleberg, Nueces, and Willacy; parts of Cameron and San Patricio
Blake Farenthold, Official Portrait, 115th Congress.jpg
Blake Farenthold
(Corpus Christi)
Republican January 3, 2011 –
April 6, 2018
112th
113th
114th
115th
Elected in 2010.
Re-elected in 2012.
Re-elected in 2014.
Re-elected in 2016.
Resigned.
2013–2023
Texas US Congressional District 27 (since 2013).tif
Aransas, Calhoun, Jackson, Lavaca, Matagorda, Nueces, Refugio, Victoria, and Wharton; parts of Bastrop, Caldwell, Gonzales, and San Patricio [12]
VacantApril 6, 2018 –
June 30, 2018
115th
Michael Cloud, Official Portrait, 115th Congress.jpg
Michael Cloud
(Victoria)
Republican June 30, 2018 –
present
115th
116th
117th
118th
119th
Elected to finish Farenthold's term.
Re-elected in 2018.
Re-elected in 2020.
Re-elected in 2022.
Re-elected in 2024.
2023–present
Texas US Congressional District 27 (since 2021).tif
Aransas, Bastrop (part), Bee, Caldwell, Calhoun, De Witt, Goliad, Gonzales, Jackson, Lavaca, Nueces, Refugio, San Patricio, and Victoria [13]

Recent election results

US House election, 2004: Texas District 27
PartyCandidateVotes%±%
Democratic Solomon Ortiz (incumbent)112,08163.1+2.0
Republican William Vaden61,95534.9−1.7
Libertarian Christopher Claytor3,5002.0−0.4
Majority60,12633.9
Turnout 177,536
Democratic hold Swing +1.8
US House election, 2010: Texas District 27
PartyCandidateVotes%±%
Republican Blake Farenthold 50,95447.85+12.95
Democratic Solomon Ortiz (incumbent)50,15547.10−16.0
Majority7990.75
Turnout 101,109
Republican gain from Democratic Swing 28.95
US House election, 2012: Texas District 27 [14]
PartyCandidateVotes%±%
Republican Blake Farenthold (incumbent)120,68456.75+8.9
Democratic Rose Meza Harrison 83,39539.21−7.89
Independent Bret Baldwin5,3542.51+2.51
Libertarian Corrie Byrd3,2181.51+1.51
Turnout 212,651
US House election, 2014: Texas District 27 [15]
PartyCandidateVotes%±%
Republican Blake Farenthold (incumbent)83,34263.60+6.85
Democratic Wesley Reed44,15233.69−5.52
Libertarian Roxanne Simonson3,5532.71+1.2
Turnout 131,047
US House election, 2016: Texas District 27 [16]
PartyCandidateVotes%±%
Republican Blake Farenthold (incumbent)142,25161.69−1.91
Democratic Raul (Roy) Barrera88,32938.31+4.62
Turnout 230,580
Texas's 27th congressional district special election, 2018 [17]
PartyCandidateVotes%
Republican Michael Cloud 19,856 54.74%
Democratic Eric Holguin11,59531.96%
Democratic Raul (Roy) Barrera1,7474.81%
Republican Bech Bruun (withdrawn)1,5704.32%
Republican Marty Perez2760.76%
Democratic Mike Westergren8582.36%
Independent Judith Cutright1720.47%
Libertarian Daniel Tinus1440.39%
Independent Christopher Suprun 510.14%
Total votes36,268 100.0
US House election, 2018: Texas District 27 [18]
PartyCandidateVotes%
Republican Michael Cloud (incumbent) 125,118 60.32
Democratic Eric Holguin75,92936.61
Libertarian Daniel Tinus2,1001.01
Independent James Duerr4,2742.06
Total votes207,421 100
Republican hold
US House election, 2020: Texas District 27 [19]
PartyCandidateVotes%
Republican Michael Cloud (incumbent) 172,305 63.1
Democratic Ricardo "Rick" De La Fuente95,44634.9
Libertarian Phil Gray5,4822.0
Total votes273,253 100.0
Republican hold
US House election, 2022: Texas District 27 [20]
PartyCandidateVotes%
Republican Michael Cloud (incumbent) 133,416 64.4
Democratic Maclovio Perez73,61135.6
Total votes207,027 100.0
Republican hold

Historical district boundaries

2005-2013 TX27 109.gif
2005–2013
2013-2023 Texas US Congressional District 27 (since 2013).tif
2013–2023

See also

References

  1. "Congressional Districts Relationship Files (State-based)". U.S. Census Bureau. Archived from the original on April 2, 2013.
  2. "My Congressional District".
  3. "My Congressional District".
  4. "2022 Cook PVI: District Map and List". Cook Political Report. July 12, 2022. Retrieved January 10, 2023.
  5. Brufke, Juliegrace (April 6, 2018). "GOP Rep. Farenthold resigns amid sexual harassment scandal". The Hill . Retrieved April 6, 2018.
  6. "Election Results: Texas Will Vote to Replace Congressman Who Retired Amid Scandal". The New York Times . June 30, 2018. Retrieved June 30, 2018.
  7. Texas 27th District Profile The New York Times Accessed November 2010
  8. "Federal court invalidates part of Texas congressional map" by Alexa Ura and Jim Malewitz, Texas Tribune, Aug. 15, 2017
  9. https://davesredistricting.org/maps#viewmap::1c2c1e0d-2fd1-43a8-a039-73e7023124d1
  10. texas 2020 pres-by-newCD. docs.google.com (Report).
  11. https://www2.census.gov/geo/maps/cong_dist/cd118/cd_based/ST48/CD118_TX27.pdf
  12. "District Population Analysis with County Subtotals | CONGRESSIONAL DISTRICTS - PLANC2100" (PDF). Capitol Data Portal. Texas Legislative Council. August 26, 2021. Archived (PDF) from the original on June 27, 2022. Retrieved January 1, 2023.
  13. "District Population Analysis with County Subtotals | CONGRESSIONAL DISTRICTS - PLANC2193" (PDF). Capitol Data Portal. Texas Legislative Council. October 17, 2021. Archived (PDF) from the original on December 25, 2022. Retrieved January 1, 2023.
  14. "Office of the Secretary of State; Race Summary Report; 2012 General Election". Secretary of State of Texas. November 6, 2012. Archived from the original on November 8, 2006. Retrieved September 22, 2013.
  15. "Office of the Secretary of State; Race Summary Report; 2014 General Election". Secretary of State of Texas. November 4, 2014. Retrieved April 6, 2018.
  16. "Office of the Secretary of State; Race Summary Report; 2016 General Election". Secretary of State of Texas. November 8, 2014. Retrieved April 6, 2018.
  17. "2018 Special Election, US Representative, District 27". Texas Secretary of State. Retrieved June 30, 2018.
  18. "Texas Election Results". Texas Secretary of State. Retrieved December 5, 2018.
  19. "Texas Election Results - Official Results". Texas Secretary of State. Retrieved November 26, 2020.
  20. "Texas Election Night Results". Texas Department of State. Retrieved November 17, 2022.

28°46′59″N96°50′29″W / 28.78306°N 96.84139°W / 28.78306; -96.84139