Geography
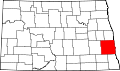
Cass County lies on the east side of North Dakota. Its east boundary line abuts the west boundary line of the state of Minnesota across the river. The Red River flows northward along the county's east boundary, on its way to Lake Winnipeg and Hudson Bay. The county's terrain consists of low rolling hills, devoted to agriculture except around developed areas. [8] Its terrain slopes to the north and east, with its highest point on the southwestern corner at 1,194 ft (364 m) ASL. [9]
According to the United States Census Bureau, the county has a total area of 1,767.811 square miles (4,578.61 km2), of which 1,764.935 square miles (4,571.16 km2) is land and 2.876 square miles (7.45 km2) (0.16%) is water. [10] It is the 10th largest county in North Dakota by total area. [11]
Lakes
Cass County has the following lakes: [8]
Demographics
Historical population| Census | Pop. | Note | %± |
|---|
| 1880 | 8,998 | | — |
|---|
| 1890 | 19,613 | | 118.0% |
|---|
| 1900 | 28,625 | | 45.9% |
|---|
| 1910 | 33,935 | | 18.6% |
|---|
| 1920 | 41,477 | | 22.2% |
|---|
| 1930 | 48,735 | | 17.5% |
|---|
| 1940 | 52,849 | | 8.4% |
|---|
| 1950 | 58,877 | | 11.4% |
|---|
| 1960 | 66,947 | | 13.7% |
|---|
| 1970 | 73,653 | | 10.0% |
|---|
| 1980 | 88,247 | | 19.8% |
|---|
| 1990 | 102,874 | | 16.6% |
|---|
| 2000 | 123,138 | | 19.7% |
|---|
| 2010 | 149,778 | | 21.6% |
|---|
| 2020 | 184,525 | | 23.2% |
|---|
| 2024 (est.) | 200,945 | [12] | 8.9% |
|---|
|
As of the fourth quarter of 2024, the median home value in Cass County was $301,108. [17]
As of the 2023 American Community Survey, there are 81,668 estimated households in Cass County with an average of 2.24 persons per household. The county has a median household income of $75,023. Approximately 9.7% of the county's population lives at or below the poverty line. Cass County has an estimated 75.8% employment rate, with 43.3% of the population holding a bachelor's degree or higher and 95.8% holding a high school diploma. [2]
The top five reported ancestries (people were allowed to report up to two ancestries, thus the figures will generally add to more than 100%) were English (92.7%), Spanish (0.3%), Indo-European (0.2%), Asian and Pacific Islander (0.0%), and Other (6.7%).
Cass County, North Dakota – racial and ethnic composition
Note: the US Census treats Hispanic/Latino as an ethnic category. This table excludes Latinos from the racial categories and assigns them to a separate category. Hispanics/Latinos may be of any race.
| Race / ethnicity (NH = non-Hispanic) | Pop. 1980 [18] | Pop. 1990 [19] | Pop. 2000 [20] | Pop. 2010 [21] | Pop. 2020 [22] |
|---|
| White alone (NH) | 86,522
(98.05%) | 99,986
(97.19%) | 116,263
(94.42%) | 135,530
(90.49%) | 149,442
(80.99%) |
| Black or African American alone (NH) | 141
(0.16%) | 274
(0.27%) | 978
(0.79%) | 3,372
(2.25%) | 12,761
(6.92%) |
| Native American or Alaska Native alone (NH) | 501
(0.57%) | 918
(0.89%) | 1,277
(1.04%) | 1,681
(1.12%) | 2,367
(1.28%) |
| Asian alone (NH) | 392
(0.44%) | 973
(0.95%) | 1,543
(1.25%) | 3,524
(2.35%) | 6,034
(3.27%) |
| Pacific Islander alone (NH) | — | — | 42
(0.03%) | 49
(0.03%) | 79
(0.04%) |
| Other race alone (NH) | 176
(0.20%) | 23
(0.02%) | 96
(0.08%) | 140
(0.09%) | 459
(0.25%) |
| Mixed race or multiracial (NH) | — | — | 1,421
(1.15%) | 2,467
(1.65%) | 7,201
(3.90%) |
| Hispanic or Latino (any race) | 515
(0.58%) | 700
(0.68%) | 1,518
(1.23%) | 3,015
(2.01%) | 6,182
(3.35%) |
| Total | 88,247
(100.00%) | 102,874
(100.00%) | 123,138
(100.00%) | 149,778
(100.00%) | 184,525
(100.00%) |
2024 estimate
As of the 2024 estimate, there were 200,945 people and 81,668 households residing in the county. There were 92,465 housing units at an average density of 52.39 per square mile (20.2/km2). The racial makeup of the county was 85.3% White (82.2% NH White), 7.3% African American, 1.7% Native American, 3.2% Asian, 0.1% Pacific Islander, _% from some other races and 2.5% from two or more races. Hispanic or Latino people of any race were 3.8% of the population. [23]
2020 census
As of the 2020 census, there were 184,525 people, 78,672 households, and 42,849 families residing in the county. [24] [25] The population density was 104.6 inhabitants per square mile (40.4/km2). [24] There were 85,397 housing units at an average density of 48.4 inhabitants per square mile (18.7/km2). [24]
The racial makeup of the county was 82.0% White, 7.0% Black or African American, 1.4% American Indian and Alaska Native, 3.3% Asian, 1.1% from some other race, and 5.1% from two or more races. Hispanic or Latino residents of any race comprised 3.4% of the population. [25]
Of the residents, 22.5% were under the age of 18 and 12.5% were 65 years of age or older; the median age was 33.4 years. For every 100 females there were 102.2 males, and for every 100 females age 18 and over there were 101.4 males. [24]
There were 78,672 households in the county, of which 27.7% had children under the age of 18 living with them and 26.3% had a female householder with no spouse or partner present. About 35.0% of all households were made up of individuals and 9.0% had someone living alone who was 65 years of age or older. [24]
Of the 85,397 housing units, 7.9% were vacant. Among occupied housing units, 51.2% were owner-occupied and 48.8% were renter-occupied. The homeowner vacancy rate was 1.5% and the rental vacancy rate was 10.0%. [24]
2010 census
As of the 2010 census, there were 149,778 people, 63,899 households, and 35,215 families in the county. The population density was 84.9 inhabitants per square mile (32.8/km2). There were 67,938 housing units at an average density of 38.5 inhabitants per square mile (14.9/km2). The racial makeup of the county was 91.67% White, 2.29% African American, 1.22% Native American, 2.36% Asian, 0.03% Pacific Islander, 0.53% from some other races and 1.89% from two or more races. Hispanic or Latino people of any race were 2.01% of the population.
In terms of ancestry, 45.4% were German, 35.8% were Norwegian, 9.2% were Irish, 6.3% were Swedish, and 1.7% were American.
Of the 63,899 households, 27.8% had children under the age of 18 living with them, 42.9% were married couples living together, 8.3% had a female householder with no husband present, 44.9% were non-families, and 33.0% of all households were made up of individuals. The average household size was 2.27 and the average family size was 2.94. The median age was 31.5 years.
The median income for a household in the county was $47,600 and the median income for a family was $68,858. Males had a median income of $42,557 versus $31,916 for females. The per capita income for the county was $28,184. About 5.8% of families and 12.8% of the population were below the poverty line, including 11.0% of those under age 18 and 10.1% of those age 65 or over.
Government
County Commissioners
Cass County is governed by a board of commissioners elected to four-year terms. Other elected officials include the sheriff and state's attorney. Appointed officials include administrator, extension agent, director of tax equalization, finance auditor, highway engineer, human services officer, information technology coordinator, recorder, veterans service officer, and weed control officer.
| District | Commissioner | Assumed office | Current term ends |
|---|
| 1st | Tim Flakoll (Vice Chair) | 2024 | 2028 |
| 2nd | Tony Grindberg (Chair) | 2022 | 2026 |
| 3rd | Jim Kapitan | 2020 | 2024 |
| 4th | Duane Breitling | 2018 | 2026 |
| 5th | Joel Vettel | 2024 | 2028 |
The current Sheriff is Jesse F. Jahner. Jahner has served as Sheriff of Cass County since January 2, 2019.
The voters of Cass County have historically tended to vote Republican. As recently as the 2004 presidential election, George W. Bush carried Cass County with nearly 60 percent of the vote. However, in recent elections, the county has become more politically diverse and competitive, particularly in Fargo. In 2008, Democratic candidate Barack Obama won the majority of votes in Cass County, with a voting percentage very close to the percentage Obama received in the entire nation, while John McCain won the majority of votes in North Dakota. Mitt Romney's winning margin in 2012 over Obama in Cass County was 49.9% to 47%, while Donald Trump received 49.3% of votes in 2016 (52.69% in 2024), compared to 38.8% for Hillary Clinton and 11.9% for third-party candidates. In 2018, Democratic Senator Heidi Heitkamp achieved a 14-point lead in Eastern North Dakota, although the state as a whole soundly elected Republican Kevin Cramer.
In the North Dakota Legislative Assembly, Fargo falls into 9 districts: 10th, 11th, 16th, 21st, 27th, 41st and 44th-46th. In the House, it's represented by 7 Democrats and 11 Republicans, in Senate by 4 Democrats and 5 Republicans.