Georgia's 7th congressional district | |
---|---|
Interactive map of district boundaries since January 3, 2025 | |
Representative | |
Distribution |
|
Population (2023) | 778,113 [2] |
Median household income | $84,613 [2] |
Ethnicity |
|
Cook PVI | R+11 [3] |
Georgia's 7th congressional district is a congressional district in the U.S. state of Georgia. It is currently represented by Republican Rich McCormick.
The district includes portions of the north Atlanta metropolitan area, including the cities of Alpharetta, Cumming, Dahlonega, Dawsonville, Johns Creek, Milton, Roswell, and Sandy Springs. It covers parts of Cherokee, Fulton, and Hall counties and all of Dawson, Forsyth, and Lumpkin counties. [4]
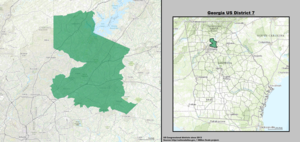
From 2013 to 2023, the district included most of Gwinnett County and portions of Forsyth County. [5]
Although the seat had been held by Republicans from 1995 until 2021, the 7th district had previously elected Democrats consistently from the Reconstruction era (1868) until the 1994 Congressional Elections. The district has recently become friendlier to Democrats as a result of significant demographic changes, particularly the growth of Black, Hispanic and Asian populations. In the 2018 midterm elections, Republican Rob Woodall won reelection by only 433 votes, or 0.15%, against Democrat Carolyn Bourdeaux, and his victory was only confirmed after a recount. In terms of both absolute numbers and vote percentage, it was the closest U.S. House race in the country in 2018. In 2020, Bourdeaux was elected to represent the district in Congress.
Year | Office | Results [6] |
---|---|---|
2008 | President | McCain 68% - 31% |
2012 | President | Romney 73% - 27% |
2016 | President | Trump 63% - 33% |
Senate | Isakson 68% - 26% | |
2018 | Governor | Kemp 62% - 36% |
Lt. Governor | Duncan 64% - 36% | |
Attorney General | Carr 64% - 36% | |
2020 | President | Trump 59% - 40% |
2021 | Senate (Reg.) | Perdue 61% - 39% |
Senate (Spec.) | Loeffler 61% - 39% | |
2022 | Senate | Walker 59% - 41% |
Governor | Kemp 66% - 33% | |
Lt. Governor | Jones 63% - 35% | |
Attorney General | Carr 63% - 35% | |
Secretary of State | Raffensperger 65% - 31% | |
2024 | President | Trump 60% - 38% |
For the 119th and successive Congresses (based on the districts drawn following a 2023 court order), the district contains all or portions of the following counties and communities. [7] [8]
Cherokee County (3)
Dawson County (1)
Forsyth County (1)
Fulton County (6)
Hall County (5)
Lumpkin County (1)
According to the APM Research Lab's Voter Profile Tools (featuring the U.S. Census Bureau's 2019 American Community Survey), the district contained about 502,000 potential voters (citizens, age 18+). Of these, 52% are White, 24% Black, 12% Asian, and 10% Latino. More than one-fifth (21%) of the district's potential voters are immigrants. The median income among households (with one or more potential voter) in the district is about $85,800. As for the educational attainment of potential voters in the district, 44% hold a bachelor's or higher degree.
Party | Candidate | Votes | % | |
---|---|---|---|---|
Republican | John Linder | 138,997 | 78.91 | |
Democratic | Michael Berlon | 37,124 | 21.08 | |
No party | Others | 24 | 0.02 | |
Total votes | 176,145 | 100.00 | ||
Turnout | ||||
Republican hold |
Party | Candidate | Votes | % | |
---|---|---|---|---|
Republican | John Linder* | 258,982 | 100.00 | |
Total votes | 258,982 | 100.00 | ||
Turnout | ||||
Republican hold |
Party | Candidate | Votes | % | |
---|---|---|---|---|
Republican | John Linder* | 130,561 | 70.91 | |
Democratic | Allan Burns | 53,553 | 29.09 | |
Total votes | 184,114 | 100.00 | ||
Turnout | ||||
Republican hold |
Party | Candidate | Votes | % | |
---|---|---|---|---|
Republican | John Linder* | 209,354 | 62.03 | |
Democratic | Doug Heckman | 128,159 | 37.97 | |
Total votes | 337,513 | 100.00 | ||
Turnout | ||||
Republican hold |
Party | Candidate | Votes | % | |
---|---|---|---|---|
Republican | Rob Woodall | 160,898 | 67.07 | |
Democratic | Doug Heckman | 78,996 | 32.93 | |
Total votes | 239,894 | 100.00 | ||
Turnout | ||||
Republican hold |
Party | Candidate | Votes | % | |
---|---|---|---|---|
Republican | Rob Woodall (incumbent) | 156,689 | 62.16 | |
Democratic | Steve Riley | 95,377 | 37.84 | |
Total votes | 252,066 | 100.00 | ||
Turnout | ||||
Republican hold |
Party | Candidate | Votes | % | |
---|---|---|---|---|
Republican | Rob Woodall (incumbent) | 113,557 | 65.39 | |
Democratic | Thomas Wight | 60,112 | 34.61 | |
Total votes | 173,669 | 100.00 | ||
Turnout | ||||
Republican hold |
Party | Candidate | Votes | % | |
---|---|---|---|---|
Republican | Rob Woodall (incumbent) | 174,081 | 60.38 | |
Democratic | Rashid Malik | 114,220 | 39.62 | |
Total votes | 288,301 | 100.00 | ||
Turnout | ||||
Republican hold |
Party | Candidate | Votes | % | ||
---|---|---|---|---|---|
Republican | Rob Woodall (incumbent) | 140,430 | 50.08 | ||
Democratic | Carolyn Bourdeaux | 140,011 | 49.92 | ||
Total votes | 280,441 | 100.0 | |||
Republican hold |
Party | Candidate | Votes | % | |
---|---|---|---|---|
Democratic | Carolyn Bourdeaux | 190,900 | 51.39 | |
Republican | Rich McCormick | 180,564 | 48.61 | |
Total votes | 371,464 | 100.0 | ||
Democratic gain from Republican |
Party | Candidate | Votes | % | ||
---|---|---|---|---|---|
Democratic | Lucy McBath (incumbent) | 143,063 | 61.05 | ||
Republican | Mark Gonsalves | 91,262 | 38.95 | ||
Total votes | 234,325 | 100.0 | |||
Democratic hold |
Party | Candidate | Votes | % | ||
---|---|---|---|---|---|
Republican | Rich McCormick (incumbent) | 275,907 | 64.85 | ||
Democratic | Bob Christian | 149,535 | 35.15 | ||
Total votes | 425,442 | 100.0 | |||
Republican hold |
{{cite web}}
: Missing or empty |title=
(help)