Major stock exchanges
Major stock exchange groups of issued shares of listed companies with over USD 1 trillion market capitalization as of 20 October 2025. [2] [3]
| Stock exchange | MIC | Region | City | Market cap (USD tn) | Monthly trade volume (USD bn) | Time zone | Δ | DST | Open hours (local time) | UTC (without DST) | |||
|---|---|---|---|---|---|---|---|---|---|---|---|---|---|
| Open | Close | Lunch | Open | Close | |||||||||
| New York Stock Exchange | XNYS | New York City | 44.7 [4] | 2,685 | EST/EDT | −5:00 | Mar–Nov | 09:30 | 16:00 | No | 14:30 | 21:00 | |
| Nasdaq (US) | 42.2 [5] | 2,727 | |||||||||||
| Shanghai Stock Exchange | XSHG | Shanghai | 8.92 [6] | 1,906 | CST | +8:00 | 15:00 | 11:30–13:00 | 01:30 | 07:00 | |||
| Japan Exchange Group (Tokyo Stock Exchange) | XJPX (TYO) | Tokyo | 7.59 [7] | 652 | JST | +9:00 | 09:00 | 15:00 | 11:30–12:30 | 00:00 | 06:00 | ||
| Hong Kong Stock Exchange | XHKG | Hong Kong | 6.17 [8] | 762 | HKT | +8:00 | 09:30 | 16:00 | 12:00–13:00 | 01:30 | 08:00 | ||
| Euronext | XAMS XBRU XMSM XLIS XMIL XOSL XPAR | Amsterdam Athens Brussels Dublin Lisbon Milan Oslo Paris | 5.61 [9] | 186 | CET/CEST | +1:00 | Mar–Oct | 09:00 | 17:30 | No | 08:00 | 16:30 | |
| Bombay Stock Exchange | XBOM | Mumbai | 5.25 [10] | 501 | IST | +5:30 | 09:15 | 15:30 | No | 03:45 | 10:00 | ||
| National Stock Exchange | XNSE | 5.32 [11] | 294 | ||||||||||
| Shenzhen Stock Exchange | XSHE | Shenzhen | 5.11 [12] | 2,888 | CST | +8:00 | 09:30 | 15:00 | 11:30–13:00 | 01:30 | 07:00 | ||
| Toronto Stock Exchange | XTSE | Toronto | 4.00 [13] | 206 | EST/EDT | −5:00 | Mar–Nov | 16:00 | No | 14:30 | 21:00 | ||
| London Stock Exchange | XLON | London | 3.14 [14] | 219 | GMT/BST | +0:00 | Mar–Oct | 08:00 | 16:30 | 08:00 | 16:30 | ||
| Korea Exchange | XKOS | Seoul Busan | 2.95 | 204 | KST | +9:00 | 09:00 | 15:30 | 00:00 | 06:30 | |||
| Taiwan Stock Exchange | XTAI | Taipei | 2.87 | 222 | NST (Taiwan) | +8:00 | 13:30 | 01:00 | 05:30 | ||||
| Saudi Exchange | XSAU | Riyadh | 2.73 | 32 | AST | +3:00 | 10:00 | 15:00 | 07:00 | 12:00 | |||
| German Stock Exchange (Deutsche Börse AG) | XFRA | Frankfurt | 2.04 | 77 | CET/CEST | +1:00 | Mar–Oct | 08:00 (Eurex) 08:00 (floor) 09:00 (Xetra) | 22:00 (Eurex) 20:00 (floor) 17:30 (Xetra) | 07:00 | 21:00 | ||
| Tehran Stock Exchange | XTEH | Tehran | 2.00 | 39 | IRST | +3:30 | 09:00 | 12:30 | 05:30 | 09:00 | |||
| SIX Swiss Exchange | XSWX | Zürich | 1.97 | 54 | CET/CEST | +1:00 | Mar–Oct | 17:30 | 08:00 | 16:30 | |||
| Australian Securities Exchange | XASX | Sydney | 1.89 | 91 | AEST/AEDT | +10:00 | Oct–Apr | 10:00 | 16:00 | 00:00 | 06:00 | ||
| Nasdaq Nordic and Baltic Exchanges | 1.79 | 47 | |||||||||||
| Copenhagen Stock Exchange | XCSE | Copenhagen | CET/CEST | +1:00 | Mar–Oct | 09:00 | 17:00 | 08:00 | 16:00 | ||||
| Stockholm Stock Exchange | XSTO | Stockholm | CET/CEST | +1:00 | Mar–Oct | 17:30 | 08:00 | 16:30 | |||||
| Helsinki Stock Exchange | XHEL | Helsinki | EET/EEST | +2:00 | Mar–Oct | 10:00 | 18:30 | 08:00 | 16:30 | ||||
| Tallinn Stock Exchange | XTAL | Tallinn | EET/EEST | +2:00 | Mar–Oct | 16:00 | 08:00 | 14:00 | |||||
| Riga Stock Exchange | XRIS | Riga | EET/EEST | +2:00 | Mar–Oct | 16:00 | 08:00 | 14:00 | |||||
| Vilnius Stock Exchange | XLIT | Vilnius | EET/EEST | +2:00 | Mar–Oct | 16:00 | 08:00 | 14:00 | |||||
| Iceland Stock Exchange | XICE | Reykjavík | GMT | +0:00 | 09:30 | 15:30 | 09:30 | 15:30 | |||||
| Johannesburg Stock Exchange | XJSE | Johannesburg | 1.15 | 60 | SAST | +2:00 | 09:00 | 16:50 | No | 07:00 | 14:50 | ||
- Notes
* "Δ" to UTC, as well as "Open (UTC)" and "Close (UTC)" columns contain valid data only for standard time in a given time zone. During daylight saving time period, the UTC times will be one hour less and Δs one hour more.
** Applicable for non-closing auction session shares only.
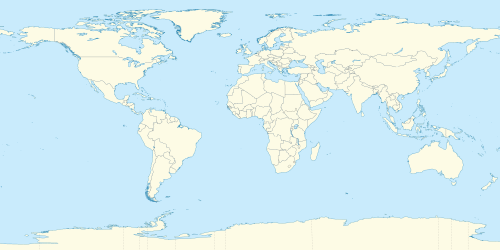
New York
Shanghai
Euronext
Tokyo
Shenzhen
Hong Kong
Mumbai
Toronto
The 10 largest stock exchanges (New York City and Mumbai have two exchanges each).