District boundaries were redrawn in 1992, 2002, 2012, and 2022 due to reapportionment following the censuses of 1990, 2000, 2010, and 2020.
The current district is considered quite competitive. Southern Macomb County tends to support Democratic candidates, while central Macomb County and Rochester/Rochester Hills tend to be more moderate to slightly Republican. From 2021 to 2022, Lisa McClain represented the 10th; after redistricting moved McClain to the neighboring 9th district, John E. James was elected to represent it since 2023.[2][3]
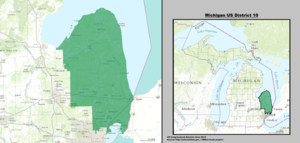
Counties and municipalities
For the 118th and successive Congresses (based on redistricting following the 2020 census), the district contains all or portions of the following counties and municipalities:[4]
From 1992 to 2002 the 10th congressional district included St. Clair County, and slightly more than half of Macomb Counties population, but lacking the cities of Sterling Heights, Michigan and Warren, Michigan. In the 2002 redistricting Lapeer County, Huron County, Sanilac County and about two thirds of Sterling Heights were added to the district. At the same time Clinton Township, Mt. Clemens, St. Clair Shores, Fraser and Roseville were removed from the district.
Prior to the 1992 redistricting the 10th district had its largest city as Midland and roughly corresponded to the present 4th district. The post-1992 10th district was very similar to the previous 12th district, although it took small areas from the 18th district, the 14th district and the 8th district, and lost north-west Warren to the new 12th district.
Martis, Kenneth C. (1982). The historical atlas of United States Congressional districts, 1789-1983. cartographer and assistant editor, Ruth Anderson Rowles; compilation draftsmen, David Durham, Brian Raber, Thomas Kokernak; research assistants, Rowland Dent ... et al. New York: Free Press. ISBN0029201500. LCCN82070583.
This page is based on this Wikipedia article Text is available under the CC BY-SA 4.0 license; additional terms may apply. Images, videos and audio are available under their respective licenses.