A geographic information system (GIS) consists of integrated computer hardware and software that store, manage, analyze, edit, output, and visualize geographic data. Much of this often happens within a spatial database, however, this is not essential to meet the definition of a GIS. In a broader sense, one may consider such a system also to include human users and support staff, procedures and workflows, the body of knowledge of relevant concepts and methods, and institutional organizations.
Routing is the process of selecting a path for traffic in a network or between or across multiple networks. Broadly, routing is performed in many types of networks, including circuit-switched networks, such as the public switched telephone network (PSTN), and computer networks, such as the Internet.

A minimum spanning tree (MST) or minimum weight spanning tree is a subset of the edges of a connected, edge-weighted undirected graph that connects all the vertices together, without any cycles and with the minimum possible total edge weight. That is, it is a spanning tree whose sum of edge weights is as small as possible. More generally, any edge-weighted undirected graph has a minimum spanning forest, which is a union of the minimum spanning trees for its connected components.

In graph theory, the shortest path problem is the problem of finding a path between two vertices in a graph such that the sum of the weights of its constituent edges is minimized.
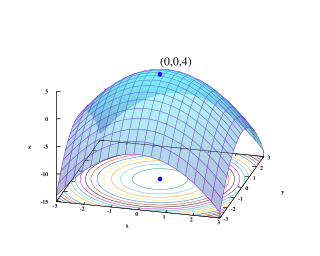
Mathematical optimization or mathematical programming is the selection of a best element, with regard to some criteria, from some set of available alternatives. It is generally divided into two subfields: discrete optimization and continuous optimization. Optimization problems arise in all quantitative disciplines from computer science and engineering to operations research and economics, and the development of solution methods has been of interest in mathematics for centuries.
A* is a graph traversal and pathfinding algorithm, which is used in many fields of computer science due to its completeness, optimality, and optimal efficiency. Given a weighted graph, a source node and a goal node, the algorithm finds the shortest path from source to goal.

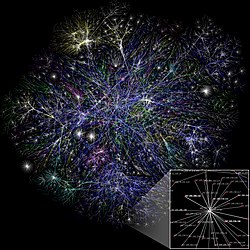
Graph drawing is an area of mathematics and computer science combining methods from geometric graph theory and information visualization to derive two-dimensional depictions of graphs arising from applications such as social network analysis, cartography, linguistics, and bioinformatics.
Route assignment, route choice, or traffic assignment concerns the selection of routes between origins and destinations in transportation networks. It is the fourth step in the conventional transportation forecasting model, following trip generation, trip distribution, and mode choice. The zonal interchange analysis of trip distribution provides origin-destination trip tables. Mode choice analysis tells which travelers will use which mode. To determine facility needs and costs and benefits, we need to know the number of travelers on each route and link of the network. We need to undertake traffic assignment. Suppose there is a network of highways and transit systems and a proposed addition. We first want to know the present pattern of traffic delay and then what would happen if the addition were made.
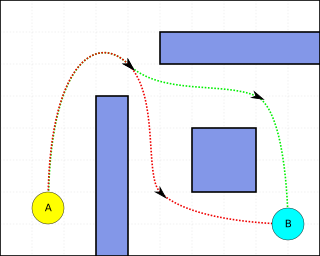
Pathfinding or pathing is the search, by a computer application, for the shortest route between two points. It is a more practical variant on solving mazes. This field of research is based heavily on Dijkstra's algorithm for finding the shortest path on a weighted graph.
Friction of distance is a core principle of geography that states that movement incurs some form of cost, in the form of physical effort, energy, time, and/or the expenditure of other resources, and that these costs are proportional to the distance traveled. This cost is thus a resistance against movement, analogous to the effect of friction against movement in classical mechanics. The subsequent preference for minimizing distance and its cost underlies a vast array of geographic patterns from economic agglomeration to wildlife migration, as well as many of the theories and techniques of spatial analysis, such as Tobler's first law of geography, network routing, and cost distance analysis. To a large degree, friction of distance is the primary reason why geography is relevant to many aspects of the world, although its importance has been decreasing with the development of transportation and communication technologies.

The vehicle routing problem (VRP) is a combinatorial optimization and integer programming problem which asks "What is the optimal set of routes for a fleet of vehicles to traverse in order to deliver to a given set of customers?" It generalises the travelling salesman problem (TSP). It first appeared in a paper by George Dantzig and John Ramser in 1959, in which the first algorithmic approach was written and was applied to petrol deliveries. Often, the context is that of delivering goods located at a central depot to customers who have placed orders for such goods. The objective of the VRP is to minimize the total route cost. In 1964, Clarke and Wright improved on Dantzig and Ramser's approach using an effective greedy algorithm called the savings algorithm.
In business intelligence, location intelligence (LI), or spatial intelligence, is the process of deriving meaningful insight from geospatial data relationships to solve a particular problem. It involves layering multiple data sets spatially and/or chronologically, for easy reference on a map, and its applications span industries, categories and organizations.
In mathematics, a graph partition is the reduction of a graph to a smaller graph by partitioning its set of nodes into mutually exclusive groups. Edges of the original graph that cross between the groups will produce edges in the partitioned graph. If the number of resulting edges is small compared to the original graph, then the partitioned graph may be better suited for analysis and problem-solving than the original. Finding a partition that simplifies graph analysis is a hard problem, but one that has applications to scientific computing, VLSI circuit design, and task scheduling in multiprocessor computers, among others. Recently, the graph partition problem has gained importance due to its application for clustering and detection of cliques in social, pathological and biological networks. For a survey on recent trends in computational methods and applications see Buluc et al. (2013). Two common examples of graph partitioning are minimum cut and maximum cut problems.
In geographic information systems (GIS) and spatial analysis, buffer analysis is the determination of a zone around a geographic feature containing locations that are within a specified distance of that feature, the buffer zone. A buffer is likely the most commonly used tool within the proximity analysis methods.
Proximity analysis is a class of spatial analysis tools and algorithms that employ geographic distance as a central principle. Distance is fundamental to geographic inquiry and spatial analysis, due to principles such as the friction of distance, Tobler's first law of geography, and Spatial autocorrelation, which are incorporated into analytical tools. Proximity methods are thus used in a variety of applications, especially those that involve movement and interaction.
In applied mathematics, branch and price is a method of combinatorial optimization for solving integer linear programming (ILP) and mixed integer linear programming (MILP) problems with many variables. The method is a hybrid of branch and bound and column generation methods.
A geometric network is an object commonly used in geographic information systems to model a series of interconnected features. A geometric network is similar to a graph in mathematics and computer science, and can be described and analyzed using theories and concepts similar to graph theory. Geometric networks are often used to model road networks and public utility networks. Geometric networks are called in recent years very often spatial networks.

Geospatial topology is the study and application of qualitative spatial relationships between geographic features, or between representations of such features in geographic information, such as in geographic information systems (GIS). For example, the fact that two regions overlap or that one contains the other are examples of topological relationships. It is thus the application of the mathematics of topology to GIS, and is distinct from, but complementary to the many aspects of geographic information that are based on quantitative spatial measurements through coordinate geometry. Topology appears in many aspects of geographic information science and GIS practice, including the discovery of inherent relationships through spatial query, vector overlay and map algebra; the enforcement of expected relationships as validation rules stored in geospatial data; and the use of stored topological relationships in applications such as network analysis. Spatial topology is the generalization of geospatial topology for non-geographic domains, e.g., CAD software.
In spatial analysis and geographic information systems, cost distance analysis or cost path analysis is a method for determining one or more optimal routes of travel through unconstrained (two-dimensional) space. The optimal solution is that which minimizes the total cost of the route, based on a field of cost density that varies over space due to local factors. It is thus based on the fundamental geographic principle of Friction of distance. It is an optimization problem with multiple deterministic algorithm solutions, implemented in most GIS software.