Hancock County | |
---|---|
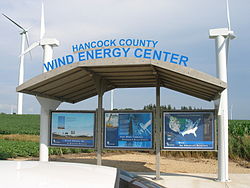
![]() Visitor kiosk at the 148 wind turbine farm | |
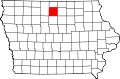
![]() Location within the U.S. state of Iowa | |
![]() Iowa's location within the U.S. | |
Coordinates: 43°05′00″N93°44′11″W / 43.083333333333°N 93.736388888889°W | |
Country | ![]() |
State | ![]() |
Founded | 1851 |
Named for | John Hancock |
Seat | Garner |
Largest city | Garner |
Area | |
• Total | 573 sq mi (1,480 km2) |
• Land | 571 sq mi (1,480 km2) |
• Water | 2.0 sq mi (5 km2) 0.4% |
Population (2020) | |
• Total | 10,795 |
• Estimate (2023) | 10,615 ![]() |
• Density | 19/sq mi (7.3/km2) |
Time zone | UTC−6 (Central) |
• Summer (DST) | UTC−5 (CDT) |
Congressional district | 4th |
Website | hancockcountyia |
Hancock County is a county in the U.S. state of Iowa. As of the 2020 census, the population was 10,795. [1] The county seat is Garner. [2] The county was founded on January 15, 1851, and named in honor of John Hancock, a leader of the Continental Congress during the American Revolution. [3]
According to the U.S. Census Bureau, the county has an area of 573 square miles (1,480 km2), of which 571 square miles (1,480 km2) is land and 2.0 square miles (5.2 km2) (0.4%) is water. [4]
Hancock county was established as a result of an election on June 28, 1858. [5] At the time two townships, Avery and Madison, were also established. Soon after a courthouse was built in Garner, Iowa that continues to be the county seat.
Census | Pop. | Note | %± |
---|---|---|---|
1860 | 179 | — | |
1870 | 999 | 458.1% | |
1880 | 3,453 | 245.6% | |
1890 | 7,621 | 120.7% | |
1900 | 13,752 | 80.4% | |
1910 | 12,731 | −7.4% | |
1920 | 14,723 | 15.6% | |
1930 | 14,802 | 0.5% | |
1940 | 15,402 | 4.1% | |
1950 | 15,077 | −2.1% | |
1960 | 14,604 | −3.1% | |
1970 | 13,506 | −7.5% | |
1980 | 13,833 | 2.4% | |
1990 | 12,638 | −8.6% | |
2000 | 12,100 | −4.3% | |
2010 | 11,341 | −6.3% | |
2020 | 10,795 | −4.8% | |
2023 (est.) | 10,615 | [6] | −1.7% |
U.S. Decennial Census [7] 1790-1960 [8] 1900-1990 [9] 1990-2000 [10] 2010-2018 [11] |
The 2020 census recorded a population of 10,795 in the county, with a population density of 18.8912/sq mi (7.2939/km2). 95.32% of the population reported being of one race. There were 5,113 housing units, of which 4,585 were occupied. [1]
Race | Num. | Perc. |
---|---|---|
White (NH) | 9,813 | 91% |
Black or African American (NH) | 76 | 0.7% |
Native American (NH) | 22 | 0.2% |
Asian (NH) | 25 | 0.23% |
Pacific Islander (NH) | 0 | 0% |
Other/Mixed (NH) | 245 | 2.3% |
Hispanic or Latino | 614 | 5.7% |
The 2010 census recorded a population of 11,341 in the county, with a population density of 19.8578/sq mi (7.6671/km2). There were 5,330 housing units, of which 4,741 were occupied. [13]
At the 2000 census there were 12,100 people, 4,795 households, and 3,375 families in the county. The population density was 21 people per square mile (8.1 people/km2). There were 5,164 housing units at an average density of 9 units per square mile (3.5 units/km2). The racial makeup of the county was 97.70% White, 0.09% Black or African American, 0.10% Native American, 0.31% Asian, 0.02% Pacific Islander, 1.38% from other races, and 0.40% from two or more races. 2.49%. [14] were Hispanic or Latino of any race.
Of the 4,795 households 32.60% had children under the age of 18 living with them, 60.90% were married couples living together, 6.00% had a female householder with no husband present, and 29.60% were non-families. 26.50% of households were one person and 13.70% were one person aged 65 or older. The average household size was 2.48 and the average family size was 3.01.
The age distribution was 26.50% under the age of 18, 6.60% from 18 to 24, 25.50% from 25 to 44, 23.50% from 45 to 64, and 17.90% 65 or older. The median age was 40 years. For every 100 females there were 96.80 males. For every 100 females age 18 and over, there were 95.00 males.
The median household income was $37,703 and the median family income was $44,248. Males had a median income of $29,452 versus $20,376 for females. The per capita income for the county was $17,957. About 5.20% of families and 6.00% of the population were below the poverty line, including 6.90% of those under age 18 and 6.90% of those age 65 or over.
As of December 2008, the unemployment rate in Hancock County was 9.1%, a sharp rise from 4.0% in December 2007. [15] In 2016 the unemployment rate dropped back to 2.2%. [16]
Hancock County is divided into sixteen townships:
The population ranking of the following table is based on the 2020 census of Hancock County. [1] †county seat
Rank | City/Town/etc. | Municipal type | Population (2020 Census) |
---|---|---|---|
1 | Forest City (partially in Winnebago County ) | City | 4,285 |
2 | † Garner | City | 3,065 |
3 | Britt | City | 2,044 |
4 | Kanawha | City | 658 |
5 | Klemme | City | 441 |
6 | Corwith | City | 266 |
7 | Crystal Lake | City | 253 |
8 | Woden | City | 188 |
9 | Goodell | City | 140 |
10 | Duncan | CDP | 57 |
11 | Miller | CDP | 50 |
12 | Hayfield | CDP | 41 |
13 | Hutchins | CDP | 22 |
Year | Republican | Democratic | Third party(ies) | |||
---|---|---|---|---|---|---|
No. | % | No. | % | No. | % | |
2024 | 4,336 | 73.01% | 1,523 | 25.64% | 80 | 1.35% |
2020 | 4,390 | 71.13% | 1,683 | 27.27% | 99 | 1.60% |
2016 | 3,977 | 67.74% | 1,587 | 27.03% | 307 | 5.23% |
2012 | 3,317 | 55.98% | 2,521 | 42.55% | 87 | 1.47% |
2008 | 3,016 | 50.86% | 2,805 | 47.30% | 109 | 1.84% |
2004 | 3,368 | 57.04% | 2,484 | 42.07% | 53 | 0.90% |
2000 | 2,988 | 54.95% | 2,281 | 41.95% | 169 | 3.11% |
1996 | 2,353 | 44.32% | 2,399 | 45.19% | 557 | 10.49% |
1992 | 2,428 | 41.82% | 2,175 | 37.46% | 1,203 | 20.72% |
1988 | 2,731 | 48.83% | 2,831 | 50.62% | 31 | 0.55% |
1984 | 3,362 | 56.62% | 2,539 | 42.76% | 37 | 0.62% |
1980 | 3,681 | 60.42% | 1,918 | 31.48% | 493 | 8.09% |
1976 | 3,127 | 50.54% | 2,975 | 48.08% | 85 | 1.37% |
1972 | 3,706 | 60.47% | 2,349 | 38.33% | 74 | 1.21% |
1968 | 3,544 | 59.57% | 2,131 | 35.82% | 274 | 4.61% |
1964 | 2,269 | 37.00% | 3,857 | 62.89% | 7 | 0.11% |
1960 | 4,179 | 60.24% | 2,757 | 39.74% | 1 | 0.01% |
1956 | 4,305 | 60.51% | 2,803 | 39.40% | 6 | 0.08% |
1952 | 5,115 | 71.26% | 2,053 | 28.60% | 10 | 0.14% |
1948 | 2,802 | 46.31% | 3,096 | 51.17% | 153 | 2.53% |
1944 | 3,114 | 51.87% | 2,855 | 47.56% | 34 | 0.57% |
1940 | 3,632 | 50.63% | 3,514 | 48.99% | 27 | 0.38% |
1936 | 2,585 | 39.00% | 3,930 | 59.28% | 114 | 1.72% |
1932 | 2,355 | 37.66% | 3,822 | 61.11% | 77 | 1.23% |
1928 | 3,114 | 61.12% | 1,933 | 37.94% | 48 | 0.94% |
1924 | 3,183 | 59.62% | 550 | 10.30% | 1,606 | 30.08% |
1920 | 3,617 | 80.84% | 725 | 16.20% | 132 | 2.95% |
1916 | 1,726 | 64.43% | 913 | 34.08% | 40 | 1.49% |
1912 | 860 | 34.30% | 710 | 28.32% | 937 | 37.38% |
1908 | 1,750 | 67.15% | 804 | 30.85% | 52 | 2.00% |
1904 | 2,112 | 78.40% | 517 | 19.19% | 65 | 2.41% |
1900 | 2,186 | 71.32% | 827 | 26.98% | 52 | 1.70% |
1896 | 1,975 | 65.64% | 1,007 | 33.47% | 27 | 0.90% |
School districts include: [18]
Former school districts: