The area around present-day Onawa was a stopping point in 1804 for Meriwether Lewis and William Clark during their exploration of the newly obtained Louisiana Purchase. Many years later, that site was memorialized as the Lewis and Clark State Park.[4]
Monona County was formed in 1851. It was perhaps named for an Indian word meaning "beautiful valley."[5]
Monona County was organized officially in the spring of 1854 having been a part of Benton County (every county west of Benton in a line) in 1851 and afterwards Harrison County between 1852 and 1854.[6]
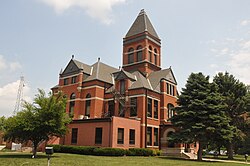
When Ashton (originally called Bloomfield) was named the county seat in the fall of 1854, a log house served as the first courthouse.[7] Ashton remained the county seat for only four years. That designation was moved to Onawa on April 5, 1858, and the first Monona County Courthouse was completed that same year.[8]
Geography
According to the U.S. Census Bureau, the county has a total area of 699 square miles (1,810km2), of which 694 square miles (1,800km2) is land and 4.9 square miles (13km2) (0.7%) is water.[9]
As of the 2020 census, the county had a population of 8,751 and a population density of 12.5/sqmi (4.8/km2). The median age was 45.9 years, 22.0% of residents were under the age of 18, and 25.1% of residents were 65 years of age or older. For every 100 females there were 93.4 males, and for every 100 females age 18 and over there were 93.1 males age 18 and over.[16]
There were 3,839 households in the county, of which 25.2% had children under the age of 18 living in them. Of all households, 45.9% were married-couple households, 19.8% were households with a male householder and no spouse or partner present, and 26.7% were households with a female householder and no spouse or partner present. About 34.7% of all households were made up of individuals and 20.4% had someone living alone who was 65 years of age or older.[16]
There were 4,373 housing units, of which 3,839 were occupied and 12.2% were vacant. Among occupied housing units, 74.1% were owner-occupied and 25.9% were renter-occupied. The homeowner vacancy rate was 1.3% and the rental vacancy rate was 11.6%.[16]
<0.1% of residents lived in urban areas, while 100.0% lived in rural areas.[18]
2010 census
The 2010 census recorded a population of 9,243 in the county, with a population density of 13.3/sqmi (5.1/km2). There were 4,697 housing units, of which 4,050 were occupied.[19]
2000 census
As of the census[20] of 2000, there were 10,020 people, 4,211 households, and 2,737 families residing in the county. The population density was 14 peopleper square mile (5.4 people/km2). There were 4,660 housing units at an average density of 7 unitsper square mile (2.7 units/km2). The racial makeup of the county was 98.34% White, 0.08% Black or African American, 0.76% Native American, 0.12% Asian, 0.04% Pacific Islander, 0.08% from other races, and 0.58% from two or more races. 0.70% of the population were Hispanic or Latino of any race.
There were 4,211 households, out of which 26.70% had children under the age of 18 living with them, 54.50% were married couples living together, 7.10% had a female householder with no husband present, and 35.00% were non-families. 31.00% of all households were made up of individuals, and 17.50% had someone living alone who was 65 years of age or older. The average household size was 2.31 and the average family size was 2.88.
In the county, the population was spread out, with 23.20% under the age of 18, 6.20% from 18 to 24, 23.30% from 25 to 44, 23.30% from 45 to 64, and 23.90% who were 65 years of age or older. The median age was 43 years. For every 100 females, there were 94.20 males. For every 100 females age 18 and over, there were 90.50 males.
The median income for a household in the county was $33,235, and the median income for a family was $41,172. Males had a median income of $27,349 versus $19,607 for females. The per capita income for the county was $17,477. About 6.60% of families and 9.40% of the population were below the poverty line, including 8.90% of those under age 18 and 9.50% of those age 65 or over.
For over a century, Monona County was close to a national bellwether. Between 1900 & 2004, it only failed to back the national winner in 1960 & 1988. However, this bellwether status no longer applies. Barack Obama failed to carry the county in both of his electoral victories statewide & nationally, while Donald Trump in 2020 earned the highest percentage of any candidate since Franklin D. Roosevelt in 1932, in spite of his unsuccessful reelection bid.
United States presidential election results for Monona County, Iowa[21]
This page is based on this Wikipedia article Text is available under the CC BY-SA 4.0 license; additional terms may apply. Images, videos and audio are available under their respective licenses.