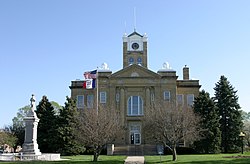
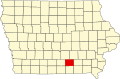
Monroe County is a county located in the south central part of the U.S. state of Iowa. In the early 20th century, it was a center of bituminous coal mining and in 1910 had a population of more than 25,000. As mining declined, people moved elsewhere for work. In the 2020 census, the population was 7,577.[1] The county seat is Albia.[2] The county, originally called Kishkekosh County after a famous chief of the Meskwaki,[3] was renamed for James Monroe, fifth President of the United States.[4]
The county had a sizable Welsh American community at the turn of the 20th century.[5] According to the 1900 census, 83.8% of the Welsh Americans in the country worked in coal mining.[5]
Geography
According to the U.S. Census Bureau, the county has a total area of 434 square miles (1,120km2), of which 434 square miles (1,120km2) is land and 0.6 square miles (1.6km2) (0.1%) is water.[6]
As of the 2020 census, the county had a population of 7,577 and a population density of 17.5/sqmi (6.8/km2). The median age was 42.6 years, 23.5% of residents were under the age of 18, and 21.7% of residents were 65 years of age or older. For every 100 females there were 99.4 males, and for every 100 females age 18 and over there were 98.2 males age 18 and over.[13][14]
There were 3,116 households in the county, of which 28.4% had children under the age of 18 living in them. Of all households, 52.1% were married-couple households, 19.0% were households with a male householder and no spouse or partner present, and 22.8% were households with a female householder and no spouse or partner present. About 28.5% of all households were made up of individuals and 14.2% had someone living alone who was 65 years of age or older. There were 3,636 housing units, of which 14.3% were vacant. Among occupied housing units, 76.3% were owner-occupied and 23.7% were renter-occupied. The homeowner vacancy rate was 1.7% and the rental vacancy rate was 7.1%.[13]
2010 census
The 2010 census recorded a population of 7,970 in the county, with a population density of 18.4/sqmi (7.1/km2). There were 3,884 housing units, of which 3,213 were occupied.[16]
2000 census
As of the census[17] of 2000, there were 8,016 people, 3,228 households, and 2,211 families in the county. The population density was 18 peopleper square mile (6.9 people/km2). There were 3,588 housing units at an average density of 8 unitsper square mile (3.1 units/km2). The racial makeup of the county was 98.40% White, 0.20% Black or African American, 0.36% Native American, 0.40% Asian, 0.12% from other races, and 0.51% from two or more races. 0.50% of the population were Hispanic or Latino of any race.
Of the 3,228 households, 30.50% had children under the age of 18 living with them, 56.20% were married couples living together, 8.60% had a female householder with no husband present, and 31.50% were non-families. 28.00% of households were one person, and 15.30% were one person aged 65 or older. The average household size was 2.43 and the average family size was 2.97.
In the county, the population was spread out, with 25.30% under the age of 18, 7.20% from 18 to 24, 25.00% from 25 to 44, 23.00% from 45 to 64, and 19.50% 65 or older. The median age was 40 years. For every 100 females there were 94.90 males. For every 100 females age 18 and over, there were 92.60 males.
The median household income was $34,877 and the median family income was $41,611. Males had a median income of $31,667 versus $21,401 for females. The per capita income for the county was $17,155. About 5.60% of families and 9.00% of the population were below the poverty line, including 12.20% of those under age 18 and 5.90% of those age 65 or over.
Chief Kishkekosh of the Meskwaki, after whom the county was originally named
This page is based on this Wikipedia article Text is available under the CC BY-SA 4.0 license; additional terms may apply. Images, videos and audio are available under their respective licenses.