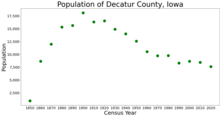
1790-1960{{cite web|url=http://mapserver.lib.virginia.edu|title=Historical Census Browser|publisher=University of Virginia Library|access-date=July 16,2014}}1900-1990{{cite web|url=https://www.census.gov/population/cencounts/ia190090.txt|title=Population of Counties by Decennial Census:1900 to 1990|publisher=United States Census Bureau|access-date=July 16,2014}}
1990-2000{{cite web|url=https://www.census.gov/population/www/cen2000/briefs/phc-t4/tables/tab02.pdf |archive-url=https://web.archive.org/web/20100327165705/http://www.census.gov/population/www/cen2000/briefs/phc-t4/tables/tab02.pdf |archive-date=March 27,2010 |url-status=live|title=Census 2000 PHC-T-4. Ranking Tables for Counties:1990 and 2000|publisher=United States Census Bureau|access-date=July 16,2014}}2010-2018{{cite web|title=State &County QuickFacts|url=http://quickfacts.census.gov/qfd/states/19/19053.html|publisher=United States Census Bureau|access-date=July 16,2014|url-status=dead|archive-url=https://web.archive.org/web/20110607065125/http://quickfacts.census.gov/qfd/states/19/19053.html|archive-date=June 7,2011}}2024{{cite web|url=https://www.census.gov/programs-surveys/popest/data/tables.html|title=Annual Estimates of the Resident Population for Counties:April 1,2020 to July 1,2023|publisher=United States Census Bureau|access-date=April 2,2024}}"}},"i":0}}]}" id="mwXw">.mw-parser-output .us-census-pop{border-spacing:1px;border:1px solid #a2a9b1;background-color:var(--background-color-neutral-subtle,#f8f9fa);padding:0.3em;font-size:95%}.mw-parser-output .us-census-pop caption{background-color:lavender;color:black;padding-right:0.2em;padding-left:0.2em;font-size:110%;font-weight:bold;border:1px solid #a2a9b1;border-bottom:none}.mw-parser-output .us-census-pop th[scope=col]{border-bottom:1px solid black}.mw-parser-output .us-census-pop td:nth-child(2){text-align:right;padding-left:0.5em;padding-right:0}.mw-parser-output .us-census-pop td.us-census-pop-estimate{padding-left:0}.mw-parser-output .us-census-pop td:nth-child(3){padding-left:0}.mw-parser-output .us-census-pop td:nth-child(4){padding-left:0.5em;text-align:right}.mw-parser-output .us-census-pop-footnote{border-top:1px solid black;font-size:85%;text-align:center}@media(min-width:720px){.mw-parser-output .us-census-pop-right{float:right;clear:right;margin:0 0 1em 1em}.mw-parser-output .us-census-pop-left{float:left;clear:left;margin:0 1em 1em 0}.mw-parser-output .us-census-pop-center{float:none;margin-left:auto;margin-right:auto}.mw-parser-output .us-census-pop-none{float:none;margin:0 1em 1em 0}}
Census | Pop. | Note | %± |
---|---|---|---|
1850 | 965 | — | |
1860 | 8,677 | 799.2% | |
1870 | 12,018 | 38.5% | |
1880 | 15,336 | 27.6% | |
1890 | 15,643 | 2.0% | |
1900 | 18,115 | 15.8% | |
1910 | 16,347 | −9.8% | |
1920 | 16,566 | 1.3% | |
1930 | 14,903 | −10.0% | |
1940 | 14,012 | −6.0% | |
1950 | 12,601 | −10.1% | |
1960 | 10,539 | −16.4% | |
1970 | 9,737 | −7.6% | |
1980 | 9,794 | 0.6% | |
1990 | 8,338 | −14.9% | |
2000 | 8,689 | 4.2% | |
2010 | 8,457 | −2.7% | |
2020 | 7,645 | −9.6% | |
2024 (est.) | 7,656 | 0.1% | |
U.S. Decennial Census [7] 1790-1960 [8] 1900-1990 [9] 1990-2000 [10] 2010-2018 [11] 2024 [12] |
The 2020 census recorded a population of 7,645 in the county, with a population density of
Race | Num. | Perc. |
---|---|---|
White (NH) | 7,010 | 91.7% |
Black or African American (NH) | 97 | 1.26% |
Native American (NH) | 17 | 0.22% |
Asian (NH) | 39 | 0.51% |
Pacific Islander (NH) | 21 | 0.27% |
Other/Mixed (NH) | 250 | 3.3% |
Hispanic or Latino | 211 | 2.8% |
The 2010 census recorded a population of 8,457 in the county, with a population density of
At the 2000 census, [15] there were 8,689 people, 3,337 households and 2,149 families residing in the county. The population density was 16 per square mile (6.2/km2). There were 3,833 housing units at an average density of 7 per square mile (2.7/km2). The racial makeup of the county was 96.46% White, 0.98% Black or African American, 0.24% Native American, 0.63% Asian, 0.12% Pacific Islander, 0.46% from other races, and 1.12% from two or more races. 1.70% of the population were Hispanic or Latino of any race.
There were 3,337 households, of which 28.00% had children under the age of 18 living with them, 54.30% were married couples living together, 7.20% had a female householder with no husband present, and 35.60% were non-families. 30.30% of all households were made up of individuals, and 15.50% had someone living alone who was 65 years of age or older. The average household size was 2.37 and the average family size was 2.96.
23.00% of the population were under the age of 18, 16.30% from 18 to 24, 21.60% from 25 to 44, 21.50% from 45 to 64, and 17.70% who were 65 years of age or older. The median age was 36 years. For every 100 females there were 95.70 males. For every 100 females age 18 and over, there were 91.90 males.
The median household income was $27,343 and the median family income was $34,831. Males had a median income of $25,569 compared with $19,309 for females. The per capita income for the county was $14,209. About 10.90% of families and 15.50% of the population were below the poverty line, including 15.60% of those under age 18 and 13.70% of those age 65 or over.
Decatur County is considered to be the poorest in Iowa, reporting that almost 20% of its residents live in poverty. [16]
Supervisors
Steve Fulkerson
Doug Tharp
Ward Graham
Treasurer
Janet Pierson
Attorney
Alan Wilson
Auditor
Charlene Hoover
Recorder
Erica Cook
Sheriff
Chris Lane
Assessor
Justin Cornett
Engineer
Justin Savage
Clerk of Court
Traci Tharp
Public Health Administrator
Shelley Bickel
Veterans Affairs Administrator
Samantha Schaff
Conservation Director
Kayla Clausen
Mental Health Director
Kathy Lerma
Decatur County is divided into these townships:
The population ranking of the following table is based on the 2020 census of Decatur County. [2]
†county seat
Rank | City/Town/etc. | Municipal type | Population (2020 Census) |
---|---|---|---|
1 | Lamoni | City | 1,969 |
2 | † Leon | City | 1,822 |
3 | Grand River | City | 196 |
4 | Davis City | City | 179 |
5 | Van Wert | City | 178 |
6 | Decatur City | City | 175 |
7 | Garden Grove | City | 174 |
8 | Weldon (partially in Clarke County ) | City | 136 |
9 | Pleasanton | City | 32 |
10 | Le Roy | City | 11 |
Year | Republican | Democratic | Third party(ies) | |||
---|---|---|---|---|---|---|
No. | % | No. | % | No. | % | |
2024 | 2,711 | 72.51% | 957 | 25.60% | 71 | 1.90% |
2020 | 2,615 | 68.74% | 1,120 | 29.44% | 69 | 1.81% |
2016 | 2,296 | 61.49% | 1,201 | 32.16% | 237 | 6.35% |
2012 | 1,947 | 50.80% | 1,791 | 46.73% | 95 | 2.48% |
2008 | 2,020 | 49.20% | 1,986 | 48.37% | 100 | 2.44% |
2004 | 2,088 | 52.06% | 1,859 | 46.35% | 64 | 1.60% |
2000 | 1,903 | 51.31% | 1,674 | 45.13% | 132 | 3.56% |
1996 | 1,287 | 35.52% | 1,846 | 50.95% | 490 | 13.52% |
1992 | 1,316 | 33.02% | 1,866 | 46.81% | 804 | 20.17% |
1988 | 1,406 | 38.76% | 2,192 | 60.44% | 29 | 0.80% |
1984 | 2,104 | 49.60% | 2,098 | 49.46% | 40 | 0.94% |
1980 | 2,212 | 47.67% | 2,048 | 44.14% | 380 | 8.19% |
1976 | 1,932 | 41.05% | 2,698 | 57.32% | 77 | 1.64% |
1972 | 2,638 | 57.44% | 1,880 | 40.93% | 75 | 1.63% |
1968 | 2,261 | 49.28% | 2,057 | 44.83% | 270 | 5.88% |
1964 | 1,542 | 31.57% | 3,331 | 68.19% | 12 | 0.25% |
1960 | 3,039 | 55.69% | 2,411 | 44.18% | 7 | 0.13% |
1956 | 2,912 | 50.86% | 2,806 | 49.01% | 7 | 0.12% |
1952 | 3,621 | 58.71% | 2,521 | 40.87% | 26 | 0.42% |
1948 | 2,547 | 43.89% | 3,172 | 54.66% | 84 | 1.45% |
1944 | 2,934 | 46.81% | 3,316 | 52.90% | 18 | 0.29% |
1940 | 3,494 | 46.91% | 3,938 | 52.87% | 16 | 0.21% |
1936 | 3,327 | 44.40% | 4,131 | 55.12% | 36 | 0.48% |
1932 | 2,148 | 36.84% | 3,591 | 61.60% | 91 | 1.56% |
1928 | 3,942 | 59.06% | 2,675 | 40.07% | 58 | 0.87% |
1924 | 3,221 | 47.13% | 1,693 | 24.77% | 1,921 | 28.11% |
1920 | 4,187 | 61.17% | 2,592 | 37.87% | 66 | 0.96% |
1916 | 1,962 | 47.45% | 2,111 | 51.05% | 62 | 1.50% |
1912 | 1,351 | 34.39% | 1,659 | 42.24% | 918 | 23.37% |
1908 | 2,149 | 52.53% | 1,809 | 44.22% | 133 | 3.25% |
1904 | 2,430 | 58.44% | 1,548 | 37.23% | 180 | 4.33% |
1900 | 2,415 | 53.21% | 2,058 | 45.34% | 66 | 1.45% |
1896 | 2,268 | 48.46% | 2,362 | 50.47% | 50 | 1.07% |