Emmet County was created by authority of the Iowa Legislature in 1851. Enough settlers had been established in the area to organize the county in 1859.[4] The county was named for the Irish patriot Robert Emmet, who was hanged as a traitor to the British government at the age of 25.[5]
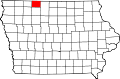
Geography
According to the United States Census Bureau, the county has a total area of 402.522 square miles (1,042.53km2), of which 395.890 square miles (1,025.35km2) is land and 6.632 square miles (17.18km2) (1.65%) is water.[6] It is the 98th largest county in Iowa by total area.[7]
It is the second-smallest county by land area in Iowa, and the fourth-smallest by total area.
As of the 2020 census, the county had a population of 9,388 and a population density of 22.9/sqmi (8.9/km2).[14]
The median age was 43.1 years. 21.9% of residents were under the age of 18 and 23.3% of residents were 65 years of age or older. For every 100 females there were 102.5 males, and for every 100 females age 18 and over there were 100.2 males age 18 and over.[14]
There were 3,972 households in the county, of which 26.6% had children under the age of 18 living in them. Of all households, 46.9% were married-couple households, 21.0% were households with a male householder and no spouse or partner present, and 24.7% were households with a female householder and no spouse or partner present. About 33.0% of all households were made up of individuals and 16.9% had someone living alone who was 65 years of age or older.[14]
There were 4,475 housing units, of which 3,972 were occupied and 11.2% were vacant. Among occupied housing units, 77.9% were owner-occupied and 22.1% were renter-occupied. The homeowner vacancy rate was 2.2% and the rental vacancy rate was 12.5%.[14]
61.5% of residents lived in urban areas, while 38.5% lived in rural areas.[15]
The 2010 census recorded a population of 10,302 in the county, with a population density of 26.0/sqmi (10.1/km2). There were 4,758 housing units, of which 4,236 were occupied.[18]
2000 census
As of the census[19] of 2000, there were 11,027 people, 4,450 households, and 2,910 families residing in the county. The population density was 28 peopleper square mile (11 people/km2). There were 4,889 housing units at an average density of 12 unitsper square mile (4.6 units/km2). The racial makeup of the county was 97.38% White, 0.24% Black or African American, 0.28% Native American, 0.30% Asian, 0.01% Pacific Islander, 1.25% from other races, and 0.54% from two or more races. 4.31% of the population were Hispanic or Latino of any race.
There were 4,450 households, out of which 27.90% had children under the age of 18 living with them, 55.00% were married couples living together, 7.80% had a female householder with no husband present, and 34.60% were non-families. 30.30% of all households were made up of individuals, and 15.30% had someone living alone who was 65 years of age or older. The average household size was 2.36 and the average family size was 2.93.
In the county, the population was spread out, with 24.20% under the age of 18, 10.10% from 18 to 24, 23.80% from 25 to 44, 22.50% from 45 to 64, and 19.40% who were 65 years of age or older. The median age was 40 years. For every 100 females there were 94.40 males. For every 100 females age 18 and over, there were 93.30 males.
The median income for a household in the county was $33,305, and the median income for a family was $41,296. Males had a median income of $27,495 versus $20,278 for females. The per capita income for the county was $16,619. About 5.20% of families and 8.20% of the population were below the poverty line, including 9.40% of those under age 18 and 9.10% of those age 65 or over.
History of Emmet County and Dickinson County, Iowa: A Record of Settlement, Organization, Progress and Achievement. In Two Volumes. Chicago: Pioneer Publishing Co., 1917.
This page is based on this Wikipedia article Text is available under the CC BY-SA 4.0 license; additional terms may apply. Images, videos and audio are available under their respective licenses.