Henry County | |
---|---|
![]() Henry County Courthouse | |
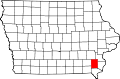
![]() Location within the U.S. state of Iowa | |
![]() Iowa's location within the U.S. | |
Coordinates: 40°59′12″N91°32′31″W / 40.986666666667°N 91.541944444444°W | |
Country | ![]() |
State | ![]() |
Founded | December 7, 1836 |
Named after | Henry Dodge |
Seat | Mount Pleasant |
Largest city | Mount Pleasant |
Area | |
• Total | 437 sq mi (1,130 km2) |
• Land | 434 sq mi (1,120 km2) |
• Water | 2.2 sq mi (6 km2) 0.5% |
Population (2020) | |
• Total | 20,482 |
• Estimate (2023) | 19,547 ![]() |
• Density | 47/sq mi (18/km2) |
Time zone | UTC−6 (Central) |
• Summer (DST) | UTC−5 (CDT) |
Congressional district | 2nd |
Website | henrycounty |
Henry County is a county located in the U.S. state of Iowa. As of the 2020 census, its population was 20,482. [1] The county seat is Mount Pleasant. [2] The county was named for General Henry Dodge, governor of Wisconsin Territory.
Henry County was formed on December 7, 1836, under the jurisdiction of Wisconsin Territory, and became a part of Iowa Territory when it was formed on July 4, 1838. [3] It was named for General Henry Dodge. [4]
The county's first courthouse was built in 1839–1840. A larger courthouse was built in 1871, and the present courthouse was raised in the 20th century, being placed into service on August 4, 1914. [5]
According to the U.S. Census Bureau, the county has a total area of 437 square miles (1,130 km2), of which 2.2 square miles (5.7 km2) (0.5%) are covered by water. [6]
Census | Pop. | Note | %± |
---|---|---|---|
1850 | 8,707 | — | |
1860 | 18,701 | 114.8% | |
1870 | 21,463 | 14.8% | |
1880 | 20,986 | −2.2% | |
1890 | 18,895 | −10.0% | |
1900 | 20,022 | 6.0% | |
1910 | 18,640 | −6.9% | |
1920 | 18,298 | −1.8% | |
1930 | 17,660 | −3.5% | |
1940 | 17,994 | 1.9% | |
1950 | 18,708 | 4.0% | |
1960 | 18,187 | −2.8% | |
1970 | 18,114 | −0.4% | |
1980 | 18,890 | 4.3% | |
1990 | 19,226 | 1.8% | |
2000 | 20,336 | 5.8% | |
2010 | 20,145 | −0.9% | |
2020 | 20,482 | 1.7% | |
2023 (est.) | 19,547 | [7] | −4.6% |
U.S. Decennial Census [8] 1790-1960 [9] 1900-1990 [10] 1990-2000 [11] 2010-2018 [12] |
The 2020 census recorded a population of 20,482 in the county, with a population density of 46.9453/sq mi (18.1257/km2); 95.23% of the population reported being of one race. The county had 8,398 housing units, of which 7,746 were occupied. [1]
Race | Number | Percentage |
---|---|---|
White (NH) | 17,643 | 86.14% |
Black or African American (NH) | 501 | 2.44% |
Native American (NH) | 60 | 0.3% |
Asian (NH) | 451 | 2.2% |
Pacific Islander (NH) | 8 | .04% |
Other or multiracial (NH) | 736 | 3.6% |
Hispanic or Latino | 1,083 | 5.3% |
The 2010 census recorded a population of 20,145 in the county, with a population density of 47.4625/sq mi (18.3254/km2). The county had 8,280 housing units, of which 7,666 were occupied. [14]
As of the 2000 census, [15] 20,336 people, 7,626 households, and 5,269 families resided in the county. The population density was 47 people per square mile (18 people/km2). The 8,246 housing units had an average density of 19 units per square mile (7.3 units/km2). The racial makeup of the county was 94.78% White, 1.49% Black or African American, 0.24% Native American, 1.88% Asian, 0.02% Pacific Islander, 0.52% from other races, and 1.07% from two or more races. About 1.26% of the population were Hispanics or Latinos of any race.
Of the 7,626 households, 32.8% had children under 18 living with them, 57.7% were married couples living together, 8.2% had a female householder with no husband present, and 30.9% were not families. About 26.8% of all households were made up of individuals, and 12.2% had someone living alone who was 65 or older. The average household size was 2.46 and the average family size was 2.98.
In the county, the age distribution was 24.7% under 18, 9.0% from 18 to 24, 29.2% from 25 to 44, 22.5% from 45 to 64, and 14.7% who were 65 or older. The median age was 37 years. For every 100 females, there were 102.5 males; for every 100 females 18 and over, there were 102.8 males.
The median income for a household in the county was $39,087, and for a family was $46,985. Males had a median income of $31,801 versus $23,075 for females. The per capita income for the county was $18,192. About 6.70% of families and 8.80% of the population were below the poverty line, including 10.30% of those under age 18 and 9.30% of those age 65 or over.
The population ranking of the following table is based on the 2020 census of Henry County. [1]
Rank | City/town/etc. | Municipal type | Population (2020 Census) |
---|---|---|---|
1 | † Mount Pleasant | City | 9,274 |
2 | New London | City | 1,910 |
3 | Winfield | City | 1,033 |
4 | Wayland | City | 964 |
5 | Salem | City | 394 |
6 | Olds | City | 192 |
7 | Hillsboro | City | 163 |
8 | Mount Union | CDP | 120 |
9 | Rome | City | 114 |
10 | Westwood | City | 101 |
11 | Coppock (partially in Jefferson and Washington Counties ) | City | 36 |
† county seat
Henry County is one of the most Republican counties in Iowa. It has backed Democratic Party candidates in only five elections for president from 1880 to the present.
Year | Republican | Democratic | Third party(ies) | |||
---|---|---|---|---|---|---|
No. | % | No. | % | No. | % | |
1896 | 2,774 | 55.83% | 2,092 | 42.10% | 103 | 2.07% |
1900 | 2,794 | 57.64% | 1,907 | 39.34% | 146 | 3.01% |
1904 | 2,647 | 64.47% | 1,259 | 30.66% | 200 | 4.87% |
1908 | 2,653 | 60.90% | 1,606 | 36.87% | 97 | 2.23% |
1912 | 1,663 | 39.12% | 1,580 | 37.17% | 1,008 | 23.71% |
1916 | 2,470 | 57.99% | 1,728 | 40.57% | 61 | 1.43% |
1920 | 5,254 | 71.91% | 1,939 | 26.54% | 113 | 1.55% |
1924 | 4,536 | 62.17% | 1,344 | 18.42% | 1,416 | 19.41% |
1928 | 5,160 | 70.90% | 2,053 | 28.21% | 65 | 0.89% |
1932 | 3,398 | 42.09% | 4,518 | 55.96% | 158 | 1.96% |
1936 | 4,480 | 54.17% | 3,542 | 42.82% | 249 | 3.01% |
1940 | 5,893 | 67.36% | 2,837 | 32.43% | 19 | 0.22% |
1944 | 5,208 | 65.12% | 2,741 | 34.27% | 49 | 0.61% |
1948 | 4,620 | 59.19% | 3,042 | 38.98% | 143 | 1.83% |
1952 | 6,424 | 71.93% | 2,438 | 27.30% | 69 | 0.77% |
1956 | 5,818 | 68.49% | 2,667 | 31.39% | 10 | 0.12% |
1960 | 5,531 | 66.03% | 2,839 | 33.89% | 7 | 0.08% |
1964 | 3,247 | 43.40% | 4,223 | 56.44% | 12 | 0.16% |
1968 | 4,613 | 60.23% | 2,532 | 33.06% | 514 | 6.71% |
1972 | 5,066 | 64.26% | 2,721 | 34.51% | 97 | 1.23% |
1976 | 3,848 | 48.79% | 3,882 | 49.22% | 157 | 1.99% |
1980 | 4,430 | 52.35% | 3,317 | 39.20% | 715 | 8.45% |
1984 | 4,516 | 56.77% | 3,377 | 42.45% | 62 | 0.78% |
1988 | 3,951 | 50.93% | 3,754 | 48.39% | 53 | 0.68% |
1992 | 3,435 | 39.81% | 3,544 | 41.08% | 1,649 | 19.11% |
1996 | 3,478 | 42.03% | 3,798 | 45.90% | 999 | 12.07% |
2000 | 4,476 | 51.62% | 3,907 | 45.06% | 288 | 3.32% |
2004 | 5,220 | 55.20% | 4,127 | 43.64% | 110 | 1.16% |
2008 | 4,822 | 51.41% | 4,349 | 46.36% | 209 | 2.23% |
2012 | 5,035 | 51.92% | 4,460 | 45.99% | 202 | 2.08% |
2016 | 5,779 | 61.45% | 2,904 | 30.88% | 721 | 7.67% |
2020 | 6,507 | 65.19% | 3,275 | 32.81% | 200 | 2.00% |
2024 | 6,439 | 67.07% | 2,995 | 31.20% | 166 | 1.73% |
School districts in the county include: [17]
Former school district: