Lists of 21st-century earthquakes

Last updated

Earthquakes of magnitude 8.0 and greater from 1900 to 2018. The apparent 3D volumes of the bubbles are linearly proportional to their respective fatalities. USGS magnitude 8 earthquakes since 1900.svg
Earthquakes of magnitude 8.0 and greater from 1900 to 2018. The apparent 3D volumes of the bubbles are linearly proportional to their respective fatalities.

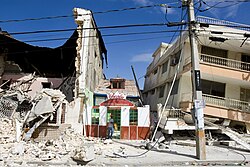
The following is a summary of significant earthquakes during the 21st century. In terms of fatalities, the 2004 Indian Ocean earthquake was the most destructive event with 227,898 confirmed fatalities, followed by the 2010 Haiti earthquake with about 160,000 fatalities, [2] the 2008 Sichuan earthquake with 87,587 fatalities, the 2005 Kashmir earthquake suffered by Pakistan with 87,351 fatalities, and the 2023 Turkey–Syria earthquakes with 62,013 fatalities.

Contents

The 2011 Tōhoku earthquake and tsunami became the costliest natural disaster, resulting in approximately $360 billion in property damage at the time, followed by the 2023 Turkey–Syria earthquakes and the 2008 Sichuan earthquake, which resulted in $163.6 billion and $150 billion in damage, respectively.

List of deadliest earthquakes

The following are with more than 1,000 deaths earthquakes of the 21st century so far.

FatalitiesMagnitudeLocationEventDate
227,8989.2–9.3Flag of Indonesia.svg Indonesia
Indian Ocean
2004 Indian Ocean earthquake and tsunami December 26, 2004
160,000 [3] 7.0Flag of Haiti.svg Haiti 2010 Haiti earthquake January 12, 2010
87,5877.9Flag of the People's Republic of China.svg China 2008 Sichuan earthquake May 12, 2008
87,3517.6Flag of Pakistan.svg Pakistan
Flag of India.svg India
2005 Kashmir earthquake October 8, 2005
62,0137.8Flag of Turkey.svg Turkey
Flag of the United Arab Republic (1958-1971), Flag of Syria (1980-2024).svg Syria
2023 Turkey–Syria earthquakes February 6, 2023
34,0006.6Flag of Iran.svg Iran 2003 Bam earthquake December 26, 2003
20,0857.7Flag of India.svg India 2001 Gujarat earthquake January 26, 2001
19,7599.0–9.1Flag of Japan.svg Japan 2011 Tōhoku earthquake and tsunami March 11, 2011
8,9647.8–7.9Flag of Nepal.svg   Nepal 2015 Nepal earthquake April 25, 2015
5,7566.4Flag of Indonesia.svg Indonesia 2006 Yogyakarta earthquake May 26, 2006
5,4567.7–7.9Flag of Myanmar.svg Myanmar
Flag of Thailand.svg Thailand
2025 Myanmar earthquake March 28, 2025
4,3407.5–7.6Flag of Indonesia.svg Indonesia 2018 Sulawesi earthquake and tsunami September 28, 2018
2,9606.9Flag of Morocco.svg Morocco 2023 Al Haouz earthquake September 8, 2023
2,6986.9Flag of the People's Republic of China.svg China 2010 Yushu earthquake April 13, 2010
2,2666.8Flag of Algeria.svg Algeria 2003 Boumerdès earthquake May 21, 2003
2,2487.2Flag of Haiti.svg Haiti 2021 Haiti earthquake August 14, 2021
2,0006.1Flag of Afghanistan (2002-2004).svg Afghanistan 2002 Hindu Kush earthquakes March 25, 2002
1,4826.3Flag of the Taliban.svg Afghanistan 2023 Herat earthquakes October 7, 2023
1,4236.0Flag of the Taliban.svg Afghanistan 2025 Afghanistan earthquake August 31, 2025
1,3138.6Flag of Indonesia.svg Indonesia 2005 Nias–Simeulue earthquake March 28, 2005
1,1636.2Flag of the Taliban.svg Afghanistan
Flag of Pakistan.svg Pakistan
June 2022 Afghanistan earthquake June 21, 2022
1,115 [4] 7.6Flag of Indonesia.svg Indonesia 2009 Sumatra earthquakes September 30, 2009

List of largest earthquakes by magnitude

RankMagnitude [5] EventLocationDate
19.2–9.3 2004 Indian Ocean earthquake Flag of Indonesia.svg Indonesia, Sumatra, Indian Ocean December 26, 2004
29.0–9.1 2011 Tōhoku earthquake Flag of Japan.svg Japan, Tōhoku, Pacific Ocean March 11, 2011
38.8 2010 Chile earthquake Flag of Chile.svg Chile, Maule February 27, 2010
8.8 2025 Kamchatka earthquake Flag of Russia.svg Russia, Kamchatka July 30, 2025
58.6 2005 Nias–Simeulue earthquake Flag of Indonesia.svg Indonesia, Sumatra March 28, 2005
8.6 2012 Indian Ocean earthquakes Flag of Indonesia.svg Indonesia, Indian Ocean April 11, 2012
78.5 2007 Bengkulu earthquakes Flag of Indonesia.svg Indonesia, Sumatra September 12, 2007

List of costliest earthquakes

Note:This only ranks immediate costs, for example, nuclear meltdown and climate and fossil fuel costs, as well as other ongoing costs from quakes are not included.

RankEventLocationMagnitudeHistoric cost (year)Adjusted for inflation (year)
1 2011 Tōhoku earthquake and tsunami Flag of Japan.svg Japan 9.0–9.1 Mw $360 billion (2013) [6] $490.9 billion (2025)
2 2023 Turkey–Syria earthquakes Flag of Turkey.svg Turkey, Flag of the United Arab Republic (1958-1971), Flag of Syria (1980-2024).svg Syria 7.8 & 7.7 Mw $163.3 billion (2023) [7] [8] $170.2 billion (2025)
3 2008 Sichuan earthquake Flag of the People's Republic of China.svg China 7.9–8.3 Mw $130 billion (2008) [9] $191.8 billion (2025)
4 2004 Chūetsu earthquake Flag of Japan.svg Japan 6.6$28 billion (2004) [10] [11] $47.1 billion (2025)
5 2010 Canterbury earthquake & 2011 Christchurch earthquake Flag of New Zealand.svg New Zealand 7.0 & 6.2$27.9 billion (2015) [12] $37.4 billion (2025)
6 2016 Kumamoto earthquakes Flag of Japan.svg Japan 7.0$24–46 billion (2016) [13] $31.8-60.9 billion (2024)
7 2011 Sikkim earthquake Flag of India.svg India 6.9$22.3 billion (2011) [14] $31.5 billion (2025)
8 2009 L'Aquila earthquake Flag of Italy.svg Italy 6.3$16 billion (2009) [15] $23.7 billion (2025)
9 2012 Northern Italy earthquakes Flag of Italy.svg Italy 6.1 [16] $15.8 billion (2012) [17] $21.9 billion (2025)
10 2010 Chile earthquake Flag of Chile.svg Chile 8.8$15–30 billion (2010) [18] $21.8–43.7 billion (2025)

Deadliest earthquakes by year

These are the deadliest earthquakes per year

YearDeadliest earthquakeFatalitiesMagnitudeLocationDate
2001 2001 Gujarat earthquake 20,0857.7Flag of India.svg India January 26
2002 2002 Hindu Kush earthquakes 1,2006.1Flag of Afghanistan (2002-2004).svg Afghanistan March 25
2003 2003 Bam earthquake 34,0006.6Flag of Iran.svg Iran December 26
2004 2004 Indian Ocean earthquake and tsunami 227,8989.2–9.3Flag of Indonesia.svg Indonesia, Indian Ocean December 26
2005 2005 Kashmir earthquake 87,3517.6Flag of Pakistan.svg Pakistan October 8
2006 2006 Yogyakarta earthquake 5,7826.4Flag of Indonesia.svg Indonesia May 26
2007 2007 Peru earthquake 5958.0Flag of Peru.svg Peru August 15
2008 2008 Sichuan earthquake 87,5877.9Flag of the People's Republic of China.svg China May 12
2009 2009 Sumatra earthquakes 1,1157.6Flag of Indonesia.svg Indonesia September 30
2010 2010 Haiti earthquake 160,0007.0Flag of Haiti.svg Haiti January 12
2011 2011 Tōhoku earthquake and tsunami 19,7599.0–9.1Flag of Japan.svg Japan March 11
2012 2012 East Azerbaijan earthquakes 3066.4 Flag of Iran.svg Iran August 11
2013 2013 Balochistan earthquakes 8257.7 Flag of Pakistan.svg Pakistan September 24
2014 2014 Ludian earthquake 6156.1Flag of the People's Republic of China.svg China August 3
2015 2015 Nepal earthquake 8,9647.8Flag of Nepal.svg   Nepal April 25
2016 2016 Ecuador earthquake 6737.8 Flag of Ecuador.svg Ecuador April 16
2017 2017 Iran–Iraq earthquake 6307.3 Flag of Iran.svg Iran November 12
2018 2018 Sulawesi earthquake and tsunami 4,3407.5 Flag of Indonesia.svg Indonesia September 28
2019 2019 Albania earthquake 516.4Flag of Albania.svg Albania November 26
2020 2020 Aegean Sea earthquake 1197.0Flag of Turkey.svg Turkey
Flag of Greece.svg Greece
October 30
2021 2021 Haiti earthquake 2,2487.2Flag of Haiti.svg Haiti August 14
2022 June 2022 Afghanistan earthquake 1,1636.2Flag of the Taliban.svg Afghanistan
Flag of Pakistan.svg Pakistan
June 21
2023 2023 Turkey–Syria earthquakes 62,0137.8Flag of Turkey.svg Turkey
Flag of the United Arab Republic (1958-1971), Flag of Syria (1980-2024).svg Syria
February 6
2024 2024 Noto earthquake 6457.5Flag of Japan.svg Japan January 1
2025 2025 Myanmar earthquake 5,4567.7Flag of Myanmar.svg Myanmar
Flag of Thailand.svg Thailand
March 28

Largest earthquakes by year

These are the largest earthquakes by magnitude per year [5]

YearMagnitudeDeathsEventLocationDatetotal M7+
2001 8.4145 2001 southern Peru earthquake Flag of Peru.svg Peru June 23Steady2.svg 16
2002 7.90 2002 Denali earthquake Flag of the United States.svg United States November 3Decrease2.svg 13
2003 8.30 2003 Tokachi earthquake Flag of Japan.svg Japan September 25Increase2.svg 15
2004 9.2–9.3227,898 2004 Indian Ocean earthquake and tsunami Flag of Indonesia.svg Indonesia, Indian Ocean December 26Increase2.svg 16
2005 8.61,313 2005 Nias–Simeulue earthquake Flag of Indonesia.svg Indonesia March 28Decrease2.svg 11
2006 8.30 2006 Kuril Islands earthquake Flag of Russia.svg Russia November 15Steady2.svg 11
2007 8.523 2007 Bengkulu earthquakes Flag of Indonesia.svg Indonesia September 12Increase2.svg 18
2008 7.987,587 2008 Sichuan earthquake Flag of the People's Republic of China.svg China May 12Decrease2.svg 12
2009 8.1192 2009 Samoa earthquake and tsunami Flag of Samoa.svg Samoa September 29Increase2.svg 17
2010 8.8525 2010 Chile earthquake Flag of Chile.svg Chile February 27Increase2.svg 22
2011 9.0–9.119,759 2011 Tōhoku earthquake and tsunami Flag of Japan.svg Japan March 11Decrease2.svg 20
2012 8.610 2012 Indian Ocean earthquakes Flag of Indonesia.svg Indonesia, Indian Ocean April 11Decrease2.svg 17
2013 8.30 2013 Okhotsk Sea earthquake Flag of Russia.svg Russia May 24Increase2.svg 19
2014 8.26 2014 Iquique earthquake Flag of Chile.svg Chile April 1Decrease2.svg 12
2015 8.314 2015 Illapel earthquake Flag of Chile.svg Chile September 16Increase2.svg 19
2016 7.90 2016 Solomon Islands earthquakes Flag of the Solomon Islands.svg Solomon Islands December 17Decrease2.svg 16
2017 8.298 2017 Chiapas earthquake Flag of Mexico.svg Mexico September 8Decrease2.svg 7
2018 8.20 2018 Fiji earthquakes Flag of Fiji.svg Fiji August 19Increase2.svg 17
2019 8.02 2019 Peru earthquake Flag of Peru.svg Peru May 26Decrease2.svg 10
2020 7.80 July 2020 Alaska Peninsula earthquake Flag of the United States.svg United States July 22Decrease2.svg 9
2021 8.20 2021 Chignik earthquake Flag of the United States.svg United States July 29Increase2.svg 19
2022 7.62 2022 Michoacán earthquake Flag of Mexico.svg Mexico September 19Decrease2.svg 11
21 2022 Papua New Guinea earthquake Flag of Papua New Guinea.svg Papua New Guinea September 10
2023 7.862,013 2023 Turkey–Syria earthquakes Flag of Turkey.svg Turkey
Flag of the United Arab Republic (1958-1971), Flag of Syria (1980-2024).svg Syria
February 6Increase2.svg 19
2024 7.5645 2024 Noto earthquake Flag of Japan.svg Japan January 1Decrease2.svg 10
2025 8.81 2025 Kamchatka earthquake Flag of Russia.svg Russia July 29Steady2.svg 10

Lists of earthquakes by decade

See also

Notes

    References

    1. "USGS: Magnitude 8 and Greater Earthquakes Since 1900". Archived from the original on November 12, 2009. Retrieved October 1, 2014.
    2. Kolbe, Athena R.; Hutson, Royce A.; Shannon, Harry; Trzcinski, Eileen; Miles, Bart; Levitz, Naomi; Puccio, Marie; James, Leah; Roger Noel, Jean; Muggah, Robert (2010). "Mortality, crime and access to basic needs before and after the Haiti earthquake: a random survey of Port-au-Prince households". Medicine, Conflict and Survival. 26 (4): 281–297. doi:10.1080/13623699.2010.535279. PMID   21314081. S2CID   26000167.
    3. Kolbe, Athena R.; Hutson, Royce A.; Shannon, Harry; Trzcinski, Eileen; Miles, Bart; Levitz, Naomi; Puccio, Marie; James, Leah; Roger Noel, Jean; Muggah, Robert (2010). "Mortality, crime and access to basic needs before and after the Haiti earthquake: a random survey of Port-au-Prince households". Medicine, Conflict and Survival. 26 (4): 281–297. doi:10.1080/13623699.2010.535279. PMID   21314081. S2CID   26000167.
    4. "Archived copy". Archived from the original on October 15, 2009. Retrieved October 14, 2009.{{cite web}}: CS1 maint: archived copy as title (link)
    5. 1 2 ISC 2022.
    6. Ferris, Elizabeth; Solís, Mireya (March 11, 2013). "Earthquake, Tsunami, Meltdown – The Triple Disaster's Impact on Japan, Impact on the World". Brookings. Retrieved January 3, 2025.
    7. "Deprem bölgesinde fatura borçlarının silinmesi için süre uzatıldı". Milat Gazetsi. August 22, 2023. Retrieved November 9, 2023.
    8. "Political failure has killed people in Syria before and after the earthquakes". Counsil for Arab-British Understanding. April 10, 2023. Retrieved April 14, 2023.
    9. Bernal, Vivian Argueta; Procee, Paul (May 12, 2012). "Four years on: What China got right when rebuilding after the Sichuan earthquake". World Bank. Archived from the original on April 14, 2024. Retrieved May 15, 2012.
    10. "Significant Earthquake Database". NOAA National Centers for Environmental Information. National Oceanic and Atmospheric Administration. Archived from the original on September 29, 2006. Retrieved May 20, 2015.
    11. Guha-Sapir, Debarati; Santos, Indhira; Borde, Alexandre (2013). The Economic Impacts of Natural Disasters. Oxford: Oxford University Press. p. 252. ISBN   978-0-19-984193-6.
    12. "The Canterbury rebuild five years on from the Christchurch earthquake" (PDF). Reserve Bank of New Zealand . February 2016. Retrieved March 5, 2024.
    13. "2016 Kumamoto Earthquake Survey Report (Preliminary)" (PDF). Asian Disaster Reduction Center. Retrieved January 27, 2024.
    14. Santanu Baruah; Sowrav Saikia; Saurabh Baruah; Pabon K. Bora; Ruben Tatevossian; J. R. Kayal (March 19, 2014). "The September 2011 Sikkim Himalaya earthquake Mw 6.9: is it a plane of detachment earthquake?". Geomatics, Natural Hazards and Risk. 7: 248–263. doi: 10.1080/19475705.2014.895963 . S2CID   128915677.
    15. "Italy Quake Reconstruction to Cost at Least $16 Billion". Fox News. April 15, 2009. Archived from the original on April 19, 2009. Retrieved October 23, 2012.
    16. "Where can I learn more about the 1906 Earthquake?". Berkeley Seismological Lab. December 11, 2011.
    17. National Geophysical Data Center / World Data Service (NGDC/WDS) (1972). "Significant Earthquake Database". Significant Earthquake Database (Data Set). National Geophysical Data Center, NOAA. doi:10.7289/V5TD9V7K.
    18. "Events and Developments (P. 3, "Calendar of events 2010: February 27")" (PDF). Yearbook. UNEP. 2011.

    Sources