This is a list of electoral division results for the Australian 1931 federal election.
Party | Candidate | Votes | % | ±% | |
---|---|---|---|---|---|
United Australia | Albert Lane | 31,226 | 46.8 | +14.4 | |
Labor (NSW) | John Eldridge | 22,669 | 33.9 | +33.9 | |
Labor | James Tully | 12,877 | 19.3 | −48.4 | |
Total formal votes | 66,772 | 97.5 | |||
Informal votes | 1,697 | 2.5 | |||
Turnout | 68,469 | 97.0 | |||
Two-party-preferred result | |||||
United Australia | Albert Lane | 35,538 | 53.2 | +20.8 | |
Labor (NSW) | John Eldridge | 31,234 | 46.8 | −20.8 | |
United Australia gain from Labor | Swing | +20.8 | |||
Party | Candidate | Votes | % | ±% | |
---|---|---|---|---|---|
Country | Harold Thorby | 22,842 | 55.3 | +55.3 | |
Labor (NSW) | Tom Watson | 10,604 | 25.7 | +25.7 | |
Labor | George Gibbons | 7,863 | 19.0 | −32.6 | |
Total formal votes | 41,309 | 97.7 | |||
Informal votes | 963 | 2.3 | |||
Turnout | 42,272 | 95.1 | |||
Two-party-preferred result | |||||
Country | Harold Thorby | 60.1 | +11.7 | ||
Labor (NSW) | Tom Watson | 39.9 | +39.9 | ||
Country gain from Labor | Swing | +11.7 | |||
Party | Candidate | Votes | % | ±% | |
---|---|---|---|---|---|
Labor (NSW) | Jock Garden | 19,352 | 47.9 | +47.9 | |
Labor | Edward Riley | 12,531 | 31.0 | −53.2 | |
United Australia | Charles Robinson | 7,986 | 19.8 | +4.0 | |
Communist | Tom Wright | 536 | 1.3 | +1.3 | |
Total formal votes | 40,405 | 95.1 | |||
Informal votes | 2,063 | 4.9 | |||
Turnout | 42,468 | 96.4 | |||
Two-party-preferred result | |||||
Labor | Edward Riley | 20,560 | 50.9 | −33.3 | |
Labor (NSW) | Jock Garden | 19,845 | 49.1 | +49.1 | |
Labor hold | Swing | −33.3 | |||
Party | Candidate | Votes | % | ±% | |
---|---|---|---|---|---|
Country | Earle Page | 29,266 | 72.3 | −27.7 | |
Labor | John Cusack | 6,417 | 15.9 | +15.9 | |
Labor (NSW) | Tom Roach | 4,790 | 11.8 | +11.8 | |
Total formal votes | 40,473 | 98.8 | |||
Informal votes | 913 | 2.2 | |||
Turnout | 41,386 | 95.7 | |||
Two-party-preferred result | |||||
Country | Earle Page | 75.3 | −24.7 | ||
Labor | John Cusack | 24.7 | +24.7 | ||
Country hold | Swing | −24.7 | |||
Party | Candidate | Votes | % | ±% | |
---|---|---|---|---|---|
Labor (NSW) | Sol Rosevear | 17,835 | 48.0 | +48.0 | |
United Australia | Sidney Massey | 10,459 | 28.2 | +6.1 | |
Labor | Ted Theodore | 7,272 | 19.6 | +19.6 | |
Ind. Nationalist | William Little | 902 | 2.4 | +2.4 | |
Communist | Jack Sylvester | 671 | 1.8 | +1.8 | |
Total formal votes | 37,139 | 92.9 | |||
Informal votes | 2,832 | 7.1 | |||
Turnout | 39,971 | 95.9 | |||
Two-party-preferred result | |||||
Labor (NSW) | Sol Rosevear | 23,784 | 64.0 | +64.0 | |
United Australia | Sidney Massey | 13,355 | 36.0 | +8.9 | |
Labor (NSW) gain from Labor | Swing | −8.9 | |||
Party | Candidate | Votes | % | ±% | |
---|---|---|---|---|---|
Labor | Arthur Blakeley | 14,581 | 40.8 | −29.4 | |
Country | Harold Campbell | 11,847 | 33.1 | +33.1 | |
Labor (NSW) | Richard Quintrell | 8,795 | 24.6 | +24.6 | |
Communist | Ted Tripp | 522 | 1.5 | +1.5 | |
Total formal votes | 35,745 | 94.8 | |||
Informal votes | 1,950 | 5.2 | |||
Turnout | 37,695 | 92.3 | |||
Two-party-preferred result | |||||
Labor | Arthur Blakeley | 22,828 | 63.9 | −6.3 | |
Country | Harold Campbell | 12,917 | 36.1 | +6.3 | |
Labor hold | Swing | −6.3 | |||
Party | Candidate | Votes | % | ±% | |
---|---|---|---|---|---|
United Australia | John Clasby | 16,977 | 44.2 | +12.6 | |
Labor (NSW) | Eddie Ward | 16,291 | 42.4 | +42.4 | |
Labor | George Buckland | 5,112 | 13.3 | -55.1 | |
Total formal votes | 38,380 | 96.2 | |||
Informal votes | 1,514 | 3.8 | |||
Turnout | 39,894 | 91.7 | |||
Two-party-preferred result | |||||
United Australia | John Clasby | 19,831 | 51.7 | +11.7 | |
Labor (NSW) | Eddie Ward | 18,549 | 48.3 | -11.7 | |
United Australia gain from Labor | Swing | +11.7 | |||
Party | Candidate | Votes | % | ±% | |
---|---|---|---|---|---|
United Australia | John Perkins | 16,888 | 41.4 | -8.5 | |
Labor | Gerald O'Sullivan | 12,619 | 30.9 | -19.2 | |
Country | Arthur Christian | 11,334 | 27.8 | +27.8 | |
Total formal votes | 40,841 | 97.6 | |||
Informal votes | 998 | 2.4 | |||
Turnout | 41,839 | 95.4 | |||
Two-party-preferred result | |||||
United Australia | John Perkins | 25,980 | 63.6 | +13.7 | |
Labor | Gerald O'Sullivan | 14,861 | 36.4 | -13.7 | |
United Australia gain from Labor | Swing | +13.7 | |||
Party | Candidate | Votes | % | ±% | |
---|---|---|---|---|---|
Country | Aubrey Abbott | 18,321 | 45.6 | +9.0 | |
Labor | Lou Cunningham | 9,995 | 24.9 | -28.8 | |
Labor (NSW) | Edward Cummins | 7,931 | 19.8 | +19.8 | |
Country | Arnold Brown | 3,900 | 9.7 | +9.7 | |
Total formal votes | 40,147 | 96.6 | |||
Informal votes | 1,419 | 3.4 | |||
Turnout | 41,566 | 93.7 | |||
Two-party-preferred result | |||||
Country | Aubrey Abbott | 59.8 | +13.5 | ||
Labor | Lou Cunningham | 40.2 | -13.5 | ||
Country gain from Labor | Swing | +13.5 | |||
Party | Candidate | Votes | % | ±% | |
---|---|---|---|---|---|
Country | Thomas Collins | 22,836 | 54.6 | +11.2 | |
Labor | Parker Moloney | 14,208 | 34.0 | −22.6 | |
Labor (NSW) | Lynden Regan | 4,771 | 11.4 | +11.4 | |
Total formal votes | 41,815 | 98.2 | |||
Informal votes | 775 | 1.8 | |||
Turnout | 42,590 | 96.4 | |||
Two-party-preferred result | |||||
Country | Thomas Collins | 57.5 | +14.1 | ||
Labor | Parker Moloney | 42.5 | −14.1 | ||
Country gain from Labor | Swing | +14.1 | |||
Party | Candidate | Votes | % | ±% | |
---|---|---|---|---|---|
Labor (NSW) | Rowley James | 23,194 | 48.1 | +48.1 | |
Independent | Arnold Bailey | 18,879 | 39.2 | +39.2 | |
Labor | Allan Howie | 4,213 | 8.7 | -91.3 | |
Communist | Harris Burnham | 1,891 | 3.9 | +3.9 | |
Total formal votes | 48,177 | 96.0 | |||
Informal votes | 2,008 | 4.0 | |||
Turnout | 50,185 | 96.4 | |||
Two-party-preferred result | |||||
Labor (NSW) | Rowley James | 57.2 | +57.2 | ||
Independent | Arnold Bailey | 42.8 | +42.8 | ||
Labor (NSW) gain from Labor | Swing | +57.2 | |||
Party | Candidate | Votes | % | ±% | |
---|---|---|---|---|---|
Labor (NSW) | Dan Mulcahy | 13,249 | 30.7 | +30.7 | |
United Australia | Dick Dein | 12,858 | 29.8 | +15.5 | |
Labor | William Long | 8,669 | 20.1 | -46.1 | |
United Australia | Alfred Bennett | 8,439 | 19.5 | +19.5 | |
Total formal votes | 43,215 | 97.0 | |||
Informal votes | 1,355 | 3.0 | |||
Turnout | 44,570 | 94.9 | |||
Two-party-preferred result | |||||
United Australia | Dick Dein | 23,404 | 54.2 | +20.4 | |
Labor (NSW) | Dan Mulcahy | 19,811 | 45.8 | +45.8 | |
United Australia gain from Labor | Swing | +20.4 | |||
Party | Candidate | Votes | % | ±% | |
---|---|---|---|---|---|
United Australia | John Lawson | 19,381 | 49.1 | +14.7 | |
Labor | Ben Chifley | 11,085 | 28.1 | -37.5 | |
Labor (NSW) | Tony Luchetti | 8,539 | 21.6 | +21.6 | |
Communist | Robert Deveney | 499 | 1.3 | +1.3 | |
Total formal votes | 39,504 | 96.1 | |||
Informal votes | 1,582 | 3.9 | |||
Turnout | 41,086 | 94.8 | |||
Two-party-preferred result | |||||
United Australia | John Lawson | 19,980 | 50.6 | +16.2 | |
Labor | Ben Chifley | 19,524 | 49.4 | -16.2 | |
United Australia gain from Labor | Swing | +16.2 | |||
Party | Candidate | Votes | % | ±% | |
---|---|---|---|---|---|
United Australia | William Holman | 26,075 | 41.2 | +25.1 | |
United Australia | Mac Abbott | 15,741 | 24.9 | +24.9 | |
Labor (NSW) | Charles Hankin | 14,300 | 22.6 | +22.6 | |
Labor | James Catts | 7,098 | 11.2 | -40.5 | |
Total formal votes | 63,214 | 96.2 | |||
Informal votes | 2,469 | 3.8 | |||
Turnout | 65,683 | 96.2 | |||
Two-party-preferred result | |||||
United Australia | William Holman | 41,886 | 66.3 | +22.7 | |
Labor (NSW) | Charles Hankin | 21,328 | 33.7 | +33.7 | |
United Australia gain from Labor | Swing | +22.7 | |||
Party | Candidate | Votes | % | ±% | |
---|---|---|---|---|---|
Country | Victor Thompson | 26,555 | 66.6 | +12.0 | |
Independent | Angus Campbell | 13,295 | 33.4 | +33.4 | |
Total formal votes | 39,850 | 95.4 | |||
Informal votes | 1,913 | 4.6 | |||
Turnout | 41,763 | 94.6 | |||
Country hold | Swing | +12.0 | |||
Party | Candidate | Votes | % | ±% | |
---|---|---|---|---|---|
Labor | David Watkins | 15,290 | 30.5 | -69.5 | |
Labor (NSW) | James Kidd | 13,233 | 26.4 | +26.4 | |
All for Australia | Rowland Clark | 10,726 | 21.4 | +21.4 | |
Independent Labor | Walter Skelton | 10,037 | 20.0 | +20.0 | |
Communist | Jack Simpson | 910 | 1.8 | +1.8 | |
Total formal votes | 50,196 | 95.0 | |||
Informal votes | 2,665 | 5.0 | |||
Turnout | 52,861 | 96.6 | |||
Two-party-preferred result | |||||
Labor | David Watkins | 32,194 | 64.1 | -35.9 | |
All for Australia | Rowland Clark | 18,002 | 35.9 | +35.9 | |
Labor hold | Swing | -35.9 | |||
Party | Candidate | Votes | % | ±% | |
---|---|---|---|---|---|
United Australia | Billy Hughes | 22,317 | 40.8 | +1.3 | |
United Australia | Norman Cowper | 19,724 | 36.0 | +36.0 | |
Labor (NSW) | Norman Nelson | 12,696 | 23.2 | +23.2 | |
Total formal votes | 54,737 | 98.3 | |||
Informal votes | 920 | 1.7 | |||
Turnout | 55,657 | 94.2 | |||
Two-party-preferred result | |||||
United Australia | Billy Hughes | 57.5 | +23.6 | ||
United Australia | Norman Cowper | 42.5 | +42.5 | ||
United Australia gain from Independent | Swing | +23.6 | |||
Party | Candidate | Votes | % | ±% | |
---|---|---|---|---|---|
United Australia | Charles Marr | 34,502 | 59.9 | +17.7 | |
Labor (NSW) | Herbert Garden | 16,483 | 28.6 | +28.6 | |
Labor | William Gibbs | 6,636 | 11.5 | -46.3 | |
Total formal votes | 57,621 | 97.5 | |||
Informal votes | 1,460 | 2.5 | |||
Turnout | 59,081 | 94.2 | |||
Two-party-preferred result | |||||
United Australia | Charles Marr | 62.8 | +20.6 | ||
Labor (NSW) | Herbert Garden | 37.2 | +37.2 | ||
United Australia hold | Swing | +20.6 | |||
Party | Candidate | Votes | % | ±% | |
---|---|---|---|---|---|
United Australia | Frederick Stewart | 39,620 | 62.0 | +15.3 | |
Labor (NSW) | Valentine Patterson | 13,727 | 21.5 | +21.5 | |
Labor | Albert Rowe | 9,456 | 14.8 | -38.5 | |
Independent | Anwoth Brown | 1,143 | 1.8 | +1.8 | |
Total formal votes | 63,937 | 96.5 | |||
Informal votes | 2,313 | 3.5 | |||
Turnout | 66,250 | 95.0 | |||
Two-party-preferred result | |||||
United Australia | Frederick Stewart | 66.2 | +19.5 | ||
Labor (NSW) | Valentine Patterson | 33.8 | +33.8 | ||
United Australia gain from Labor | Swing | +19.5 | |||
Party | Candidate | Votes | % | ±% | |
---|---|---|---|---|---|
Labor (NSW) | Joe Gander | 26,032 | 36.9 | +36.9 | |
United Australia | Robert Uebel | 24,717 | 35.1 | +9.7 | |
Labor | Percy Coleman | 19,724 | 28.0 | -46.6 | |
Total formal votes | 70,473 | 97.3 | |||
Informal votes | 1,962 | 2.7 | |||
Turnout | 72,435 | 97.7 | |||
Two-party-preferred result | |||||
Labor (NSW) | Joe Gander | 38,974 | 55.3 | +55.3 | |
United Australia | Robert Uebel | 31,499 | 44.7 | +19.3 | |
Labor (NSW) gain from Labor | Swing | +55.3 | |||
Party | Candidate | Votes | % | ±% | |
---|---|---|---|---|---|
Country | Roland Green | 14,342 | 35.2 | -20.5 | |
Country | Robert Gibson | 10,874 | 26.7 | +26.7 | |
Independent | Jim Fredericks | 8,383 | 20.5 | +20.5 | |
Country | Percy Tighe | 5,830 | 14.3 | +14.3 | |
Country | Leonard Greening | 1,370 | 3.4 | +3.4 | |
Total formal votes | 40,799 | 93.7 | |||
Informal votes | 2,736 | 6.3 | |||
Turnout | 43,535 | 94.5 | |||
Two-party-preferred result | |||||
Country | Roland Green | 20,562 | 50.4 | +50.4 | |
Country | Robert Gibson | 20,237 | 49.6 | +49.6 | |
Country hold | Swing | +50.4 | |||
Party | Candidate | Votes | % | ±% | |
---|---|---|---|---|---|
Country | Robert Hankinson | 14,778 | 34.3 | +11.2 | |
Country | Horace Nock | 13,518 | 31.3 | +31.3 | |
Labor (NSW) | John Heiss | 8,882 | 20.6 | +20.6 | |
Labor | Louis Levy | 5,951 | 13.8 | -31.8 | |
Total formal votes | 43,129 | 95.8 | |||
Informal votes | 1,875 | 4.2 | |||
Turnout | 45,004 | 94.0 | |||
Two-party-preferred result | |||||
Country | Horace Nock | 22,121 | 51.3 | -3.1 | |
Country | Robert Hankinson | 21,008 | 48.7 | +48.7 | |
Country hold | Swing | -3.1 | |||
Party | Candidate | Votes | % | ±% | |
---|---|---|---|---|---|
United Australia | Sydney Gardner | 21,669 | 52.6 | +1.1 | |
Independent Country | William Fleming | 8,246 | 20.0 | +20.0 | |
Labor (NSW) | Peter Robb | 7,300 | 17.7 | +17.7 | |
Labor | Wilfred Turnbull | 4,014 | 9.7 | -38.8 | |
Total formal votes | 41,229 | 96.7 | |||
Informal votes | 1,546 | 3.6 | |||
Turnout | 42,775 | 96.2 | |||
Two-party-preferred result | |||||
United Australia | Sydney Gardner | 72.5 | +21.0 | ||
Labor (NSW) | Peter Robb | 27.5 | +27.5 | ||
United Australia hold | Swing | +21.0 | |||
Party | Candidate | Votes | % | ±% | |
---|---|---|---|---|---|
United Australia | John Jennings | 26,711 | 49.2 | +15.5 | |
Labor (NSW) | John Stewart | 17,071 | 31.4 | +31.4 | |
Labor | Edward Riley | 10,512 | 19.4 | -34.9 | |
Total formal votes | 54,294 | 97.5 | |||
Informal votes | 1,365 | 2.5 | |||
Turnout | 55,659 | 92.6 | |||
Two-party-preferred result | |||||
United Australia | John Jennings | 29,897 | 55.1 | +21.4 | |
Labor (NSW) | John Stewart | 24,397 | 44.9 | +44.9 | |
United Australia gain from Labor | Swing | +21.4 | |||
Party | Candidate | Votes | % | ±% | |
---|---|---|---|---|---|
United Australia | Archdale Parkhill | 29,180 | 59.3 | +47.4 | |
United Australia | Walter Duncan | 19,989 | 40.7 | +40.7 | |
Total formal votes | 49,169 | 97.6 | |||
Informal votes | 1,187 | 2.4 | |||
Turnout | 50,356 | 95.8 | |||
United Australia hold | Swing | +47.4 | |||
Party | Candidate | Votes | % | ±% | |
---|---|---|---|---|---|
United Australia | Eric Harrison | 35,460 | 65.8 | +65.8 | |
United Australia | Walter Marks | 18,434 | 34.2 | +34.2 | |
Total formal votes | 53,894 | 94.2 | |||
Informal votes | 3,293 | 5.8 | |||
Turnout | 57,187 | 92.8 | |||
United Australia gain from Ind. Nationalist | Swing | +58.3 | |||
Party | Candidate | Votes | % | ±% | |
---|---|---|---|---|---|
Country | Walter McNicoll | 21,762 | 47.9 | +47.9 | |
Labor (NSW) | Bert Lazzarini | 18,948 | 41.7 | +41.7 | |
Labor | Ernest Tully | 4,254 | 9.4 | −56.0 | |
Ind. United Australia | Mont Sheppard | 496 | 1.1 | +1.1 | |
Total formal votes | 45,460 | 96.4 | |||
Informal votes | 1,679 | 3.6 | |||
Turnout | 47,139 | 94.6 | |||
Two-candidate-preferred result | |||||
Country | Walter McNicoll | 23,518 | 51.7 | +51.7 | |
Labor (NSW) | Bert Lazzarini | 21,942 | 48.3 | +48.3 | |
Country gain from Labor | Swing | +17.1 | |||
Party | Candidate | Votes | % | ±% | |
---|---|---|---|---|---|
Labor (NSW) | Jack Beasley | 19,768 | 63.9 | +63.9 | |
United Australia | Arthur Butterell | 6,579 | 21.3 | +7.8 | |
Labor | James Donaldson | 4,596 | 14.9 | -71.6 | |
Total formal votes | 30,943 | 95.8 | |||
Informal votes | 1,372 | 4.2 | |||
Turnout | 32,315 | 92.2 | |||
Two-party-preferred result | |||||
Labor (NSW) | Jack Beasley | 75.1 | +75.1 | ||
United Australia | Arthur Butterell | 24.9 | +11.4 | ||
Labor (NSW) gain from Labor | Swing | +11.4 | |||
Party | Candidate | Votes | % | ±% | |
---|---|---|---|---|---|
United Australia | Thomas White | 41,703 | 75.5 | +17.0 | |
Labor | Edward Stewart | 11,409 | 20.6 | −20.9 | |
Democratic | James Denyer | 2,147 | 3.9 | +3.9 | |
Total formal votes | 55,259 | 97.9 | |||
Informal votes | 1,187 | 2.1 | |||
Turnout | 56,446 | 97.1 | |||
Two-party-preferred result | |||||
United Australia | Thomas White | 76.5 | +18.0 | ||
Labor | Edward Stewart | 23.5 | −18.0 | ||
United Australia hold | Swing | +18.0 | |||
Party | Candidate | Votes | % | ±% | |
---|---|---|---|---|---|
United Australia | Charles McGrath | 19,260 | 49.0 | +6.4 | |
Labor | Stewart Miller | 13,409 | 34.1 | −23.3 | |
Country | Henry Bromfield | 6,608 | 16.8 | +16.8 | |
Total formal votes | 39,277 | 98.7 | |||
Informal votes | 505 | 1.3 | |||
Turnout | 39,782 | 97.6 | |||
Two-party-preferred result | |||||
United Australia | Charles McGrath | 24,859 | 63.3 | +20.7 | |
Labor | Stewart Miller | 14,418 | 36.7 | −20.7 | |
United Australia gain from Labor | Swing | +20.7 | |||
Party | Candidate | Votes | % | ±% | |
---|---|---|---|---|---|
United Australia | Samuel Dennis | 30,148 | 48.8 | +24.6 | |
Labor | Frank Brennan | 28,198 | 45.6 | -30.2 | |
Democratic | Frank Blake | 2,323 | 3.8 | +3.8 | |
Communist | Jim Hannan | 1,156 | 1.9 | +1.9 | |
Total formal votes | 61,825 | 96.0 | |||
Informal votes | 2,606 | 4.0 | |||
Turnout | 64,431 | 94.9 | |||
Two-party-preferred result | |||||
United Australia | Samuel Dennis | 31,393 | 50.8 | +26.6 | |
Labor | Frank Brennan | 30,432 | 49.2 | -26.6 | |
United Australia gain from Labor | Swing | +26.6 | |||
Party | Candidate | Votes | % | ±% | |
---|---|---|---|---|---|
United Australia | Eric Harrison | 23,710 | 59.5 | +14.6 | |
Labor | Richard Keane | 16,167 | 40.5 | −14.6 | |
Total formal votes | 39,877 | 98.7 | |||
Informal votes | 544 | 1.3 | |||
Turnout | 40,421 | 96.2 | |||
United Australia gain from Labor | Swing | +14.6 | |||
Party | Candidate | Votes | % | ±% | |
---|---|---|---|---|---|
Labor | Frank Anstey | 26,948 | 47.7 | −29.7 | |
United Australia | Roy Ivey | 25,572 | 45.2 | +22.6 | |
Independent | Walter Norman | 2,357 | 4.2 | +4.2 | |
Communist | James Adie | 1,644 | 2.9 | +2.9 | |
Total formal votes | 56,521 | 95.4 | |||
Informal votes | 2,731 | 4.6 | |||
Turnout | 59,252 | 97.3 | |||
Two-party-preferred result | |||||
Labor | Frank Anstey | 28,897 | 51.1 | −26.3 | |
United Australia | Roy Ivey | 27,624 | 48.9 | +26.3 | |
Labor hold | Swing | −26.3 | |||
Party | Candidate | Votes | % | ±% | |
---|---|---|---|---|---|
Country | William Gibson | 25,985 | 62.9 | +15.0 | |
Labor | Richard Crouch | 15,321 | 37.1 | −15.0 | |
Total formal votes | 41,306 | 98.7 | |||
Informal votes | 540 | 1.3 | |||
Turnout | 41,846 | 95.7 | |||
Country gain from Labor | Swing | +15.0 | |||
Party | Candidate | Votes | % | ±% | |
---|---|---|---|---|---|
United Australia | Richard Casey | 18,724 | 37.0 | −7.0 | |
Labor | Arthur Lewis | 17,623 | 34.9 | −21.1 | |
Ind. United Australia | John Lister | 14,191 | 28.1 | +28.1 | |
Total formal votes | 50,538 | 98.5 | |||
Informal votes | 776 | 1.5 | |||
Turnout | 51,314 | 93.9 | |||
Two-party-preferred result | |||||
United Australia | Richard Casey | 30,613 | 60.6 | +16.6 | |
Labor | Arthur Lewis | 19,925 | 39.4 | −16.6 | |
United Australia gain from Labor | Swing | +16.6 | |||
Party | Candidate | Votes | % | ±% | |
---|---|---|---|---|---|
Country | William Hill | 16,116 | 39.7 | -14.0 | |
Independent Country | Galloway Stewart | 14,278 | 35.2 | +35.2 | |
Independent Country | William Moss | 8,020 | 19.8 | +19.8 | |
Ind. United Australia | John Fitzpatrick | 2,168 | 5.3 | +5.3 | |
Total formal votes | 40,582 | 96.7 | |||
Informal votes | 1,376 | 3.3 | |||
Turnout | 41,958 | 95.6 | |||
Two-party-preferred result | |||||
Country | William Hill | 21,278 | 52.4 | -1.3 | |
Independent | Galloway Stewart | 19,304 | 47.6 | +47.6 | |
Country hold | Swing | -1.3 | |||
Party | Candidate | Votes | % | ±% | |
---|---|---|---|---|---|
United Australia | George Maxwell | 28,586 | 67.7 | +29.3 | |
Labor | John McKenna | 11,508 | 27.2 | +27.2 | |
Independent | David Robertson | 2,159 | 5.1 | +5.1 | |
Total formal votes | 42,253 | 98.0 | |||
Informal votes | 880 | 2.0 | |||
Turnout | 43,133 | 93.1 | |||
Two-party-preferred result | |||||
United Australia | George Maxwell | 70.3 | +21.7 | ||
Labor | John McKenna | 29.7 | +29.7 | ||
United Australia gain from Ind. Nationalist | Swing | +21.7 | |||
Party | Candidate | Votes | % | ±% | |
---|---|---|---|---|---|
United Australia | Stanley Bruce | 45,304 | 68.3 | +20.2 | |
Labor | Arthur Haywood | 21,004 | 31.7 | -16.5 | |
Total formal votes | 66,308 | 97.9 | |||
Informal votes | 1,418 | 2.1 | |||
Turnout | 67,726 | 95.7 | |||
United Australia gain from Labor | Swing | +18.5 | |||
Party | Candidate | Votes | % | ±% | |
---|---|---|---|---|---|
Country | Thomas Paterson | unopposed | |||
Country hold | Swing | ||||
Party | Candidate | Votes | % | ±% | |
---|---|---|---|---|---|
United Australia | Henry Gullett | 56,404 | 75.0 | +26.4 | |
Labor | Fred Katz | 18,835 | 25.0 | -20.4 | |
Total formal votes | 75,239 | 97.4 | |||
Informal votes | 1,985 | 2.6 | |||
Turnout | 77,224 | 94.2 | |||
United Australia hold | Swing | +23.8 | |||
Party | Candidate | Votes | % | ±% | |
---|---|---|---|---|---|
United Australia | William Hutchinson | 18,149 | 45.0 | +39.4 | |
Labor | Paul Jones | 14,190 | 35.2 | −14.2 | |
Country | Arthur Walter | 8,011 | 19.9 | −25.2 | |
Total formal votes | 40,350 | 98.2 | |||
Informal votes | 721 | 1.8 | |||
Turnout | 41,071 | 95.1 | |||
Two-party-preferred result | |||||
United Australia | William Hutchinson | 25,405 | 63.0 | +63.0 | |
Labor | Paul Jones | 14,945 | 37.0 | −14.4 | |
United Australia gain from Labor | Swing | +14.4 | |||
Party | Candidate | Votes | % | ±% | |
---|---|---|---|---|---|
United Australia | John Latham | 50,590 | 76.5 | +21.3 | |
Labor | Cornelius Loughnan | 15,557 | 23.5 | −21.3 | |
Total formal votes | 66,147 | 98.2 | |||
Informal votes | 1,221 | 1.8 | |||
Turnout | 67,368 | 96.7 | |||
United Australia hold | Swing | +21.3 | |||
Party | Candidate | Votes | % | ±% | |
---|---|---|---|---|---|
United Australia | James Fenton | 26,605 | 49.3 | +22.5 | |
Labor | William Beckett | 26,242 | 48.6 | -24.6 | |
Democratic | William Scott | 1,094 | 2.0 | +2.0 | |
Total formal votes | 53,941 | 97.5 | |||
Informal votes | 1,358 | 2.5 | |||
Turnout | 55,299 | 98.1 | |||
Two-party-preferred result | |||||
United Australia | James Fenton | 27,195 | 50.4 | +23.6 | |
Labor | William Beckett | 26,746 | 49.6 | -23.6 | |
United Australia gain from Labor | Swing | +23.6 | |||
Party | Candidate | Votes | % | ±% | |
---|---|---|---|---|---|
Labor | William Maloney | 22,224 | 62.0 | -38.0 | |
United Australia | Israel Smith | 13,599 | 38.0 | +38.0 | |
Total formal votes | 35,823 | 96.3 | |||
Informal votes | 1,357 | 3.6 | |||
Turnout | 37,180 | 93.6 | |||
Labor hold | Swing | -38.0 | |||
Party | Candidate | Votes | % | ±% | |
---|---|---|---|---|---|
Labor | Jack Holloway | 22,901 | 56.4 | -43.6 | |
United Australia | William Orr | 12,319 | 30.3 | +30.3 | |
Ind. United Australia | William Howey | 3,945 | 9.7 | +9.7 | |
Communist | Thomas le Huray | 823 | 2.0 | +2.0 | |
Lang Labor | Thomas Houston | 448 | 1.1 | +1.1 | |
Independent | Noble Kerby | 154 | 0.4 | +0.4 | |
Total formal votes | 40,590 | 94.3 | |||
Informal votes | 2,445 | 5.7 | |||
Turnout | 43,035 | 95.2 | |||
Two-party-preferred result | |||||
Labor | Jack Holloway | 60.3 | -39.7 | ||
United Australia | William Orr | 39.7 | +39.7 | ||
Labor hold | Swing | -39.7 | |||
Party | Candidate | Votes | % | ±% | |
---|---|---|---|---|---|
United Australia | Thomas Scholfield | 15,205 | 35.7 | -12.3 | |
Labor | John McNeill | 14,772 | 34.7 | -17.3 | |
Country | Arthur Rodgers | 12,627 | 29.6 | +29.6 | |
Total formal votes | 42,604 | 98.9 | |||
Informal votes | 469 | 1.1 | |||
Turnout | 43,073 | 96.8 | |||
Two-party-preferred result | |||||
United Australia | Thomas Scholfield | 26,546 | 62.3 | +14.3 | |
Labor | John McNeill | 16,058 | 37.7 | -14.3 | |
United Australia gain from Labor | Swing | +14.3 | |||
Party | Candidate | Votes | % | ±% | |
---|---|---|---|---|---|
United Australia | William Morgan | 12,763 | 28.0 | +28.0 | |
Independent | Alexander Dowsley | 12,584 | 27.6 | +27.6 | |
Country | Hugh McClelland | 12,071 | 26.5 | +4.4 | |
Country | Samuel Lockhart | 5,233 | 11.5 | +11.5 | |
Country | William McCann | 2,906 | 6.4 | +6.4 | |
Total formal votes | 45,557 | 95.0 | |||
Informal votes | 2,377 | 5.0 | |||
Turnout | 47,934 | 95.8 | |||
Two-party-preferred result | |||||
Country | Hugh McClelland | 28,137 | 61.8 | +21.8 | |
Independent | Alexander Dowsley | 17,420 | 38.2 | +38.2 | |
Country gain from Country Progressive | Swing | +21.8 | |||
Party | Candidate | Votes | % | ±% | |
---|---|---|---|---|---|
Labor | James Scullin | 22,843 | 59.9 | -40.1 | |
United Australia | John Davis | 13,284 | 34.9 | +34.9 | |
Communist | Ernie Thornton | 1,095 | 2.9 | +2.9 | |
Single Tax League | Patrick Branagan | 895 | 2.3 | +2.3 | |
Total formal votes | 38,117 | 93.8 | |||
Informal votes | 2,502 | 6.2 | |||
Turnout | 40,619 | 94.2 | |||
Two-party-preferred result | |||||
Labor | James Scullin | 63.3 | -36.7 | ||
United Australia | John Davis | 36.7 | +36.7 | ||
Labor hold | Swing | -36.7 | |||
Party | Candidate | Votes | % | ±% | |
---|---|---|---|---|---|
United Australia | Donald Cameron | 19,965 | 48.9 | −3.5 | |
Labor | George Lawson | 19,152 | 46.9 | −0.7 | |
Lang Labor | Hugh Talty | 1,725 | 4.2 | +4.2 | |
Total formal votes | 40,842 | 97.7 | |||
Informal votes | 957 | 2.3 | |||
Turnout | 41,799 | 92.7 | |||
Two-party-preferred result | |||||
Labor | George Lawson | 20,691 | 50.7 | +3.1 | |
United Australia | Donald Cameron | 20,151 | 49.3 | −3.1 | |
Labor gain from United Australia | Swing | +3.1 | |||
Party | Candidate | Votes | % | ±% | |
---|---|---|---|---|---|
Labor | Frank Forde | 28,449 | 58.8 | +5.4 | |
Country | Robert Staines | 19,944 | 41.2 | +41.2 | |
Total formal votes | 48,393 | 97.1 | |||
Informal votes | 1,455 | 2.9 | |||
Turnout | 49,848 | 95.6 | |||
Labor hold | Swing | +5.4 | |||
Party | Candidate | Votes | % | ±% | |
---|---|---|---|---|---|
Independent | Sir Littleton Groom | 23,597 | 54.7 | +31.2 | |
United Australia | Arthur Morgan | 15,212 | 35.2 | -11.4 | |
Independent | Herbert Yeates | 4,365 | 10.1 | +10.1 | |
Total formal votes | 43,174 | 98.0 | |||
Informal votes | 879 | 2.0 | |||
Turnout | 44,053 | 97.0 | |||
Two-party-preferred result | |||||
Independent | Sir Littleton Groom | 59.8 | +59.8 | ||
United Australia | Arthur Morgan | 40.2 | -17.7 | ||
Independent gain from United Australia | Swing | +17.7 | |||
Party | Candidate | Votes | % | ±% | |
---|---|---|---|---|---|
Labor | George Martens | 31,866 | 56.3 | +3.5 | |
United Australia | Grosvenor Francis | 24,733 | 43.7 | -3.5 | |
Total formal votes | 56,599 | 95.8 | |||
Informal votes | 2,473 | 4.2 | |||
Turnout | 59,072 | 92.9 | |||
Labor hold | Swing | +3.5 | |||
Party | Candidate | Votes | % | ±% | |
---|---|---|---|---|---|
Labor | Darby Riordan | 17,605 | 60.2 | +7.1 | |
United Australia | Jim Clarke | 11,655 | 39.8 | -7.1 | |
Total formal votes | 29,260 | 96.3 | |||
Informal votes | 1,112 | 3.7 | |||
Turnout | 30,372 | 88.3 | |||
Labor hold | Swing | +7.1 | |||
Party | Candidate | Votes | % | ±% | |
---|---|---|---|---|---|
United Australia | George Mackay | 30,422 | 53.8 | -13.3 | |
Independent Labor | Alexander Costello | 18,988 | 33.6 | +33.6 | |
Social Credit | Frank Mason | 7,185 | 12.7 | +12.7 | |
Total formal votes | 56,595 | 97.0 | |||
Informal votes | 1,769 | 3.0 | |||
Turnout | 58,364 | 95.6 | |||
Two-party-preferred result | |||||
United Australia | George Mackay | 60.2 | -6.9 | ||
Independent Labor | Alexander Costello | 39.8 | +39.8 | ||
United Australia hold | Swing | -6.9 | |||
Party | Candidate | Votes | % | ±% | |
---|---|---|---|---|---|
Country | James Hunter | 16,278 | 51.8 | -3.1 | |
Labor | Myles Ferricks | 15,119 | 48.2 | +3.1 | |
Total formal votes | 31,397 | 98.2 | |||
Informal votes | 564 | 1.8 | |||
Turnout | 31,961 | 92.2 | |||
Country hold | Swing | -3.1 | |||
Party | Candidate | Votes | % | ±% | |
---|---|---|---|---|---|
United Australia | Josiah Francis | unopposed | |||
United Australia hold | Swing | ||||
Party | Candidate | Votes | % | ±% | |
---|---|---|---|---|---|
Labor | Francis Baker | 29,252 | 54.3 | +4.4 | |
United Australia | James Bayley | 23,563 | 43.7 | -6.4 | |
Lang Labor | Frank Pforr | 1,094 | 2.0 | +2.0 | |
Total formal votes | 53,909 | 97.3 | |||
Informal votes | 1,480 | 2.7 | |||
Turnout | 55,389 | 95.6 | |||
Two-party-preferred result | |||||
Labor | Francis Baker | 55.8 | +5.9 | ||
United Australia | James Bayley | 44.2 | -5.9 | ||
Labor gain from United Australia | Swing | +5.9 | |||
Party | Candidate | Votes | % | ±% | |
---|---|---|---|---|---|
Country | Bernard Corser | unopposed | |||
Country hold | Swing | ||||
Party | Candidate | Votes | % | ±% | |
---|---|---|---|---|---|
Emergency Committee | Fred Stacey | 15,907 | 42.1 | +3.5 | |
Labor | George Edwin Yates | 11,193 | 29.6 | −31.8 | |
Lyons Latham | Crawford Vaughan | 4,500 | 11.9 | +11.9 | |
Lang Labor | Tom Howard | 3,058 | 8.1 | +8.1 | |
Independent | Agnes Goode | 2,449 | 6.5 | +6.5 | |
Communist | John Zwolsman | 655 | 1.7 | +1.7 | |
Total formal votes | 37,762 | 90.7 | |||
Informal votes | 3,872 | 9.3 | |||
Turnout | 41,634 | 94.6 | |||
Two-party-preferred result | |||||
Emergency Committee | Fred Stacey | 22,523 | 59.6 | +21.0 | |
Labor | George Edwin Yates | 15,239 | 40.4 | −21.0 | |
Emergency Committee gain from Labor | Swing | +21.0 | |||
Party | Candidate | Votes | % | ±% | |
---|---|---|---|---|---|
Independent | Moses Gabb | 37,719 | 76.8 | +31.5 | |
Labor | David Fraser | 11,390 | 23.2 | −31.5 | |
Total formal votes | 49,109 | 96.4 | |||
Informal votes | 1,843 | 3.6 | |||
Turnout | 50,952 | 96.7 | |||
Independent gain from Labor | Swing | +31.5 | |||
Party | Candidate | Votes | % | ±% | |
---|---|---|---|---|---|
Emergency Committee | Malcolm Cameron | 50,597 | 64.0 | +12.8 | |
Labor | Cyril Hasse | 10,904 | 22.8 | −26.0 | |
Independent | Percy Spehr | 6,291 | 13.2 | +13.2 | |
Total formal votes | 47,792 | 94.5 | |||
Informal votes | 2,765 | 5.5 | |||
Turnout | 50,557 | 96.3 | |||
Two-party-preferred result | |||||
Emergency Committee | Malcolm Cameron | 70.7 | +19.5 | ||
Labor | Cyril Hasse | 29.3 | −19.5 | ||
Emergency Committee hold | Swing | +19.5 | |||
Party | Candidate | Votes | % | ±% | |
---|---|---|---|---|---|
Emergency Committee | John Price | 30,440 | 68.5 | +24.1 | |
Labor | Cecil Skitch | 10,016 | 22.5 | −33.1 | |
Single Tax League | Sam Lindsay | 3,978 | 9.0 | +9.0 | |
Total formal votes | 44,434 | 94.6 | |||
Informal votes | 2,530 | 5.4 | |||
Turnout | 46,964 | 96.1 | |||
Two-party-preferred result | |||||
Emergency Committee | John Price | 74.0 | +29.6 | ||
Labor | Cecil Skitch | 26.0 | −29.6 | ||
Emergency Committee gain from Labor | Swing | +29.6 | |||
Party | Candidate | Votes | % | ±% | |
---|---|---|---|---|---|
Emergency Committee | Philip McBride | 16,372 | 48.1 | +48.1 | |
Labor | Andrew Lacey | 12,691 | 37.3 | -22.3 | |
Single Tax League | James Hodgson | 3,674 | 10.8 | +10.8 | |
Independent | Alfred Barns | 1,292 | 3.8 | +3.8 | |
Total formal votes | 34,029 | 95.0 | |||
Informal votes | 1,805 | 5.0 | |||
Turnout | 35,834 | 93.9 | |||
Two-party-preferred result | |||||
Emergency Committee | Philip McBride | 19,560 | 57.5 | +57.5 | |
Labor | Andrew Lacey | 14,469 | 42.5 | -17.1 | |
Emergency Committee gain from Labor | Swing | +17.1 | |||
Party | Candidate | Votes | % | ±% | |
---|---|---|---|---|---|
Labor | Norman Makin | 28,047 | 54.7 | -45.3 | |
Emergency Committee | Ernest Evans | 20,657 | 40.3 | +40.3 | |
Lang Labor | Sid O'Flaherty | 2,524 | 4.9 | +4.9 | |
Total formal votes | 51,228 | 95.7 | |||
Informal votes | 2,301 | 4.3 | |||
Turnout | 53,529 | 96.2 | |||
Two-party-preferred result | |||||
Labor | Norman Makin | 58.4 | -41.6 | ||
Emergency Committee | Ernest Evans | 41.6 | +41.6 | ||
Labor hold | Swing | -41.6 | |||
Party | Candidate | Votes | % | ±% | |
---|---|---|---|---|---|
Emergency Committee | Charles Hawker | 22,596 | 65.3 | +29.2 | |
Independent Country | Maurice Collins | 12,030 | 34.7 | +34.7 | |
Total formal votes | 34,626 | 95.4 | |||
Informal votes | 1,674 | 4.6 | |||
Turnout | 36,300 | 96.9 | |||
Emergency Committee hold | Swing | +8.4 | |||
Party | Candidate | Votes | % | ±% | |
---|---|---|---|---|---|
Country | John Prowse | unopposed | |||
Country hold | Swing | ||||
Party | Candidate | Votes | % | ±% | |
---|---|---|---|---|---|
Labor | John Curtin | 19,142 | 42.0 | -15.0 | |
Independent | William Watson | 14,092 | 30.9 | -12.1 | |
United Australia | Keith Watson | 12,365 | 27.1 | +27.1 | |
Total formal votes | 45,599 | 97.9 | |||
Informal votes | 968 | 2.1 | |||
Turnout | 46,567 | 94.1 | |||
Two-party-preferred result | |||||
Independent | William Watson | 25,328 | 55.5 | +12.5 | |
Labor | John Curtin | 20,271 | 44.5 | -12.5 | |
Independent gain from Labor | Swing | +12.5 | |||
Party | Candidate | Votes | % | ±% | |
---|---|---|---|---|---|
Labor | Albert Green | 15,419 | 57.5 | -6.4 | |
Country | William Pickering | 7,156 | 26.7 | +3.6 | |
United Australia | George Rainsford | 4,248 | 15.8 | +2.8 | |
Total formal votes | 26,823 | 97.1 | |||
Informal votes | 807 | 2.9 | |||
Turnout | 27,630 | 86.5 | |||
Two-party-preferred result | |||||
Labor | Albert Green | 59.1 | -6.1 | ||
Country | William Pickering | 40.9 | +6.1 | ||
Labor hold | Swing | -6.1 | |||
Party | Candidate | Votes | % | ±% | |
---|---|---|---|---|---|
United Australia | Walter Nairn | 22,102 | 60.5 | +25.0 | |
Labor | John Moloney | 14,459 | 39.5 | -3.6 | |
Total formal votes | 36,561 | 95.4 | |||
Informal votes | 1,762 | 4.6 | |||
Turnout | 38,323 | 91.3 | |||
United Australia hold | Swing | +10.0 | |||
Party | Candidate | Votes | % | ±% | |
---|---|---|---|---|---|
Country | Henry Gregory | 26,234 | 54.7 | -45.3 | |
Labor | John Fraser | 14,232 | 29.7 | +29.7 | |
Independent | Carlyle Ferguson | 4,623 | 9.6 | +9.6 | |
Independent Country | Alfred Reynolds | 2,832 | 5.9 | +5.9 | |
Total formal votes | 47,921 | 95.7 | |||
Informal votes | 2,131 | 4.3 | |||
Turnout | 50,002 | 92.5 | |||
Two-party-preferred result | |||||
Country | Henry Gregory | 63.8 | -36.2 | ||
Labor | John Fraser | 36.2 | +36.2 | ||
Country hold | Swing | -36.2 | |||
Party | Candidate | Votes | % | ±% | |
---|---|---|---|---|---|
United Australia | Allan Guy | 10,293 | 46.6 | +7.0 | |
Labor | Claude Barnard | 6,763 | 30.6 | −29.8 | |
Nationalist | Harold Solomon | 5,032 | 22.8 | +22.8 | |
Total formal votes | 32,088 | 94.9 | |||
Informal votes | 1,197 | 5.1 | |||
Turnout | 23,285 | 96.5 | |||
Two-party-preferred result | |||||
United Australia | Allan Guy | 14,247 | 64.5 | +24.9 | |
Labor | Claude Barnard | 7,841 | 35.5 | −24.9 | |
United Australia gain from Labor | Swing | +24.9 | |||
Party | Candidate | Votes | % | ±% | |
---|---|---|---|---|---|
United Australia | George Bell | 16,149 | 69.9 | +16.3 | |
Labor | Joseph McGrath | 6,962 | 30.1 | -16.3 | |
Total formal votes | 23,111 | 96.3 | |||
Informal votes | 887 | 3.7 | |||
Turnout | 23,998 | 96.3 | |||
United Australia hold | Swing | +14.0 | |||
Party | Candidate | Votes | % | ±% | |
---|---|---|---|---|---|
United Australia | Arthur Hutchin | 12,078 | 55.0 | +13.3 | |
Labor | Charles Culley | 9,868 | 45.0 | -12.5 | |
Total formal votes | 21,946 | 95.0 | |||
Informal votes | 1,166 | 5.0 | |||
Turnout | 23,112 | 96.7 | |||
United Australia gain from Labor | Swing | +14.2 | |||
Party | Candidate | Votes | % | ±% | |
---|---|---|---|---|---|
United Australia | Archibald Blacklow | 12,819 | 56.0 | +10.9 | |
Labor | Charles Frost | 7,274 | 31.8 | +31.8 | |
Independent | Albert Beard | 2,778 | 12.1 | +12.1 | |
Total formal votes | 22,871 | 95.0 | |||
Informal votes | 1,195 | 5.0 | |||
Turnout | 24,066 | 96.4 | |||
Two-party-preferred result | |||||
United Australia | Archibald Blacklow | 63.0 | +17.9 | ||
Labor | Charles Frost | 37.0 | +37.0 | ||
United Australia gain from Labor | Swing | +17.9 | |||
Party | Candidate | Votes | % | ±% | |
---|---|---|---|---|---|
United Australia | Joseph Lyons | 12,622 | 60.2 | +13.1 | |
Labor | George Becker | 5,586 | 26.6 | -26.3 | |
Nationalist | George Pullen | 2,776 | 13.2 | +13.2 | |
Total formal votes | 20,984 | 95.3 | |||
Informal votes | 1,026 | 4.7 | |||
Turnout | 22,010 | 96.0 | |||
Two-party-preferred result | |||||
United Australia | Joseph Lyons | 72.1 | +25.0 | ||
Labor | George Becker | 27.9 | -25.0 | ||
United Australia gain from Labor | Swing | +25.0 | |||
Party | Candidate | Votes | % | ±% | |
---|---|---|---|---|---|
Labor | Harold Nelson | 747 | 50.4 | -49.6 | |
Independent | William Easton | 577 | 39.0 | +39.0 | |
Independent Labor | John McMillan | 157 | 10.6 | +10.6 | |
Total formal votes | 1,481 | 97.6 | |||
Informal votes | 37 | 2.4 | |||
Turnout | 1,518 | 67.7 | |||
Two-party-preferred result | |||||
Labor | Harold Nelson | 55.7 | -44.3 | ||
Independent | William Easton | 44.3 | +44.3 | ||
Labor hold | Swing | -44.3 | |||
The Division of Brisbane is an Australian electoral division in the state of Queensland.
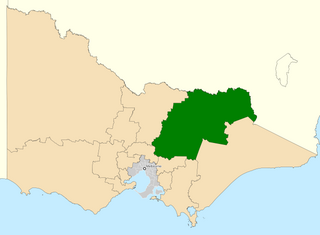
The Division of Indi ( "IN-dye") is an Australian electoral division in the state of Victoria. The division is located in the north-east of the state, adjoining the border with New South Wales. The largest settlements in the division are the regional cities of Wodonga, Wangaratta, and Benalla. Other towns in the electorate include Rutherglen, Mansfield, Beechworth, Myrtleford, Bright, Alexandra, Tallangatta, Corryong and a number of other small villages. While Indi is one of the largest electorates in Victoria, much of it is located within the largely uninhabited Australian Alps. While Wodonga serves as a regional hub for much of the more heavily populated northern part of the electorate, the southern part is closer to Melbourne than Wodonga.
Australia suffered badly during the period of the Great Depression of the 1930s. The Depression began with the Wall Street Crash of 1929 and rapidly spread worldwide. As in other nations, Australia suffered years of high unemployment, poverty, low profits, deflation, plunging incomes, and lost opportunities for economic growth and personal advancement.
Lang Labor was a faction of the Australian Labor Party (ALP) consisting of the supporters of Jack Lang, who served two terms as Premier of New South Wales and was the party's state leader from 1923 to 1939. It controlled the New South Wales branch of the ALP throughout most of the 1920s and 1930s. The faction broke away to form separate parliamentary parties on several occasions and stood competing candidates against the ALP in state and federal elections.
The 1934 Australian federal election was held in Australia on 15 September 1934. All 74 seats in the House of Representatives, and 18 of the 36 seats in the Senate were up for election. The incumbent United Australia Party led by Prime Minister of Australia Joseph Lyons formed a minority government, with 33 out of 74 seats in the House.
The 1931 Australian federal election was held on 19 December 1931. All 75 seats in the House of Representatives and 18 of the 36 seats in the Senate were up for election.
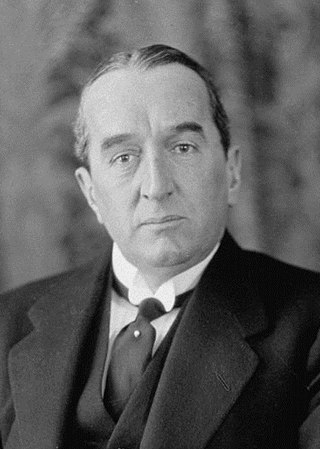
The 1928 Australian federal election was held in Australia on 17 November 1928. All 75 seats in the House of Representatives and 19 of the 36 seats in the Senate were up for election. The incumbent Nationalist–Country coalition, led by Prime Minister Stanley Bruce won a record fifth consecutive election defeating the opposition Labor Party led by James Scullin.
The Emergency Committee of South Australia was the major anti-Labor grouping in South Australia at the 1931 federal election.
The 1931 Tasmanian state election was held on 9 May 1931 in the Australian state of Tasmania to elect 30 members of the Tasmanian House of Assembly. The election used the Hare-Clark proportional representation system — six members were elected from each of five electorates. For the first time, voting was compulsory, resulting in a high voter turnout.
This is a list of the members of the Australian House of Representatives in the 12th Australian Parliament, which was elected at the 1929 election on 12 October 1929. The incumbent Nationalist Party of Australia led by Prime Minister of Australia Stanley Bruce in power since 1923 with coalition partner the Country Party led by Earle Page was defeated by the opposition Australian Labor Party led by James Scullin. Labor won with its then largest-ever majority in the federal parliament. However major divisions within the Labor over policy responses to the Great Depression, and the subsequent creation of the United Australia Party led to thirty parliamentarians changing their party affiliation in 1931.
This is a list of members of the Tasmanian House of Assembly between the 30 May 1928 election and the 9 May 1931 election. The 1928 election failed to deliver a majority, and the Nationalists' John McPhee took over from Labor's Joseph Lyons as Premier of Tasmania. Lyons subsequently retired from state politics, obtaining election to the Federal seat of Wilmot and going on to become Prime Minister of Australia in 1931.
State elections were held in South Australia on 8 April 1933. All 46 seats in the South Australian House of Assembly were up for election. The incumbent Parliamentary Labor Party government led by Premier Robert Richards was defeated by the opposition Liberal and Country League led by Leader of the Opposition Richard L. Butler. Each district elected multiple members.
This is a list of electoral results for the Division of East Sydney in Australian federal elections from the division's creation in 1901 until its abolition in 1969.
This is a list of electoral results for the Division of Flinders in Australian federal elections from the division's creation in 1901 until the present.
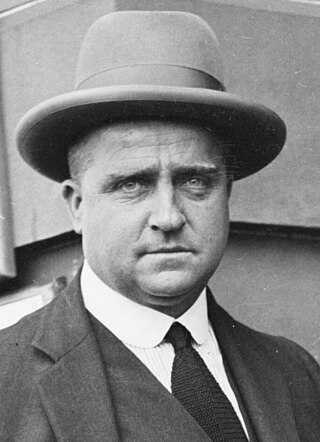
The 1932 New South Wales state election was held on 11 June 1932. This election was for all of the 90 seats in the 30th New South Wales Legislative Assembly and it was conducted in single member constituencies with compulsory preferential voting. It was a landslide victory for the UAP/Country Party coalition of Bertram Stevens, which had a majority of 42 in the Assembly.
The Lang Labor Party was a political party active in South Australia from 1931 to 1934, aligned with Lang Labor and the policies of Premier of New South Wales Jack Lang.
The Federal Labor Party were the members of the Australian Labor Party in the state of New South Wales who supported the federal party leadership in the split with the state Labor party which broke away in 1931. Federal Labor retained some seats in the Parliament of Australia but was a minor party in state elections. The dispute was healed in 1936.
This is a list of electoral division results for the Australian 1929 federal election.