Runoff curve number

Last updated

The runoff curve number (also called a curve number or simply CN) is an empirical parameter used in hydrology for predicting direct runoff or infiltration from rainfall excess. [1] The curve number method was developed by the USDA Natural Resources Conservation Service, which was formerly called the Soil Conservation Service or SCS — the number is still popularly known as a "SCS runoff curve number" in the literature. The runoff curve number was developed from an empirical analysis of runoff from small catchments and hillslope plots monitored by the USDA. It is widely used and is an efficient method for determining the approximate amount of direct runoff from a rainfall event in a particular area.

Contents

Definition

The runoff curve number is based on the area's hydrologic soil group, land use, treatment and hydrologic condition. References, such as from USDA [1] indicate the runoff curve numbers for characteristic land cover descriptions and a hydrologic soil group.

The runoff equation is:

where

is runoff ([L]; in)
is rainfall ([L]; in)
is the potential maximum soil moisture retention after runoff begins ([L]; in)
is the initial abstraction ([L]; in), or the amount of water before runoff, such as infiltration, or rainfall interception by vegetation; historically, it has generally been assumed that , although more recent research has found that may be a more appropriate relationship in urbanized watersheds where the CN is updated to reflect developed conditions. [2]

The runoff curve number, , is then related

has a range from 30 to 100; lower numbers indicate low runoff potential while larger numbers are for increasing runoff potential. The lower the curve number, the more permeable the soil is. As can be seen in the curve number equation, runoff cannot begin until the initial abstraction has been met. It is important to note that the curve number methodology is an event-based calculation, and should not be used for a single annual rainfall value, as this will incorrectly miss the effects of antecedent moisture and the necessity of an initial abstraction threshold.

Selection

The NRCS curve number is related to soil type, soil infiltration capability, land use, and the depth of the seasonal high water table. To account for different soils' ability to infiltrate, NRCS has divided soils into four hydrologic soil groups (HSGs). They are defined as follows. [1]

Selection of a hydrologic soil group should be done based on measured infiltration rates, soil survey (such as the NRCS Web Soil Survey), or judgement from a qualified soil science or geotechnical professional. The table below presents curve numbers for antecedent soil moisture condition II (average moisture condition). To alter the curve number based on moisture condition or other parameters, see Adjustments.

Values

Fully developed urban areas (vegetation established)
Cover descriptionCurve numbers for hydrologic soil group
ABCD
Open space (lawns, parks, golf courses, cemeteries, etc.)Poor condition (grass cover <50%)68798689
Fair condition (grass cover 50 to 75%)49697984
Good condition (grass cover >75%)39617480
Impervious areasPaved parking lots, roofs, driveways, etc. (excluding right of way)98989898
Streets and roadsPaved; curbs and storm sewers (excluding right-of-way)98989898
Paved; open ditches (including right-of-way)83899293
Gravel (including right of way)76858991
Dirt (including right-of-way)72828789
Western desert urban areasNatural desert landscaping (pervious area only)63778588
Artificial desert landscaping (impervious weed barrier, desert shrub with 1- to 2-inch sand or gravel mulch and basin borders)96969696
Urban districtsCommercial and business (85% imp.)89929495
Industrial (72% imp.)81889193
Residential districts by average lot size18 acre or less (town houses) (65% imp.)77859092
14 acre (38% imp.)61758387
13 acre (30% imp.)57728186
12 acre (25% imp.)54708085
1 acre (20% imp.)51687984
2 acres (12% imp.)46657782
Developing urban areas
Cover descriptionCurve numbers for hydrologic soil group
ABCD
Newly graded areas (pervious areas only, no vegetation)77869194
Cultivated agricultural lands
Cover descriptionCurve numbers for hydrologic soil group
Cover typeTreatment [A] Hydrologic
condition
ABCD
FallowBare soil77869194
Crop residue cover (CR)Poor76859093
Good74838890
Row cropsStraight row (SR)Poor72818891
Good67788589
SR + CRPoor71808790
Good64758285
Contoured (C)Poor70798488
Good65758286
C + CRPoor69788387
Good64748185
Contoured & terraced (C&T)Poor66748082
Good62717881
C&T + RPoor65737981
Good61707780
Small grainSRPoor65768488
Good63758387
SR + CRPoor64758386
Good60728084
CPoor63748285
Good61738184
C + CRPoor62738184
Good60728083
C&TPoor61727982
Good59707881
C&T + RPoor60717881
Good58697780
Close-seeded or broadcast legumes or rotation meadowSRPoor66778589
Good58728185
CPoor64758385
Good55697883
C&TPoor63738083
Good51677680
A Crop residue cover applies only if residue is on at least 5% of the surface throughout the year.
Other agricultural lands
Cover descriptionCurve numbers for hydrologic soil group
Cover typeHydrologic
condition
ABCD
Pasture, grassland, or range—continuous forage for grazing. A Poor68798689
Fair49697984
Good39617480
Meadow—continuous grass, protected from grazing and generally mowed for hay.30587178
Brush—brush-weed-grass mixture with brush the major element. B Poor48677783
Fair35567077
Good30 C 486573
Woods—grass combination (orchard or tree farm). D Poor57738286
Fair43657682
Good32587279
Woods. E Poor45667783
Fair36607379
Good30557077
Farmsteads—buildings, lanes, driveways, and surrounding lots.59748286
A Poor: <50% ground cover or heavily grazed with no mulch; Fair: 50-75% ground cover and not heavily grazed; Good: >75% ground cover and light or only occasionally grazed.
B Poor: <50% ground cover; Fair: 50-75% ground cover; Good: >75% ground cover.
C Actual curve number is less than 30; use CN = 30 for runoff computation.
D CN's shown were computed for areas with 50% woods and 50% grass (pasture) cover. Other combinations of conditions may be computed from the CN's for woods and pasture.
E Poor: Forest litter, small trees, and brush are destroyed by heavy grazing or regular burning; Fair: Woods are grazed but not burned, and some forest litter covers the soil; Good: Woods are protected from grazing, and litter and brush adequately cover the soil.
Arid and semiarid rangelands
Cover descriptionCurve numbers for hydrologic soil group
Cover typeHydrologic
condition A
A B BCD
Herbaceuous—mixture of grass, weeds, and low-growing brush, with brush the minor elementPoor808793
Fair718189
Good627485
Oak-aspen—mountain brush mixture of oak brush, aspen, mountain mahogany, bitter brush, maple, and other brushPoor667479
Fair485763
Good304148
Pinyon-juniper—pinyon, juniper, or both; grass understoryPoor758589
Fair587380
Good416171
Sagebrush with grass understoryPoor678085
Fair516370
Good354755
Desert shrub—major plants include saltbush, geasewood, creosotebush, blackbrush, bursage, palo verde, mesquite, and cactus.Poor63778588
Fair55728186
Good49687984
A Poor: <30% ground cover (litter, grass, and brush overstory); Fair: 30 to 70% ground cover; Good: >70% ground cover.
B Curve numbers for group A have been developed only for desert shrub.

Adjustments

Runoff is affected by the soil moisture before a precipitation event, the antecedent moisture condition (AMC). A curve number, as calculated above, may also be termed AMC II or , or average soil moisture. The other moisture conditions are dry, AMC I or , and moist, AMC III or . The curve number can be adjusted by factors to , where factors are less than 1 (reduce and potential runoff), while factor are greater than 1 (increase and potential runoff). The AMC factors can be looked up in the reference table below. Find the CN value for AMC II and multiply it by the adjustment factor based on the actual AMC to determine the adjusted curve number.

Adjustments to select curve number for soil moisture conditions. [3]
Curve Number (AMC II)Factors to Convert Curve Number for AMC II to AMC I or III
AMC I (dry)AMC III (wet)
100.402.22
200.451.85
300.501.67
400.551.50
500.621.40
600.671.30
700.731.21
800.791.14
900.871.07
1001.001.00

Initial abstraction ratio adjustment

The relationship was derived from the study of many small, experimental watersheds . Since the history and documentation of this relationship are relatively obscure, more recent analysis used model fitting methods to determine the ratio of to with hundreds of rainfall-runoff data from numerous U.S. watersheds. In the model fitting done by Hawkins et al. (2002) [2] found that the ratio of to varies from storm to storm and watershed to watershed and that the assumption of is usually high. More than 90 percent of ratios were less than 0.2. Based on this study, use of ratios of 0.05 rather than the commonly used value of 0.20 would seem more appropriate. Thus, the CN runoff equation becomes:

In this equation, note that the values of are not the same as the one used in estimating direct runoff with an ratio of 0.20, because 5 percent of the storage is assumed to be the initial abstraction, not 20 percent. The relationship between and was obtained from model fitting results, giving the relationship:

The user, then, must do the following to use the adjusted 0.05 initial abstraction ratio:

  1. Use the traditional tables of curve numbers to select the value appropriate for your watershed.
  2. Calculate using the traditional equation:
  3. Convert this S value to using the relationship above.
  4. Calculate the runoff depth using the CN runoff equation above (with 0.05 substituted for the initial abstraction ratio).

See also

Related Research Articles

<span class="mw-page-title-main">Hydrology</span> Science of the movement, distribution, and quality of water on Earth and other planets

Hydrology is the scientific study of the movement, distribution, and management of water on Earth and other planets, including the water cycle, water resources, and drainage basin sustainability. A practitioner of hydrology is called a hydrologist. Hydrologists are scientists studying earth or environmental science, civil or environmental engineering, and physical geography. Using various analytical methods and scientific techniques, they collect and analyze data to help solve water related problems such as environmental preservation, natural disasters, and water management.

<span class="mw-page-title-main">Evapotranspiration</span> Process by when water moves into the air from plants and soil.

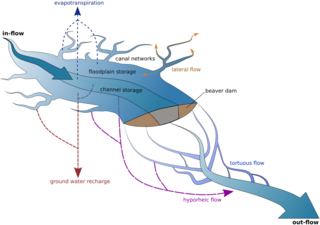
Evapotranspiration (ET) is the combined processes which move water from the Earth's surface into the atmosphere. It covers both water evaporation and transpiration. Evapotranspiration is an important part of the local water cycle and climate, and measurement of it plays a key role in agricultural irrigation and water resource management.

<span class="mw-page-title-main">Ecohydrology</span>

Ecohydrology is an interdisciplinary scientific field studying the interactions between water and ecological systems. It is considered a sub discipline of hydrology, with an ecological focus. These interactions may take place within water bodies, such as rivers and lakes, or on land, in forests, deserts, and other terrestrial ecosystems. Areas of research in ecohydrology include transpiration and plant water use, adaption of organisms to their water environment, influence of vegetation and benthic plants on stream flow and function, and feedbacks between ecological processes, the soil carbon sponge and the hydrological cycle.

Drainage density is a quantity used to describe physical parameters of a drainage basin. First described by Robert E. Horton, drainage density is defined as the total length of channel in a drainage basin divided by the total area, represented by the following equation:

<span class="mw-page-title-main">Infiltration (hydrology)</span> Process by which water on the ground surface enters the soil

Infiltration is the process by which water on the ground surface enters the soil. It is commonly used in both hydrology and soil sciences. The infiltration capacity is defined as the maximum rate of infiltration. It is most often measured in meters per day but can also be measured in other units of distance over time if necessary. The infiltration capacity decreases as the soil moisture content of soils surface layers increases. If the precipitation rate exceeds the infiltration rate, runoff will usually occur unless there is some physical barrier.

The United States Environmental Protection Agency (EPA) Storm Water Management Model (SWMM) is a dynamic rainfall–runoff–subsurface runoff simulation model used for single-event to long-term (continuous) simulation of the surface/subsurface hydrology quantity and quality from primarily urban/suburban areas.

<span class="mw-page-title-main">Rain garden</span> Runoff reducing landscaping method

Rain gardens, also called bioretention facilities, are one of a variety of practices designed to increase rain runoff reabsorption by the soil. They can also be used to treat polluted stormwater runoff. Rain gardens are designed landscape sites that reduce the flow rate, total quantity, and pollutant load of runoff from impervious urban areas like roofs, driveways, walkways, parking lots, and compacted lawn areas. Rain gardens rely on plants and natural or engineered soil medium to retain stormwater and increase the lag time of infiltration, while remediating and filtering pollutants carried by urban runoff. Rain gardens provide a method to reuse and optimize any rain that falls, reducing or avoiding the need for additional irrigation. A benefit of planting rain gardens is the consequential decrease in ambient air and water temperature, a mitigation that is especially effective in urban areas containing an abundance of impervious surfaces that absorb heat in a phenomenon known as the heat-island effect.

Runoff is the flow of water across the earth, and is a major component in the hydrological cycle. Runoff that flows over land before reaching a watercourse is referred to as surface runoff or overland flow. Once in a watercourse, runoff is referred to as streamflow, channel runoff, or river runoff. Urban runoff is surface runoff created by urbanization.

Streamflow, or channel runoff, is the flow of water in streams and other channels, and is a major element of the water cycle. It is one runoff component, the movement of water from the land to waterbodies, the other component being surface runoff. Water flowing in channels comes from surface runoff from adjacent hillslopes, from groundwater flow out of the ground, and from water discharged from pipes. The discharge of water flowing in a channel is measured using stream gauges or can be estimated by the Manning equation. The record of flow over time is called a hydrograph. Flooding occurs when the volume of water exceeds the capacity of the channel.

<span class="mw-page-title-main">Hydrological transport model</span>

An hydrological transport model is a mathematical model used to simulate the flow of rivers, streams, groundwater movement or drainage front displacement, and calculate water quality parameters. These models generally came into use in the 1960s and 1970s when demand for numerical forecasting of water quality and drainage was driven by environmental legislation, and at a similar time widespread access to significant computer power became available. Much of the original model development took place in the United States and United Kingdom, but today these models are refined and used worldwide.

<span class="mw-page-title-main">HBV hydrology model</span>

The HBV hydrology model, or Hydrologiska Byråns Vattenbalansavdelning model, is a computer simulation used to analyze river discharge and water pollution. Developed originally for use in Scandinavia, this hydrological transport model has also been applied in a large number of catchments on most continents.

<span class="mw-page-title-main">Groundwater recharge</span> Groundwater that recharges an aquifer

Groundwater recharge or deep drainage or deep percolation is a hydrologic process, where water moves downward from surface water to groundwater. Recharge is the primary method through which water enters an aquifer. This process usually occurs in the vadose zone below plant roots and is often expressed as a flux to the water table surface. Groundwater recharge also encompasses water moving away from the water table farther into the saturated zone. Recharge occurs both naturally and through anthropogenic processes, where rainwater and/or reclaimed water is routed to the subsurface.

In hydrology and sewage collection and disposal, antecedent moisture is the relative wetness or dryness of a watershed or sanitary sewershed. Antecedent moisture conditions change continuously and can have a very significant effect on the flow responses in these systems during wet weather. The effect is evident in most hydrologic systems including stormwater runoff and sanitary sewers with inflow and infiltration. Many modeling and analysis challenges that are created by antecedent moisture conditions are evident within combined sewers and separate sanitary sewer systems.

The Richards equation represents the movement of water in unsaturated soils, and is attributed to Lorenzo A. Richards who published the equation in 1931. It is a quasilinear partial differential equation; its analytical solution is often limited to specific initial and boundary conditions. Proof of the existence and uniqueness of solution was given only in 1983 by Alt and Luckhaus. The equation is based on Darcy-Buckingham law representing flow in porous media under variably saturated conditions, which is stated as

<span class="mw-page-title-main">Runoff model (reservoir)</span> Type of water motion

A runoff models or rainfall-runoff model describes how rainfall is converted into runoff in a drainage basin. More precisely, it produces a surface runoff hydrograph in response to a rainfall event, represented by and input as a hyetograph. Rainfall-runoff models need to be calibrated before they can be used.

<span class="mw-page-title-main">Hydrological model</span>

A hydrologic model is a simplification of a real-world system that aids in understanding, predicting, and managing water resources. Both the flow and quality of water are commonly studied using hydrologic models.

GSSHA is a two-dimensional, physically based watershed model developed by the Engineer Research and Development Center of the United States Army Corps of Engineers. It simulates surface water and groundwater hydrology, erosion and sediment transport. The GSSHA model is used for hydraulic engineering and research, and is on the Federal Emergency Management Agency (FEMA) list of hydrologic models accepted for use in the national flood insurance program for flood hydrograph estimation. Input is best prepared by the Watershed Modeling System interface, which effectively links the model with geographic information systems (GIS).

The following outline is provided as an overview of and topical guide to hydrology:

<span class="mw-page-title-main">Vflo</span>

Vflo is a commercially available, physics-based distributed hydrologic model generated by Vieux & Associates, Inc. Vflo uses radar rainfall data for hydrologic input to simulate distributed runoff. Vflo employs GIS maps for parameterization via a desktop interface. The model is suited for distributed hydrologic forecasting in post-analysis and in continuous operations. Vflo output is in the form of hydrographs at selected drainage network grids, as well as distributed runoff maps covering the watershed. Model applications include civil infrastructure operations and maintenance, stormwater prediction and emergency management, continuous and short-term surface water runoff, recharge estimation, soil moisture monitoring, land use planning, water quality monitoring, and water resources management.

DPHM-RS is a semi-distributed hydrologic model developed at University of Alberta, Canada.

References

  1. 1 2 3 United States Department of Agriculture (1986). Urban hydrology for small watersheds (PDF). Technical Release 55 (TR-55) (Second ed.). Natural Resources Conservation Service, Conservation Engineering Division.
  2. 1 2 Hawkins, R.H.; Jiang, R.; Woodward, D.E.; Hjelmfelt, A.T.; Van Mullem, J.A. (2002). "Runoff Curve Number Method: Examination of the Initial Abstraction Ratio". Proceedings of the Second Federal Interagency Hydrologic Modeling Conference, Las Vegas, Nevada. 42 (3): 629–643. doi:10.1111/j.1752-1688.2006.tb04481.x. S2CID   130013737.
  3. Ward, Andy D.; Trimble, Stanley W. (2004). Environmental Hydrology. Boca Raton, Florida: CRC Press LLC. ISBN   9781566706162.