California's 22nd congressional district

Last updated

California's 22nd congressional district
California's 22nd congressional district (since 2023).svg
California's 22nd congressional district
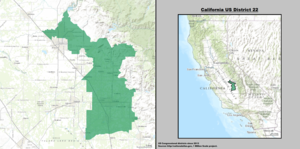
Interactive map of district boundaries
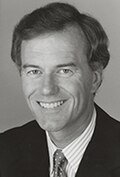
 since 2023 (Used in the 2022 elections)
Representative
  David Valadao
RHanford
Population (2022)775,019
Median household
income
$54,697 [1]
Ethnicity
Cook PVI D+5 [2]

California's 22nd congressional district is a congressional district in the U.S. state of California. It is represented by David Valadao, who formerly represented California's 21st congressional district from 2013 to 2019 and 2021 to 2023. As of 2024, this district, alongside New York's 4th, is the most Democratic-leaning congressional district represented by a Republican, with a partisan lean of D+5. [2] It was also one of 18 districts that would have voted for Joe Biden in the 2020 presidential election had they existed in their current configuration while being won or held by a Republican in 2022.

Contents

Following redistricting in 2021, the district is still in the San Joaquin Valley. It includes most of Kings County and parts of Tulare and Kern Counties. It includes the east side of Bakersfield; the west and south sides of Tulare, the south side of Hanford; and all of Porterville, Lindsay, Shafter, Wasco, Delano, McFarland, Arvin, Lamont, and Corcoran. [3] The new 22nd is a majority-Latino district.

Recent election results from statewide races

Year U.S. President U.S. Senator (Class 1) U.S. Senator (Class 3) Governor of California
1992 Clinton 41.1–35.4% Feinstein 48.7–43.3% Herschensohn 47.6–43.5%
1994 Huffington 46.9–43.5% Wilson 58.2–37.7%
1996 Dole 44.2–44.0%
1998 ?? ??
2000 Bush 48.8–44.6% [4] Feinstein 47.8–42.7% [5]
2002 Simon 64.3–28.8% [6]
2003Yes check.svg Yes 76.8–23.2% [7]
Schwarzenegger 62.9–15.6% [8]
2004 Bush 67.9–31.0% [9] Jones 59.7–35.5% [10]
2006 Mountjoy 57.3–37.4% [11] Schwarzenegger 73.8–22.0% [12]
2008 McCain 59.7–38.3% [13]
2010 Fiorina 63.9–28.8% Whitman 58.5–34.4%
2012 Romney 56.6–41.6% Emken 56.8–43.2%
2014 Kashkari 60.3–39.7%
2016 Trump 52.1–42.6% Harris 52.7–47.3%
2018 de Leon 55.7–43.3% Cox 56.8–43.2%
2020 Trump 51.6–46.2%
2021Yes check.svg Yes 58.2–41.8% [14]
2022 Padilla 51.2–48.8% Dahle 52.1–47.9% [15]

Composition

#CountySeatPopulation
29 Kern Bakersfield 916,108
31 Kings Hanford 152,981
107 Tulare Visalia 477,433

Cities with 10,000 or more people

2,500-10,000 people

List of members representing the district

MemberPartyDatesCong
ress(es)
Electoral historyDistrict location (counties)
District created January 3, 1943
Johnphillips2.jpg
John J. Phillips
(Banning)
Republican January 3, 1943 –
January 3, 1953
78th
79th
80th
81st
82nd
Elected in 1942.
Re-elected in 1944.
Re-elected in 1946.
Re-elected in 1948.
Re-elected in 1950.
Redistricted to the 29th district .
1943–1953
Imperial, Orange, Riverside
Joseph F. Holt (California Congressman).jpg
Joseph F. Holt
(Los Angeles)
Republican January 3, 1953 –
January 3, 1961
83rd
84th
85th
86th
Elected in 1952.
Re-elected in 1954.
Re-elected in 1956.
Re-elected in 1958.
Retired.
1953–1983
Los Angeles
James C. Corman, 1963.jpg
James C. Corman
(Los Angeles)
Democratic January 3, 1961 –
January 3, 1975
87th
88th
89th
90th
91st
92nd
93rd
Elected in 1960.
Re-elected in 1962.
Re-elected in 1964.
Re-elected in 1966.
Re-elected in 1968.
Re-elected in 1970.
Re-elected in 1972.
Redistricted to the 21st district .
Carlos Moorhead.jpg
Carlos J. Moorhead
(Glendale)
Republican January 3, 1975 –
January 3, 1993
94th
95th
96th
97th
98th
99th
100th
101st
102nd
Redistricted from the 20th district and re-elected in 1974.
Re-elected in 1976.
Re-elected in 1978.
Re-elected in 1980.
Re-elected in 1982.
Re-elected in 1984.
Re-elected in 1986.
Re-elected in 1988.
Re-elected in 1990.
Redistricted to the 27th district .
1983–1993
Los Angeles (northern L.A. suburbs)
Rep Michael Huffington.jpg
Michael Huffington
(Santa Barbara)
Republican January 3, 1993 –
January 3, 1995
103rd Elected in 1992.
Retired to run for U.S. senator.
1993–2003
San Luis Obispo, Santa Barbara
ASeastrand.jpg
Andrea Seastrand
(Pismo Beach)
Republican January 3, 1995 –
January 3, 1997
104th Elected in 1994.
Lost re-election.
WalterCapps.jpg
Walter Capps
(Santa Barbara)
Democratic January 3, 1997 –
October 28, 1997
105th Elected in 1996.
Died.
VacantOctober 28, 1997 –
March 17, 1998
Lois capps.jpg
Lois Capps
(Santa Barbara)
Democratic March 17, 1998 –
January 3, 2003
105th
106th
107th
Elected to finish her husband's term.
Re-elected later in 1998.
Re-elected in 2000.
Redistricted to the 23rd district .
Bill Thomas, official photo portrait color.jpg
Bill Thomas
(Bakersfield)
Republican January 3, 2003 –
January 3, 2007
108th
109th
Redistricted from the 21st district and re-elected in 2002.
Re-elected in 2004.
Retired.
2003–2013
CA-22nd.png
Kern, Los Angeles (Lancaster), inland San Luis Obispo
Kevin McCarthy2.jpg
Kevin McCarthy
(Bakersfield)
Republican January 3, 2007 –
January 3, 2013
110th
111th
112th
Elected in 2006.
Re-elected in 2008.
Re-elected in 2010.
Redistricted to the 23rd district .
Devin Nunes, official color photo portrait.jpg
Devin Nunes
(Tulare)
Republican January 3, 2013 –
January 1, 2022
113th
114th
115th
116th
117th
Redistricted from the 21st district and re-elected in 2012.
Re-elected in 2014.
Re-elected in 2016.
Re-elected in 2018.
Re-elected in 2020.
Resigned to become CEO of Trump Media & Technology Group.
2013–2023
California US Congressional District 22 (since 2013).tif
Fresno, Tulare
(Fresno, Clovis, Tulare, Visalia)
VacantJanuary 1, 2022 –
June 14, 2022
117th
Connie Conway Official Portrait - 117th Congress.jpg
Connie Conway
(Tulare)
Republican June 14, 2022 –
January 3, 2023
Elected to finish Nunes' term.
Redistricted to the 20th district and retired.
David Valadao 117th U.S Congress.jpg
David Valadao
(Hanford)
Republican January 3, 2023 –
present
118th Redistricted from the 21st district and re-elected in 2022.2023–present
California's 22nd congressional district (since 2023) (new version).svg
Kings, Tulare, and Kern

Election results

1942

1942 United States House of Representatives elections [16]
PartyCandidateVotes%
Republican John J. Phillips 42,765 57.6%
Democratic N. E. West31,44042.4%
Total votes74,205 100.0%
Turnout  
Republican win (new seat)

1944

1944 United States House of Representatives elections [17]
PartyCandidateVotes%
Republican John J. Phillips (incumbent) 88,537 100.0%
Turnout  
Republican hold

1946

1946 United States House of Representatives elections [18]
PartyCandidateVotes%
Republican John J. Phillips (incumbent) 59,935 62.1%
Democratic Ray Adkinson36,64937.9%
Total votes96,584 100.0%
Turnout  
Republican hold

1948

1948 United States House of Representatives elections [19]
PartyCandidateVotes%
Republican John J. Phillips (incumbent) 115,697 100.0%
Turnout
Republican hold

1950

1950 United States House of Representatives elections [20]
PartyCandidateVotes%
Republican John J. Phillips (incumbent) 114,497 100.0%
Turnout  
Republican hold

1952

1952 United States House of Representatives elections [21]
PartyCandidateVotes%
Republican Joseph F. Holt 85,039 60.5%
Democratic Dean E. McHenry55,53439.5%
Total votes140,573 100.0%
Turnout  
Republican win (new seat)

1954

1954 United States House of Representatives elections [22]
PartyCandidateVotes%
Republican Joseph F. Holt (incumbent) 65,165 58.2%
Democratic William M. "Bill" Costley46,87541.8%
Total votes112,040 100.0%
Turnout  
Republican hold

1956

1956 United States House of Representatives elections [23]
PartyCandidateVotes%
Republican Joseph F. Holt (incumbent) 97,317 59.8%
Democratic Irving Glasband65,31440.2%
Total votes162,631 100.0%
Turnout  
Republican hold

1958

1958 United States House of Representatives elections [24]
PartyCandidateVotes%
Republican Joseph F. Holt (incumbent) 87,785 55.4%
Democratic Irving Glasband70,77744.6%
Total votes158,562 100.0%
Turnout  
Republican hold

1960

1960 United States House of Representatives elections [25]
PartyCandidateVotes%
Democratic James C. Corman 104,919 51.1%
Republican Lemoine Blanchard100,32148.9%
Total votes205,240 100.0%
Turnout
Democratic gain from Republican

1962

1962 United States House of Representatives elections [26]
PartyCandidateVotes%
Democratic James C. Corman (incumbent) 75,294 53.6%
Republican Charles S. Foote65,08746.4%
Total votes140,381 100.0%
Turnout  
Democratic hold

1964

1964 United States House of Representatives elections [27]
PartyCandidateVotes%
Democratic James C. Corman (incumbent) 94,141 50.5%
Republican Robert C. Cline92,13349.5%
Total votes186,274 100.0%
Turnout  
Democratic hold

1966

1966 United States House of Representatives elections [28]
PartyCandidateVotes%
Democratic James C. Corman (incumbent) 94,420 53.5%
Republican Robert C. Cline82,20746.5%
Total votes176,627 100.0%
Turnout  
Democratic hold

1968

1968 United States House of Representatives elections [29]
PartyCandidateVotes%
Democratic James C. Corman (incumbent) 102,332 56.9%
Republican Joe Holt 74,43341.4%
Peace and Freedom Hugh Manes3,0241.7%
Total votes179,789 100.0%
Turnout  
Democratic hold

1970

1970 United States House of Representatives elections [30]
PartyCandidateVotes%
Democratic James C. Corman (incumbent) 95,256 59.4%
Republican Tom Hayden63,29739.5%
American Independent Callis R. Johnson1,8801.1%
Total votes160,433 100.0%
Turnout  
Democratic hold

1972

1972 United States House of Representatives elections [31]
PartyCandidateVotes%
Democratic James C. Corman (incumbent) 121,352 67.6%
Republican Bruce P. Wolfe52,66429.3%
Peace and Freedom Ralph L. Shroyer5,5833.1%
Total votes179,599 100.0%
Turnout  
Democratic hold

1974

1974 United States House of Representatives elections [32]
PartyCandidateVotes%
Republican Carlos Moorhead (incumbent) 78,983 55.8%
Democratic Richard Hallin62,77044.2%
Total votes141,753 100.0%
Turnout  
Republican gain from Democratic

1976

1976 United States House of Representatives elections [33]
PartyCandidateVotes%
Republican Carlos Moorhead (incumbent) 114,769 62.6%
Democratic Robert S. Henry68,54337.4%
Total votes183,312 100.0%
Turnout  
Republican hold

1978

1978 United States House of Representatives elections [34]
PartyCandidateVotes%
Republican Carlos Moorhead (incumbent) 99,502 64.6%
Democratic Robert S. Henry54,44235.4%
Total votes153,944 100.0%
Turnout  
Republican hold

1980

1980 United States House of Representatives elections [35]
PartyCandidateVotes%
Republican Carlos Moorhead (incumbent) 115,241 63.9%
Democratic Pierce O'Donnell57,47731.9%
Libertarian William V. Susel7,7054.3%
Total votes180,423 100.0%
Turnout  
Republican hold

1982

1982 United States House of Representatives elections [36]
PartyCandidateVotes%
Republican Carlos Moorhead (incumbent) 145,831 73.6%
Democratic Harvey L. Goldhammer46,52123.5%
Libertarian Robert T. Gerringer5,8703.0%
Total votes198,222 100.0%
Turnout  
Republican hold

1984

1984 United States House of Representatives elections [37]
PartyCandidateVotes%
Republican Carlos Moorhead (incumbent) 184,981 85.2%
Libertarian Michael B. Yauch32,03614.8%
Total votes217,017 100.0%
Turnout  
Republican hold

1986

1986 United States House of Representatives elections [38]
PartyCandidateVotes%
Republican Carlos Moorhead (incumbent) 141,096 73.8%
Democratic John G. Simmons44,03623.0%
Libertarian Jona Joy Bergland3,1141.6%
Peace and Freedom Joel Lorimer2,9301.5%
Total votes191,176 100.0%
Turnout  
Republican hold

1988

1988 United States House of Representatives elections [39]
PartyCandidateVotes%
Republican Carlos Moorhead (incumbent) 164,699 69.5%
Democratic John G. Simmons61,55526.0%
Peace and Freedom Shirley Rachel Isaacson6,2982.7%
Libertarian Ted Brown4,2591.8%
Total votes235,811 100.0%
Turnout
Republican hold

1990

1990 United States House of Representatives elections [40]
PartyCandidateVotes%
Republican Carlos Moorhead (incumbent) 108,634 60.0%
Democratic David Bayer61,63034.1%
Libertarian William H. Wilson6,7023.7%
Peace and Freedom Jan B. Tucker3,9632.2%
Total votes180,929 100.0%
Turnout  
Republican hold

1992

1992 United States House of Representatives elections [41]
PartyCandidateVotes%
Republican Michael Huffington 131,242 52.5%
Democratic Gloria Ochoa87,32834.9%
Green Mindy Lorenz23,6999.5%
Libertarian William Howard Dilbeck7,5533.0%
No partyBialosky (write-in)1040.1%
Total votes249,926 100.0%
Turnout  
Republican hold

1994

1994 United States House of Representatives elections [42]
PartyCandidateVotes%
Republican Andrea Seastrand 102,987 49.27%
Democratic Walter Capps 101,42448.53%
Libertarian David L. Bersohn4,5972.20%
Total votes209,008 100.0%
Turnout  
Republican hold

1996

1996 United States House of Representatives elections [43]
PartyCandidateVotes%
Democratic Walter Capps 118,299 48.5%
Republican Andrea Seastrand (incumbent)107,98744.3%
Independent Steven Wheeler9,8454.0%
Reform Richard Porter3,9751.6%
Libertarian David Bersohn2,2330.9%
Natural Law Dawn Tomastik1,8470.7%
Total votes244,186 100.0%
Turnout  
Democratic gain from Republican

1998 (special)

List of special elections to the United States House of Representatives in California [44]
PartyCandidateVotes%
Democratic Lois Capps 93,392 53.46%
Republican Tom Bordonaro 78,22444.78%
Libertarian Robert Bakhaus3,0791.76%
Total votes174,695 100.00%
Turnout  
Democratic hold

1998

1998 United States House of Representatives elections [45]
PartyCandidateVotes%
Democratic Lois Capps (incumbent) 111,388 55.09%
Republican Tom J. Bordonaro Jr.86,92142.99%
Libertarian Robert Bakhaus2,6181.29%
Reform Richard D. "Dick" Porter1,2630.62%
Total votes202,190 100.0%
Turnout  
Democratic hold

2000

2000 United States House of Representatives elections [46]
PartyCandidateVotes%
Democratic Lois Capps (incumbent) 135,538 53.2%
Republican Mike Stoker113,09444.4%
Reform Richard D. "Dick" Porter2,4900.9%
Libertarian Joe Furcinite2,0600.8%
Natural Law J. Carlos Aguirre1,8880.7%
Total votes255,070 100.0%
Turnout  
Democratic hold

2002

2002 United States House of Representatives elections [47]
PartyCandidateVotes%
Republican Bill Thomas 120,473 73.4%
Democratic Jaime A. Corvera38,98823.7%
Libertarian Frank Coates4,8242.9%
Total votes164,285 100.0%
Turnout  
Republican gain from Democratic

2004

2004 United States House of Representatives elections [48]
PartyCandidateVotes%
Republican Bill Thomas (incumbent) 209,384 100.0%
Turnout  
Republican hold

2006

2006 United States House of Representatives elections [49]
PartyCandidateVotes%
Republican Kevin McCarthy 133,278 70.8%
Democratic Sharon M. Beery55,22629.2%
Total votes188,504 100.0%
Turnout  
Republican hold

2008

2008 United States House of Representatives elections [50]
PartyCandidateVotes%
Republican Kevin McCarthy (incumbent) 224,549 100.0%
Total votes224,549 100.0%
Turnout  
Republican hold

2010

2010 United States House of Representatives elections [51]
PartyCandidateVotes%
Republican Kevin McCarthy (incumbent) 173,490 98.8%
Independent John Uebersax (write-in)2,1731.2%
Total votes175,663 100.0%
Turnout  
Republican hold

2012

2012 United States House of Representatives elections [52]
PartyCandidateVotes%
Republican Devin Nunes (incumbent) 132,386 61.9%
Democratic Otto Lee 81,55538.1%
Total votes213,941 100.0%
Republican hold

2014

2014 United States House of Representatives elections [53]
PartyCandidateVotes%
Republican Devin Nunes (incumbent) 96,053 72.0%
Democratic Suzanna "Sam" Aguilera-Marrero37,28928.0%
Total votes133,342 100.0%
Republican hold

2016

2016 United States House of Representatives elections
PartyCandidateVotes%
Republican Devin Nunes (incumbent) 158,755 67.6%
Democratic Louie J. Campos76,21132.4%
Total votes234,966 100.0%
Republican hold

2018

2018 United States House of Representatives elections
PartyCandidateVotes%
Republican Devin Nunes (incumbent) 117,243 52.7%
Democratic Andrew Janz105,13647.3%
Total votes222,379 100.0%
Republican hold

2020

2020 United States House of Representatives elections
PartyCandidateVotes%
Republican Devin Nunes (incumbent) 151,864 54.2%
Democratic Phil Arballo128,56445.8%
Total votes280,428 100.0%
Republican hold

2022 (special)

2022 California's 22nd congressional district special election
PartyCandidateVotes%
Republican Connie Conway 69,954 62.1%
Democratic Lourin Hubbard42,68837.9%
Total votes112,642 100.0%
Republican hold

2022

2022 United States House of Representatives elections
PartyCandidateVotes%
Republican David Valadao (incumbent) 52,994 51.5%
Democratic Rudy Salas 49,86248.5%
Total votes102,856 100.0%
Republican hold

Historical district boundaries

2003-2013 CA-22nd.png
2003–2013
2013 - 2023 California US Congressional District 22 (since 2013).tif
2013 – 2023

See also

Related Research Articles

<span class="mw-page-title-main">Kern County, California</span> County in California, United States

Kern County is a county located in the U.S. state of California. As of the 2020 census, the population was 909,235. Its county seat is Bakersfield.

<span class="mw-page-title-main">College of the Sequoias</span> Community college in central California, US

College of the Sequoias (COS) is a public two-year community college in Visalia, California. The college is named for the Giant Sequoia trees native to the nearby Sierra Nevada mountain range.

California's 9th congressional district is a congressional district in the U.S. state of California. Josh Harder, a Democrat, has represented the district since January 2023.

California's 10th congressional district is a congressional district in the U.S. state of California. Currently, the 10th district encompasses parts of the eastern San Francisco Bay Area. It is currently represented by Democrat Mark DeSaulnier.

California's 11th congressional district is a congressional district in the U.S. state of California and is represented by Nancy Pelosi.

California's 50th congressional district is a congressional district in the U.S. state of California, and encompasses parts of the Mid-Coast and northeastern parts of San Diego County. Scott Peters is currently the U.S. representative for California's 50th congressional district.

California's 6th congressional district is a congressional district in the U.S. state of California. It is represented by Democrat Ami Bera.

California's 18th congressional district is a congressional district located in the U.S. state of California. The district is currently represented by Democrat Zoe Lofgren. Since the 2022 election, the district is landlocked and includes all of San Benito County and parts of Santa Clara and Monterey counties, including Salinas, Hollister, Watsonville, Gilroy, Soledad, and downtown and eastern San Jose.

California's 5th congressional district is a U.S. congressional district in California.

California's 8th congressional district is a congressional district in the U.S. state of California. As of 2023, Democrat John Garamendi represents the district. Currently, the 8th district includes parts of the Bay Area counties of Contra Costa County and Solano County, including the cities of Vallejo, Fairfield, Richmond and parts of Martinez.

California 26th congressional district is a congressional district in the U.S. state of California currently represented by Democrat Julia Brownley.

California's 4th congressional district is a U.S. congressional district in California. The district is located in the northwestern part of the state, and includes all of Lake County and Napa County, most of Yolo County, and parts of Solano County and Sonoma County. Major cities in the district include Davis, Woodland, Napa, Vacaville, and most of Santa Rosa. The new 4th district is solidly Democratic, and is represented by Mike Thompson.

California's 3rd congressional district is a U.S. congressional district in California. It includes the northern Sierra Nevada and northeastern suburbs of Sacramento, stretching south to Death Valley. It encompasses Alpine, Inyo, Mono, Nevada, Placer, Plumas, and Sierra counties, as well as parts of El Dorado, Sacramento, and Yuba counties. It includes the Sacramento suburbs of Roseville, Folsom, Orangevale, Rocklin, and Lincoln, and the mountain towns of Quincy, South Lake Tahoe, Truckee, Mammoth Lakes, and Bishop. The district is represented by Republican Kevin Kiley.

California's 13th congressional district is a congressional district in the U.S. state of California. John Duarte, a Republican, has represented this district since January 2023.

California's 14th congressional district is a congressional district in the U.S. state of California. Eric Swalwell, a Democrat, has represented the district since January 2023.

California's 19th congressional district is a congressional district in the U.S. state of California, currently represented by Democrat Jimmy Panetta.

California's 20th congressional district is a congressional district in California including much of the southern and southeastern part of the state's Central Valley. The district is currently vacant.

California's 23rd congressional district is a congressional district in the U.S. state of California. The district is represented in the 118th United States Congress by Jay Obernolte.

<span class="mw-page-title-main">Connie Conway</span> American politician (born 1950)

Connie Marie Conway is an American retired politician who served as the U.S. representative for California's 22nd congressional district from 2022 to 2023. She was a member of the California State Assembly from 2008 to 2014. Before that, Conway was a member of the board of supervisors for Tulare County from 2001 until 2008. She is a member of the Republican Party.

<span class="mw-page-title-main">Rudy Salas</span> American politician (born 1977)

Rodolfo "Rudy" Salas is an American politician who served in the California State Assembly from 2012-2022. He is a Democrat who formerly represented the 32nd Assembly district, which encompasses Kings County and parts of northwestern Kern County. Prior to being elected to the Assembly in 2012, he served on the Bakersfield City Council.

References

  1. Center for New Media & Promotion (CNMP), US Census Bureau. "My Congressional District". www.census.gov.
  2. 1 2 "2022 Cook PV: District Map and List". The Cook Political Report. July 12, 2022. Retrieved January 5, 2023.
  3. "CA 2022 Congressional". Dave's Redistricting. January 4, 2022. Retrieved November 11, 2022.
  4. "Statement of Vote (2000 U.S. President)" (PDF). Archived from the original (PDF) on June 11, 2007. Retrieved September 17, 2008.
  5. "Statement of Vote (2000 U.S. Senator)" (PDF). Archived from the original (PDF) on June 11, 2007. Retrieved September 17, 2008.
  6. "Statement of Vote (2002 Governor)" (PDF). Archived from the original (PDF) on November 11, 2010.
  7. "Statement of Vote (2003 Recall Question)" (PDF). Archived from the original (PDF) on May 20, 2011. Retrieved October 8, 2007.
  8. "Statement of Vote (2003 Governor)" (PDF). Archived from the original (PDF) on May 20, 2011. Retrieved October 8, 2007.
  9. "Statement of Vote (2004 U.S. President)" (PDF). Archived from the original (PDF) on August 1, 2010. Retrieved August 8, 2007.
  10. "Statement of Vote (2004 U.S. Senator)" (PDF). Archived from the original (PDF) on August 10, 2011.
  11. "Statement of Vote (2006 U.S. Senator)" (PDF). Archived from the original (PDF) on August 10, 2011.
  12. "Statement of Vote (2006 Governor)" (PDF). Archived from the original (PDF) on August 10, 2011.
  13. "(2008 U.S. President)". Archived from the original on May 17, 2009. Retrieved March 5, 2009.
  14. "Counties by Congressional District for Recall Question" (PDF). sos.ca.gov. September 14, 2021. Retrieved May 2, 2022.
  15. "Counties by Congressional Districts for Governor" (PDF). sos.ca.gov. November 8, 2022. Retrieved May 4, 2023.
  16. "1942 election results" (PDF).
  17. "1944 election results" (PDF).
  18. "1946 election results" (PDF).
  19. "1948 election results" (PDF).
  20. "1950 election results" (PDF).
  21. "1952 election results" (PDF).
  22. "1954 election results" (PDF).
  23. "1956 election results" (PDF).
  24. "1958 election results" (PDF).
  25. "1960 election results" (PDF).
  26. "1962 election results" (PDF).
  27. "1964 election results" (PDF).
  28. "1966 election results" (PDF).
  29. "1968 election results" (PDF).
  30. "1970 election results" (PDF).
  31. "1972 election results" (PDF).
  32. "1974 election results" (PDF).
  33. "1976 election results" (PDF).
  34. "1978 election results" (PDF).
  35. "1980 election results" (PDF).
  36. "1982 election results" (PDF).
  37. "1984 election results" (PDF).
  38. "1986 election results" (PDF).
  39. "1988 election results" (PDF).
  40. "1990 election results" (PDF).
  41. "1992 election results" (PDF).
  42. "1994 election results" (PDF).
  43. "1996 election results" (PDF).
  44. "JoinCalifornia - 03-10-1998 Election". www.joincalifornia.com.
  45. "1998 election results" (PDF).
  46. "2000 election results" (PDF).
  47. "2002 general election results" (PDF). Archived from the original (PDF) on February 3, 2009.
  48. "2004 general election results" (PDF). Archived from the original (PDF) on August 21, 2008.
  49. "2006 general election results" (PDF). Archived from the original (PDF) on November 27, 2008.
  50. "2008 general election results" (PDF). Archived from the original (PDF) on December 21, 2008.
  51. "2010 general election results" (PDF). Archived from the original (PDF) on May 20, 2011. Retrieved February 11, 2011.
  52. "2012 general election results" (PDF). Archived from the original (PDF) on October 19, 2013.
  53. "U.S. House of Representatives District 22 - Districtwide Results". Archived from the original on January 6, 2015. Retrieved December 21, 2014.

35°12′N119°54′W / 35.2°N 119.9°W / 35.2; -119.9