Caribou, Maine | |
|---|---|
City | |
| Trucks outside a starch factory in October 1940 | |
| Nickname: The Most Northeastern City in the United States | |
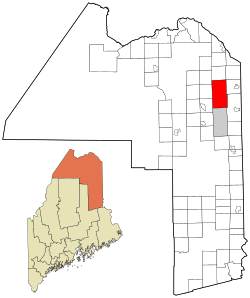
| Location of Caribou, Maine | |
| Coordinates: 46°51′49″N67°59′53″W / 46.86361°N 67.99806°W | |
| Country | United States |
| State | Maine |
| County | Aroostook |
| Settled | 1824 |
| Incorporated (town) | April 5, 1859 |
| Incorporated (city) | February 23, 1967 |
| Named places |
|
| Government | |
| • Mayor | Jody Smith [1] |
| Area | |
• Total | 80.09 sq mi (207.44 km2) |
| • Land | 79.29 sq mi (205.36 km2) |
| • Water | 0.80 sq mi (2.08 km2) |
| Elevation | 449 ft (137 m) |
| Population (2020) | |
• Total | 7,396 |
| • Density | 93.3/sq mi (36.01/km2) |
| Time zone | UTC−5 (Eastern (EST)) |
| • Summer (DST) | UTC−4 (EDT) |
| ZIP Code | 04736 |
| Area code | 207 |
| FIPS code | 23-10565 |
| GNIS feature ID | 0563512 |
| Website | cariboumaine |
Caribou is the second largest city in Aroostook County, Maine, United States. Its population was 7,396 at the 2020 census. The city is a service center for the agricultural and tourism industries, and the location of a National Weather Service Forecast Office.
According to the United States Census Bureau, the city has a total area of 80.10 square miles (207.5 km2), of which 79.26 square miles (205.3 km2) is land and 0.84 square miles (2.2 km2) is water. [3]
Caribou has a humid continental climate (Köppen Dfb), with very cold, snowy winters, and mild to warm summers, and is located in USDA hardiness zone 4b/4a. [4] The monthly daily average temperature ranges from 11.7 °F (−11.3 °C) in January to 66.7 °F (19.3 °C) in July. [5] On average, there are 38 nights annually that drop to 0 °F (−18 °C) or below, and 91 days where the temperature stays below freezing, including 69 days from December through February. [5] Although 1991–2020 averaged 2 days annually with highs at or above 90 °F (32 °C), more than 35 percent of all years on record have not seen such temperatures. [5] Extreme temperatures range from −41 °F (−41 °C) on February 1, 1955, up to 96 °F (36 °C) as recently as June 19, 2024. [5] June 19, 2024 saw a heat index of 103 °F during a heat wave that hit the Midwest and New England. [6]
The average first freeze of the season occurs on September 23, and the last May 15, resulting in a freeze-free season of 130 days; the corresponding dates for measurable snowfall, i.e. at least 0.1 in (0.25 cm), are October 23 and April 25. [5] The average annual snowfall for Caribou is approximately 118.2 inches (3.0 m), while snowfall has ranged from 68.5 inches (1.74 m) in 1961–1962 to 196.5 inches (4.99 m) in 2007−2008; the record snowiest month was December 1972 with 59.9 inches (1.52 m), while the most snow in one calendar day was 28.6 inches (73 cm) on March 14, 1984. [5] Measurable snowfalls typically occur from early November to early April. A snow depth of at least 10 in (25 cm) is on average seen 78 days per winter, including 63 days from January to March, [7] when the snow pack is typically most reliable.
| Climate data for Caribou Municipal Airport, Maine (1991–2020 normals, extremes 1939–present, Mean monthly maxima and minima (i.e. the expected highest and lowest temperature readings at any point during the year or given month) calculated based on data at said location from 1991 to 2020.) | |||||||||||||
|---|---|---|---|---|---|---|---|---|---|---|---|---|---|
| Month | Jan | Feb | Mar | Apr | May | Jun | Jul | Aug | Sep | Oct | Nov | Dec | Year |
| Record high °F (°C) | 53 (12) | 59 (15) | 75 (24) | 86 (30) | 96 (36) | 96 (36) | 95 (35) | 95 (35) | 92 (33) | 83 (28) | 75 (24) | 60 (16) | 96 (36) |
| Mean maximum °F (°C) | 43.0 (6.1) | 41.7 (5.4) | 51.4 (10.8) | 68.4 (20.2) | 81.9 (27.7) | 86.7 (30.4) | 88.4 (31.3) | 87.3 (30.7) | 82.3 (27.9) | 71.8 (22.1) | 60.1 (15.6) | 47.1 (8.4) | 90.4 (32.4) |
| Mean daily maximum °F (°C) | 20.8 (−6.2) | 24.1 (−4.4) | 34.3 (1.3) | 47.7 (8.7) | 63.0 (17.2) | 72.1 (22.3) | 77.1 (25.1) | 75.7 (24.3) | 67.3 (19.6) | 53.2 (11.8) | 39.5 (4.2) | 27.5 (−2.5) | 50.2 (10.1) |
| Daily mean °F (°C) | 11.7 (−11.3) | 14.2 (−9.9) | 25.0 (−3.9) | 38.5 (3.6) | 52.2 (11.2) | 61.4 (16.3) | 66.7 (19.3) | 64.9 (18.3) | 56.6 (13.7) | 44.5 (6.9) | 32.6 (0.3) | 19.9 (−6.7) | 40.7 (4.8) |
| Mean daily minimum °F (°C) | 2.6 (−16.3) | 4.4 (−15.3) | 15.6 (−9.1) | 29.4 (−1.4) | 41.4 (5.2) | 50.6 (10.3) | 56.3 (13.5) | 54.1 (12.3) | 45.9 (7.7) | 35.9 (2.2) | 25.6 (−3.6) | 12.3 (−10.9) | 31.2 (−0.4) |
| Mean minimum °F (°C) | −20.8 (−29.3) | −17.7 (−27.6) | −9.1 (−22.8) | 14.6 (−9.7) | 29.3 (−1.5) | 37.6 (3.1) | 45.1 (7.3) | 41.7 (5.4) | 31.0 (−0.6) | 22.4 (−5.3) | 7.1 (−13.8) | −10.5 (−23.6) | −23.0 (−30.6) |
| Record low °F (°C) | −37 (−38) | −41 (−41) | −28 (−33) | −4 (−20) | 18 (−8) | 30 (−1) | 36 (2) | 34 (1) | 23 (−5) | 14 (−10) | −8 (−22) | −31 (−35) | −41 (−41) |
| Average precipitation inches (mm) | 2.95 (75) | 2.42 (61) | 2.77 (70) | 2.99 (76) | 3.46 (88) | 3.89 (99) | 4.23 (107) | 3.61 (92) | 3.44 (87) | 3.99 (101) | 3.35 (85) | 3.60 (91) | 40.70 (1,034) |
| Average snowfall inches (cm) | 25.0 (64) | 25.3 (64) | 21.4 (54) | 8.3 (21) | 0.8 (2.0) | 0.0 (0.0) | 0.0 (0.0) | 0.0 (0.0) | 0.1 (0.25) | 1.7 (4.3) | 10.4 (26) | 25.2 (64) | 118.2 (300) |
| Average extreme snow depth inches (cm) | 19.7 (50) | 25.2 (64) | 24.7 (63) | 13.5 (34) | 0.3 (0.76) | 0.0 (0.0) | 0.0 (0.0) | 0.0 (0.0) | 0.0 (0.0) | 1.3 (3.3) | 5.6 (14) | 13.5 (34) | 28.5 (72) |
| Average precipitation days (≥ 0.01 in) | 14.0 | 12.1 | 12.5 | 13.1 | 14.7 | 13.8 | 14.4 | 13.0 | 11.5 | 13.5 | 13.4 | 14.9 | 160.9 |
| Average snowy days (≥ 0.1 in) | 14.0 | 11.8 | 10.6 | 4.9 | 0.5 | 0.0 | 0.0 | 0.0 | 0.1 | 1.2 | 6.9 | 13.0 | 63.0 |
| Average relative humidity (%) | 69.8 | 70.8 | 70.5 | 74.0 | 68.5 | 67.9 | 77.1 | 79.1 | 82.4 | 81.8 | 84.5 | 79.1 | 75.5 |
| Average dew point °F (°C) | −0.2 (−17.9) | 4.5 (−15.3) | 15.6 (−9.1) | 27.1 (−2.7) | 37.9 (3.3) | 49.3 (9.6) | 55.6 (13.1) | 54.1 (12.3) | 47.5 (8.6) | 35.2 (1.8) | 26.2 (−3.2) | 12.7 (−10.7) | 30.5 (−0.9) |
| Mean daily sunshine hours | 9.0 | 10.4 | 12.0 | 13.6 | 15.1 | 15.8 | 15.4 | 14.1 | 12.5 | 10.9 | 9.4 | 8.6 | 12.2 |
| Mean daily daylight hours | 2.5 | 2.1 | 3.0 | 5.2 | 7.3 | 8.2 | 9.2 | 9.4 | 7.3 | 5.5 | 4.0 | 3.0 | 5.6 |
| Average ultraviolet index | 1 | 1 | 1 | 2 | 4 | 5 | 5 | 4 | 3 | 2 | 1 | 1 | 3 |
| Source 1: NOAA (relative humidity and dew point 1961–1990) [5] [7] [8] | |||||||||||||
| Source 2: Weather Atlas (UV and humidity) [9] | |||||||||||||
This graph was using the legacy Graph extension, which is no longer supported. It needs to be converted to the new Chart extension. |
See or edit raw graph data.
| Census | Pop. | Note | %± |
|---|---|---|---|
| 1860 | 297 | — | |
| 1870 | 1,410 | 374.7% | |
| 1880 | 2,756 | 95.5% | |
| 1890 | 4,087 | 48.3% | |
| 1900 | 4,758 | 16.4% | |
| 1910 | 5,377 | 13.0% | |
| 1920 | 6,018 | 11.9% | |
| 1930 | 7,248 | 20.4% | |
| 1940 | 8,218 | 13.4% | |
| 1950 | 9,923 | 20.7% | |
| 1960 | 12,464 | 25.6% | |
| 1970 | 10,419 | −16.4% | |
| 1980 | 9,916 | −4.8% | |
| 1990 | 9,415 | −5.1% | |
| 2000 | 8,312 | −11.7% | |
| 2010 | 8,189 | −1.5% | |
| 2020 | 7,396 | −9.7% | |
| U.S. Decennial Census [ shallow reference ] | |||
As of the census [10] of 2010, there were 8,189 people, 3,559 households, and 2,206 families residing in the city. The population density was 103.3 inhabitants per square mile (39.9/km2). There were 3,914 housing units at an average density of 49.4 per square mile (19.1/km2). The racial makeup of the city was 98.2% White, 0.0% African American, 1.4% Native American, 0.7% Asian, 0.2% from other races, and 0.2% from two or more races. Hispanic or Latino residents of any race were 0.01% of the population.
There were 3,559 households, of which 27.5% had children under the age of 18 living with them, 46.5% were married couples living together, 11.4% had a female householder with no husband present, 4.0% had a male householder with no wife present, and 38.0% were non-families. 32.0% of all households were made up of individuals, and 13.8% had someone living alone who was 65 years of age or older. The average household size was 2.26 and the average family size was 2.82.
The median age in the city was 44 years. 21.2% of residents were under the age of 18; 7.1% were between the ages of 18 and 24; 23.2% were from 25 to 44; 29.3% were from 45 to 64; and 19.3% were 65 years of age or older. The gender makeup of the city was 48.0% male and 52.0% female.
As of the census [11] of 2000, there were 8,312 people, 3,517 households, and 2,324 families residing in the city. The population density was 104.8 inhabitants per square mile (40.5/km2). There were 3,858 housing units at an average density of 48.7 per square mile (18.8/km2). The racial makeup of the city was 99.22% White, 0.01% African American, 1.48% Native American, 0.91% Asian, 0.07% Pacific Islander, 0.08% from other races, and 0.0% from two or more races. Hispanic or Latino residents of any race were 0.46% of the population.
There were 3,517 households, out of which 27.7% had children under the age of 18 living with them, 52.9% were married couples living together, 9.7% had a female householder with no husband present, and 33.9% were non-families. 28.7% of all households were made up of individuals, and 13.1% had someone living alone who was 65 years of age or older. The average household size was 2.32 and the average family size was 2.84.
In the city 22.5% of the population was under the age of 18, 6.6% was from 18 to 24, 27.3% from 25 to 44, 26.2% from 45 to 64, and 17.6% was 65 years of age or older. The median age was 41 years. For every 100 females, there were 93.2 males. For every 100 females age 18 and over, there were 88.8 males.
The median income for a household in the city was $29,485, and the median income for a family was $38,378. Males had a median income of $29,202 versus $20,737 for females. The per capita income for the city was $16,061. About 8.4% of families and 12.4% of the population were below the poverty line, including 13.7% of those under age 18 and 11.9% of those age 65 or over.
The school district for this community is Regional School Unit 39. [12]