Johnson County was established on December 21, 1837 by the legislature of the Wisconsin Territory, one of thirteen counties established by that body in a comprehensive act.[5][6] The county's area was partitioned from Dubuque County, and was not initially provided with a civil government, instead being governed by Cedar County officials. It was originally named for the US Vice President Richard M. Johnson (1780–1850).[7] In 2020, the Johnson County Board of Supervisors voted unanimously to change the county's namesake to be Lulu Merle Johnson (1907–1995), the first black woman in the state to earn a doctorate. Vice President Johnson had a common law wife whom he could not marry since it was against the laws at that time to have an interracial marriage. They had two children together and she was in charge of his plantation when he was away on business. He was open about his relationship with her which was unusual for the time. Many feel that either namesake is worthy.[8]
The first courthouse in the county was a two-story log cabin structure, built in 1838 in the settlement of Napoleon,[9] about two miles south of the current courthouse.[10] The building stood across from what later would become the James McCollister Farmstead on land later owned by Philip Clark.
Old Johnson County Courthouse, Iowa City, 1857-1899
After Iowa City was established by fiat as the new territorial capitol of Iowa, the county seat was removed there.[11] The second Johnson County Courthouse, the first in Iowa City, was built on Lot 8 Block 8 of the County Seat Addition to Iowa City in 1842 for $3,690.[10] This location was in the southeast corner of the intersection of Harrison and Clinton Streets. The building was 56 x 28 feet and two stories tall.[12] It was built by James Trimble, who had previously built the first jail.[10]
A third courthouse was built in 1857 in the courthouse square on Clinton Street between Court and Harrison Streets. It was used until 1901, after cracks appeared in its south wall in 1899.[13] The building was apparently built of brick with stone and wood ornamentation.[14]
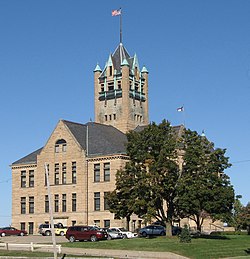
The Richardsonian Romanesque style courthouse in use today was designed by the firm of Rush, Bowman and Rush of Grand Rapids, Michigan.[15] It was bid at a cost of $111,000 and built by the firm Rowson & Son of Johnson County.[16] The cornerstone was laid in December 1899.[17] The building's tower was based on Henry Hobson Richardson's design for the spire of Trinity Church in Boston.[18] The building was dedicated on June 8, 1901.[19] The currently unused jail that stands to the west of the courthouse was designed by C.L. Wundt of Burlington, Iowa on behalf of the Stewart Iron Works in Cleveland and bid for $14,000.[20]
Geography
According to the United States Census Bureau, the county has a total area of 623.063 square miles (1,613.73km2), of which 612.997 square miles (1,587.65km2) is land and 10.066 square miles (26.07km2) (1.62%) is water.[21] It is the 20th largest county in Iowa by total area.[22]
U.S. Decennial Census[24] 1790–1960[25] 1900–1990[26] 1990–2000[27] 2010–2020[3]
As of the second quarter of 2025, the median home value in Johnson County was $343,126.[28]
As of the 2024 American Community Survey, there are 66,816 estimated households in Johnson County with an average of 2.26 persons per household. The county has a median household income of $74,575. Approximately 18.4% of the county's population lives at or below the poverty line. Johnson County has an estimated 67.5% employment rate, with 55.7% of the population holding a bachelor's degree or higher and 95.4% holding a high school diploma.[3] There were 70,516 housing units at an average density of 115.03 per square mile (44.4/km2).
The top five reported languages (people were allowed to report up to two languages, thus the figures will generally add to more than 100%) were English (85.1%), Spanish (4.7%), Indo-European (4.1%), Asian and Pacific Islander (3.9%), and Other (2.2%).
The median age in the county was 32.1 years.
Johnson County, Iowa – racial and ethnic composition Note: the US Census treats Hispanic/Latino as an ethnic category. This table excludes Latinos from the racial categories and assigns them to a separate category. Hispanics/Latinos may be of any race.
Population of Johnson County from the U.S. census data
As of the 2020 census, there were 152,854 people, 61,335 households, and 32,889 families residing in the county.[34] The population density was 249.36 inhabitants per square mile (96.3/km2). There were 65,916 housing units at an average density of 107.53 per square mile (41.5/km2). The racial makeup of the county was 76.60% White, 8.40% African American, 0.21% Native American, 5.63% Asian, 0.03% Pacific Islander, 2.75% from some other races and 6.38% from two or more races. Hispanic or Latino people of any race were 6.67% of the population.[35][36]
The median age was 31.2 years, with 20.1% of residents under the age of 18 and 12.6% of residents 65 years of age or older. For every 100 females there were 98.1 males, and for every 100 females age 18 and over there were 96.1 males age 18 and over.[37]
83.3% of residents lived in urban areas, while 16.7% lived in rural areas.[38]
There were 61,335 households in the county, of which 26.1% had children under the age of 18 living in them. Of all households, 42.0% were married-couple households, 22.6% were households with a male householder and no spouse or partner present, and 27.8% were households with a female householder and no spouse or partner present. About 31.5% of all households were made up of individuals and 8.5% had someone living alone who was 65 years of age or older.[37]
There were 65,916 housing units, of which 6.9% were vacant. Among occupied housing units, 57.0% were owner-occupied and 43.0% were renter-occupied. The homeowner vacancy rate was 2.1% and the rental vacancy rate was 7.7%.[37]
2010 census
As of the 2010 census, there were 130,882 people, 52,715 households, and _ families residing in the county. The population density was 213.51 inhabitants per square mile (82.4/km2). There were 55,967 housing units at an average density of 91.30 per square mile (35.3/km2). The racial makeup of the county was 85.64% White, 4.82% African American, 0.22% Native American, 5.21% Asian, 0.04% Pacific Islander, 1.81% from some other races and 2.27% from two or more races. Hispanic or Latino people of any race were 4.74% of the population.[39]
2000 census
As of the 2000 census, there were 111,006 people, 44,080 households, and 23,582 families residing in the county. The population density was 181.09 inhabitants per square mile (69.9/km2). There were 45,831 housing units at an average density of 74.77 per square mile (28.9/km2). The racial makeup of the county was 90.13% White, 2.90% African American, 0.28% Native American, 4.12% Asian, 0.04% Pacific Islander, 1.01% from some other races and 1.51% from two or more races. Hispanic or Latino people of any race were 2.51% of the population.
There were 44,080 households, out of which 26.50% had children under the age of 18 living with them, 43.90% were married couples living together, 6.80% had a female householder with no husband present, and 46.50% were non-families. 30.20% of all households were made up of individuals, and 5.60% had someone living alone who was 65 years of age or older. The average household size was 2.34 and the average family size was 2.97.
Age spread: 20.10% under the age of 18, 23.40% from 18 to 24, 30.80% from 25 to 44, 18.20% from 45 to 64, and 7.40% who were 65 years of age or older. The median age was 28 years. For every 100 females, there were 99.10 males. For every 100 females age 18 and over, there were 97.30 males.
The median income for a household in the county was $40,060, and the median income for a family was $60,112. Males had a median income of $36,279 versus $29,793 for females. The per capita income for the county was $22,220. About 5.20% of families and 15.00% of the population were below the poverty line, including 8.10% of those under age 18 and 3.80% of those age 65 or over.
Politics
Largely due to the presence of the University of Iowa, Johnson County is considered the most liberal county in Iowa and a stronghold of the Democratic Party, and has always been among Iowa's most Democratic counties since the Civil War. It has been the strongest Democratic county in the state since 1984. This trend predates the recent swing toward the Democrats in counties influenced by college towns (this trend was less prevalent in Story County, home Iowa State University in Ames, until 1988). The last Republican to win the county in a presidential election was Richard Nixon in 1960, and the last Republican to even get 40 percent of the county's vote was Ronald Reagan in 1984. The last time the GOP won the county in a gubernatorial election was the 1978 Iowa gubernatorial election. As a measure of how strongly Democratic the county has been, Democrats easily carried it even in the national Republican landslides of 1972, 1984 and 1988, and the county was the only county in Iowa to vote for Democrat Alton B. Parker over Republican Theodore Roosevelt in 1904. In 2020, Joe Biden received the highest percentage of the vote received by any Democrat in the county's history; indeed, by any candidate of any party.[40] In 2024, it was the only county to not vote for Donald Trump in the state's Republican presidential caucuses. Nikki Haley won the county by a single vote.[41][42][43]
Johnson County's Democratic bent is just as pronounced at the state level. It was the lone county to vote Democratic in statewide Republican landslides, such as Senator Chuck Grassley's re-elections in 2010 and 2016 or Governor Terry Branstad's re-election in 2014.
United States presidential election results for Johnson County, Iowa[44]
↑The other counties created on December 21, 1837: Benton, Buchanan, Cedar, Clayton, Clinton, Delaware, Fayette, Jackson, Jones, Keokuk, Linn, and Scott.
↑History of Johnson County, Iowa 1836-1882 (1883). Reproduction by Unigraphic Inc. pp. 165-6.
↑This no longer exists as a separate settlement but as part of Iowa City. Its former existence is recognized by the present Napoleon Park, accessed via Napoleon Lane (41.63350N, 91.53147W). Napoleon Lane Google Maps (accessed 18 August 2018)
This page is based on this Wikipedia article Text is available under the CC BY-SA 4.0 license; additional terms may apply. Images, videos and audio are available under their respective licenses.