The United Kingdom's Climate Change Programme was launched in November 2000 by the British government in response to its commitment agreed at the 1992 United Nations Conference on Environment and Development (UNCED). The 2000 programme was updated in March 2006 following a review launched in September 2004.

The energy policy of the United States is determined by federal, state, and local entities. It addresses issues of energy production, distribution, consumption, and modes of use, such as building codes, mileage standards, and commuting policies. Energy policy may be addressed via legislation, regulation, court decisions, public participation, and other techniques.
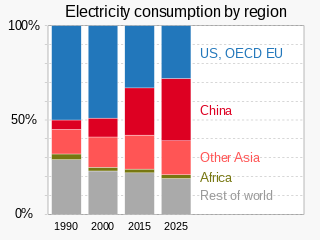
Electric energy consumption is energy consumption in the form of electrical energy. About a fifth of global energy is consumed as electricity: for residential, industrial, commercial, transportation and other purposes. Quickly increasing this share by further electrification is extremely important to limit climate change, because most other energy is consumed by burning fossil fuels thus emitting greenhouse gases which trap heat.

Energy in the United States is obtained from a diverse portfolio of sources, although the majority came from fossil fuels in 2021, as 36% of the nation's energy originated from petroleum, 32% from natural gas, and 11% from coal. Electricity from nuclear power supplied 8% and renewable energy supplied 12%, which includes biomass, wind, hydro, solar and geothermal.

The natural environment, commonly referred to simply as the environment, is all living and non-living things that occur naturally on Earth or some part of it. This includes complete ecological units that function as natural systems without massive human intervention, including all vegetation, animals, microorganisms, rocks, atmosphere and natural phenomena that occur within their boundaries. And it includes universal natural resources and physical phenomena that lack clear-cut boundaries, such as air, water, and climate, as well as energy, radiation, electric charge, and magnetism, not originating from human activity.

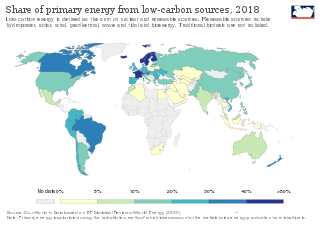
A low-carbon economy (LCE) or decarbonised economy is an economy based on energy sources that produce low levels of greenhouse gas (GHG) emissions. GHG emissions due to human activity are the dominant cause of observed climate change since the mid-20th century. Continued emission of greenhouse gases will cause long-lasting changes around the world, increasing the likelihood of severe, pervasive, and irreversible effects for people and ecosystems. Shifting to a low-carbon economy on a global scale could bring substantial benefits both for developed and developing countries. Many countries around the world are designing and implementing low-emission development strategies (LEDS). These strategies seek to achieve social, economic, and environmental development goals while reducing long-term greenhouse gas emissions and increasing resilience to the effects of climate change.
The United States produced 5.2 billion metric tons of carbon dioxide equivalent greenhouse gas (GHG) emissions in 2020, the second largest in the world after greenhouse gas emissions by China and among the countries with the highest greenhouse gas emissions per person. In 2019 China is estimated to have emitted 27% of world GHG, followed by the United States with 11%, then India with 6.6%. In total the United States has emitted a quarter of world GHG, more than any other country. Annual emissions are over 15 tons per person and, amongst the top eight emitters, is the highest country by greenhouse gas emissions per person. However, the IEA estimates that the richest decile in the US emits over 55 tonnes of CO2 per capita each year. Because coal-fired power stations are gradually shutting down, in the 2010s emissions from electricity generation fell to second place behind transportation which is now the largest single source. In 2020, 27% of the GHG emissions of the United States were from transportation, 25% from electricity, 24% from industry, 13% from commercial and residential buildings and 11% from agriculture. In 2021, the electric power sector was the second largest source of U.S. greenhouse gas emissions, accounting for 25% of the U.S. total. These greenhouse gas emissions are contributing to climate change in the United States, as well as worldwide.

China is both the world's largest energy consumer and the largest industrial country, and ensuring adequate energy supply to sustain economic growth has been a core concern of the Chinese Government since the founding of the People's Republic of China in 1949. Since the country's industrialization in the 1960s, China is currently the world's largest emitter of greenhouse gases, and coal in China is a major cause of global warming. However, from 2010 to 2015 China reduced energy consumption per unit of GDP by 18%, and CO2 emissions per unit of GDP by 20%. On a per-capita basis, China was only the world's 51st largest emitter of greenhouse gases in 2016. China is also the world's largest renewable energy producer, and the largest producer of hydroelectricity, solar power and wind power in the world. The energy policy of China is connected to its industrial policy, where the goals of China's industrial production dictate its energy demand managements.

Coal generated about 19.5% of the electricity at utility-scale facilities in the United States in 2022, down from 38.6% in 2014 and 51% in 2001. In 2021, coal supplied 9.5 quadrillion British thermal units (2,800 TWh) of primary energy to electric power plants, which made up 90% of coal's contribution to U.S. energy supply. Utilities buy more than 90% of the coal consumed in the United States. There were over 200 coal powered units across the United States in 2022. Coal plants have been closing since the 2010s due to cheaper and cleaner natural gas and renewables. Due to measures such as scrubbers air pollution from the plants kills far fewer people nowadays, but deaths in 2020 from PM 2.5 have been estimated at 1600. Environmentalists say that political action is needed to close them faster, to also reduce greenhouse gas emissions by the United States and better limit climate change.
Low-carbon power is electricity produced with substantially lower greenhouse gas emissions over the entire lifecycle than power generation using fossil fuels. The energy transition to low-carbon power is one of the most important actions required to limit climate change. Power sector emissions may have peaked in 2018. During the first six months of 2020, scientists observed an 8.8% decrease in global CO2 emissions relative to 2019 due to COVID-19 lockdown measures. The two main sources of the decrease in emissions included ground transportation (40%) and the power sector (22%). This event is the largest absolute decrease in CO2 emissions in history, but emphasizes that low-carbon power "must be based on structural and transformational changes in energy-production systems".

South Korea is a major energy importer, importing nearly all of its oil needs and ranking as the second-largest importer of liquefied natural gas in the world. Electricity generation in the country mainly comes from conventional thermal power, which accounts for more than two thirds of production, and from nuclear power.

The energy mix is a group of different primary energy sources from which secondary energy for direct use - such as electricity - is produced. Energy mix refers to all direct uses of energy, such as transportation and housing, and should not be confused with power generation mix, which refers only to generation of electricity.
Wind power in Indiana was limited to a few small water-pumping windmills on farms until 2008 with construction of Indiana's first utility-scale wind power facility, Goodland with a nameplate capacity of 130 MW. As of September 2017, Indiana had a total of 1897 MW of wind power capacity installed, ranking it 12th among U.S. states. Wind power was responsible for 4.8% of in-state electricity production in 2016.
In 2016, Arizona had 268 megawatts (MW) of wind powered electricity generating capacity, producing 0.5% of in-state generated electricity.

Alta Wind Energy Center (AWEC), also known as Mojave Wind Farm, is the third largest onshore wind energy project in the world. The Alta Wind Energy Center is a wind farm located in Tehachapi Pass of the Tehachapi Mountains, in Kern County, California. As of 2022, it is the largest wind farm in the United States, with a combined installed capacity of 1,550 MW (2,080,000 hp). The project, being developed near Tehachapi Pass Wind Farm— site of the first large-scale wind farms installed in the U.S. in the 1970s and 1980s—is "a powerful illustration of the growing size and scope of modern wind projects".

Electricity sector in Luxembourg describes electricity issues in Luxembourg. Luxembourg is a member of OECD and European Union. Luxembourg imports most of its energy. Luxembourg is the EU country with the second smallest forecast of renewables in 2020. Luxembourg has one of the highest emissions of carbon dioxide per person in Europe.
As of the end of 2021, New Mexico had 4,001 megawatts (MW) of wind powered electricity generating capacity, responsible for 30% of electricity produced that year. Wind power in New Mexico has the potential to generate more than all of the electricity consumed in the state.