Minnesota's 8th congressional district

Last updated

Minnesota's 8th congressional district
Minnesota's 8th congressional district (since 2023).svg
Minnesota's 8th congressional district
Interactive map of district boundaries since January 3, 2023
Representative
Area27,583 [1]  sq mi (71,440 km2)
Distribution
  • 61.53% rural [2]
  • 38.47% urban
Population (2023)727,776 [3]
Median household
income
$73,546 [3]
Ethnicity
Cook PVI R+7 [4]
External image
Searchtool.svg THIS govtrack.us MAP, is a useful representation of the 8th CD's borders, based on Google Maps.

Minnesota's 8th congressional district covers the northeastern part of Minnesota. It is anchored by Duluth, the state's fifth-largest city. It also includes most of the Mesabi & Vermilion iron ranges, and the Boundary Waters Canoe Area in the Superior National Forest. The district has robust mining, agriculture, tourism, and shipping industries.

Contents

The district is currently represented by Republican Pete Stauber. [5] [6]

History

Minnesota's 8th congressional district was first established after the 1900 census and first contested in 1902. [7] Early settlement patterns of the district were from Northern Europe (especially from the Nordics) [8] , leading to a predominantly white, working-class population tied to extractive industries. [9] From 1933 to 1935, the district was temporarily inactive, with representatives elected at-large statewide due to redistricting disputes resolved by the U.S. Supreme Court in Smiley v. Holm (1932). [10] The district had initial Republican dominance but gave way to third-party influences and eventually to the Democratic-Farmer-Labor (DFL) party. [11]

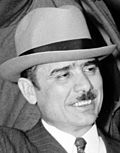
The first representative was Republican James Bede, who served from 1903 to 1909, followed by Clarence B. Miller (Republican, 1909–1919). In 1918, William Leighton Carss won as a Farmer-Labor candidate, serving until 1921 and again from 1925 to 1929 after brief Republican control.

Post-World War II, the district solidified as a DFL stronghold, with John Blatnik serving from 1947 to 1974. He was succeeded by DFLer Jim Oberstar (1975–2011), who chaired the House Transportation Committee and held the seat for 36 years. [12] [13] Redistricting in the 1980s and after usually involved courts due to legislative gridlock. After the 1980 census, a federal court ordered new districts in 1982 following a lawsuit. A similar situation occurred in 1992 (after state and federal court disputes), 2002 (via a judicial panel), and 2012 (following a gubernatorial veto). [14] These changes expanded the district southward and added more rural and suburban areas like Chisago and Isanti counties.

After nearly six decades of comfortably voting DFL, Republican Chip Cravaack defeated Oberstar in 2010 amid discontent with the economy and backlash against the recently passed Affordable Care Act. [15] [16] DFLer Rick Nolan recaptured it in 2012 [17] , serving until 2019 after narrow 2014 and 2016 wins. [18] [19] Despite Nolan's win, Donald Trump carried the district by a 15-point margin in the concurrent presidential election. In the 2018 midterm election, it was one of only three congressional districts in the country which flipped to Republican. Republican Pete Stauber won re-elections in 2020, 2022, and 2024 with growing margins each time. [20]

Apportionment

The district was the last district assigned nationwide after both the 2010 and 2020 censuses. After the 2020 census in particular, in spite of early predictions that it would be eliminated, Minnesota held onto the district by a mere 89 people, beating out New York's 27th district for the last spot. [21]

Composition

For the 118th and successive Congresses (based on redistricting following the 2020 census), the district contains all or portions of the following counties, townships, and municipalities: [22]

AitkinCounty (46)

All 46 townships and municipalities

BeckerCounty (14)

Callaway, Callaway Township, Eagle View Township, Forest Township, Maple Grove Township, Ogema, Pine Point Township, Riceville Township, Round Lake Township, Savannah Township, Spring Creek Township, Sugar Bush Township, Two Inlets Township, White Earth Township

BeltramiCounty (50)

All 50 townships and municipalities

CarltonCounty (28)

All 28 townships and municipalities

CassCounty (65)

All 65 townships and municipalities

ChisagoCounty (18)

All 18 townships and municipalities

ClearwaterCounty (27)

All 27 townships and municipalities

CookCounty (4)

All 4 townships and municipalities

Crow WingCounty (46)

All 46 townships and municipalities

HubbardCounty (20)

Akeley Township, Arago Township, Clay Township, Clover Township, Farden Township, Fern Township, Guthrie Township, Hart Lake Township, Helga Township, Hendrickson Township, Lake Alice Township, Lake Emma Township, Lake George Township, Lake Hattie Township, Lakeport Township, Laporte, Rockwood Township, Schoolcraft Township, Steamboat River Township, Thorpe Township

IsantiCounty (17)

All 17 townships and municipalities

ItascaCounty (57)

All 57 townships and municipalities

KanabecCounty (20)

All 20 townships and municipalities

MahnomenCounty (19)

All 19 townships and municipalities

KoochichingCounty (6)

All 6 townships and municipalities

LakeCounty (8)

All 8 townships and municipalities

Lake of the WoodsCounty (35)

All 35 townships and municipalities

Mille LacsCounty (25)

All 25 townships and municipalities

PineCounty (47)

All 47 townships and municipalities

St. LouisCounty (101)

All 101 townships and municipalities

WashingtonCounty (6)

Hugo, Forest Lake, Marine on St. Croix, May Township, Scandia, Stillwater Township (pat; also 4th)

Demographics

The district is mostly rural (61.5%), covering over 27,500 square miles, with a density of around 23 people per square mile. Major industries include health care, retail, and manufacturing, though employment in traditional sectors like taconite mining has declined from 15,000 jobs in the 1970s to about 4,300 today. The district has aged, with median ages in many counties exceeding 40, and education levels have risen, with over 25% of adults in some counties holding bachelor's degrees by 2012. Homeownership is high at 78.3%.

Sex

Ethnicity

Minnesota's 8th district has one of the highest proportions of non-Hispanic whites in the nation. 98.4% of people over the age of 85 are non-Hispanic whites. 86% of those in the 0-4 year old bracket are non-Hispanic white, compared to less than 50% of the nation at large. [24]

Ancestry

The ancestry of Minnesota's 8th district is dominated by Northern Europeans: German Americans, Norwegian Americans, Swedish Americans, and Danish Americans make up over 55% of the population. [23] Minnesota's 8th district has the highest percentage of Swedish Americans of any congressional district in the country.

Place of birth

Language

Language spoken at home other than English

  • Spanish 1.0%
  • German 0.4%
  • Native American languages 0.4%
  • French 0.1%
  • Chinese 0.1%

List of members representing the district

MemberPartyYearsCong
ress
Electoral history
District created March 4, 1903
James-adam-bede.jpg
James Bede
(Pine City)
Republican March 4, 1903 –
March 3, 1909
58th
59th
60th
Elected in 1902.
Re-elected in 1904.
Re-elected in 1906.
Lost renomination.
ClarenceBMiller.jpg
Clarence B. Miller
(Duluth)
Republican March 4, 1909 –
March 3, 1919
61st
62nd
63rd
64th
65th
Elected in 1908.
Re-elected in 1910.
Re-elected in 1912.
Re-elected in 1914.
Re-elected in 1916.
Lost re-election.
Carss, William L..jpg
William Leighton Carss
(Proctor)
Farmer–Labor March 4, 1919 –
March 3, 1921
66th Elected in 1918.
Lost re-election as a Democrat.
Democratic
OscarLarson.jpg
Oscar Larson
(Duluth)
Republican March 4, 1921 –
March 3, 1925
67th
68th
Elected in 1920.
Re-elected in 1922.
Retired.
Carss, William L..jpg
William Leighton Carss
(Proctor)
Farmer–Labor March 4, 1925 –
March 3, 1929
69th
70th
Elected in 1924.
Re-elected in 1926.
Lost re-election.
William Alvin Pittenger.jpg
William Alvin Pittenger
(Duluth)
Republican March 4, 1929 –
March 3, 1933
71st
72nd
Elected in 1928.
Re-elected in 1930.
Redistricted to the at-large district and lost re-election.
District inactiveMarch 4, 1933 –
January 3, 1935
73rd All members elected At-large on a general ticket
William Alvin Pittenger.jpg
William Alvin Pittenger
(Duluth)
Republican January 3, 1935 –
January 3, 1937
74th Elected in 1934.
Lost re-election.
JohnTBernard.jpg
John Bernard
(Eveleth)
Farmer–Labor January 3, 1937 –
January 3, 1939
75th Elected in 1936.
Lost re-election.
William Alvin Pittenger.jpg
William Alvin Pittenger
(Duluth)
Republican January 3, 1939 –
January 3, 1947
76th
77th
78th
79th
Elected in 1938.
Re-elected in 1940.
Re-elected in 1942.
Re-elected in 1944.
Lost re-election.
John Anton Blatnik.jpg
John Blatnik
(Chisholm)
Democratic (DFL) January 3, 1947 –
December 31, 1974
80th
81st
82nd
83rd
84th
85th
86th
87th
88th
89th
90th
91st
92nd
93rd
Elected in 1946.
Re-elected in 1948.
Re-elected in 1950.
Re-elected in 1952.
Re-elected in 1954.
Re-elected in 1956.
Re-elected in 1958.
Re-elected in 1960.
Re-elected in 1962.
Re-elected in 1964.
Re-elected in 1966.
Re-elected in 1968.
Re-elected in 1970.
Re-elected in 1972.
Retired and resigned early.
VacantDecember 31, 1974 –
January 3, 1975
93rd
Oberstarj.jpg
Jim Oberstar
(Chisholm)
Democratic (DFL) January 3, 1975 –
January 3, 2011
94th
95th
96th
97th
98th
99th
100th
101st
102nd
103rd
104th
105th
106th
107th
108th
109th
110th
111th
Elected in 1974.
Re-elected in 1976.
Re-elected in 1978.
Re-elected in 1980.
Re-elected in 1982.
Re-elected in 1984.
Re-elected in 1986.
Re-elected in 1988.
Re-elected in 1990.
Re-elected in 1992.
Re-elected in 1994.
Re-elected in 1996.
Re-elected in 1998.
Re-elected in 2000.
Re-elected in 2002.
Re-elected in 2004.
Re-elected in 2006.
Re-elected in 2008.
Lost re-election.
Chip Cravaack, Official Portrait, 112th Congress.jpg
Chip Cravaack
(Lindström)
Republican January 3, 2011 –
January 3, 2013
112th Elected in 2010.
Lost re-election.
Rick Nolan 115th official photo.jpg
Rick Nolan
(Crosby)
Democratic (DFL) January 3, 2013 –
January 3, 2019
113th
114th
115th
Elected in 2012.
Re-elected in 2014.
Re-elected in 2016.
Retired to run for Lt. Governor of Minnesota.
Pete Stauber, official portrait, 116th Congress (3x4).jpg
Pete Stauber
(Hermantown)
Republican January 3, 2019 –
present
116th
117th
118th
119th
Elected in 2018.
Re-elected in 2020.
Re-elected in 2022.
Re-elected in 2024.

Recent election results

Vote share from 1982-2022 Vote share in Minnesota's 8th congressional district, 1982-2022.svg
Vote share from 1982–2022
Year DFL Republican OthersTotalResult
CandidateVotes%CandidateVotes%Votes%Votes%
2002 [25] Jim Oberstar 193,95968.6%Bob Lemen88,42331.2%349 [a] 0.1%283,931100.0%DFL hold
2004 Jim Oberstar 228,58665.2%Mark Groettum112,69332.2%9,204 [b] 2.6%350,483100.0%DFL hold
2006 Jim Oberstar 180,67063.6%Rod Grams97,68334.4%5,663 [c] 2.0%284,016100.0%DFL hold
2008 Jim Oberstar 241,83167.7%Michael Cummins114,87132.2%582 [d] 0.2%357,284100.0%DFL hold
2010 Jim Oberstar 129,09146.6% Chip Cravaack 133,49048.2%14,500 [e] 5.2%277,081100.0%Republican gain
2012 Rick Nolan 191,97654.3% Chip Cravaack 160,52045.4%1,1670.3%353,663100.0%DFL gain
2014 Rick Nolan 129,09048.5%Stewart Mills III125,35847.1%11,6354.4%266,083100.0% DFL hold
2016 Rick Nolan 179,09850.2%Stewart Mills III177,08949.6%7920.2%356,979100.0%DFL hold
2018 Joe Radinovich 141,94845.2% Pete Stauber 159,36450.7%12,6974.1%314,209100.0%Republican gain
2020Quinn Nystrom147,85337.6% Pete Stauber 223,43256.7%22,4265.7%393,711100.0%Republican hold
2022 Jennifer Schultz 140,77042.7% Pete Stauber 188,44457.2%3170.1%329,531100.0%Republican hold
2024 Jennifer Schultz 176,72441.9% Pete Stauber 244,49858.0%3840.1%421,222100.0%Republican hold
  1. Write-in: 349
  2. Van Presley (Green): 8,933 Write-in: 271
  3. Harry Welty (Unity): 5,508 Write-in: 155
  4. Write-in: 582
  5. Timothy Olson (IPM): 11,876 Richard Burton (Constitution): 2,492 Write-in: 132

Recent election results from statewide races

YearOfficeResults [26] [27] [28]
2008 President Obama 54% - 44%
Senate Franken 44% - 40%
2010 Governor Dayton 48% - 40%
Secretary of State Ritchie 51% - 43%
Auditor Otto 50% - 45%
Attorney General Swanson 55% - 39%
2012 President Obama 52% - 45%
Senate Klobuchar 66% - 30%
2014 Senate Franken 54% - 42%
Governor Dayton 51% - 43%
Secretary of State Simon 48% - 44%
Auditor Otto 52% - 39%
Attorney General Swanson 54% - 38%
2016 President Trump 52% - 40%
2018 Senate (Reg.) Klobuchar 55% - 42%
Senate (Spec.) Housley 48% - 47%
Governor Johnson 49% - 47%
Secretary of State Howe 49% - 47%
Auditor Myhra 48% - 45%
Attorney General Wardlow 50% - 44%
2020 President Trump 55% - 43%
Senate Lewis 51% - 41%
2022 Governor Jensen 52% - 44%
Secretary of State Crockett 53% - 46%
Auditor Wilson 54% - 40%
Attorney General Schultz 57% - 42%
2024 President Trump 56% - 42%
Senate White 49% - 48%

Historical district boundaries

2003-2013 United States House of Representatives, Minnesota District 8 map.gif
2003–2013
2013-2023 Minnesota US Congressional District 8 (since 2013).tif
2013–2023

See also

References

  1. "Minnesota congressional districts by urban and rural population and land area" (PDF). US Census Bureau. 2000. Retrieved April 2, 2007.
  2. Geography. "Congressional Districts Relationship Files (state-based) Bureau". census.gov.
  3. 1 2 "My Congressional District". census.gov. US Census Bureau Center for New Media & Promotion (CNMP).
  4. "2025 Cook PVI℠: District Map and List (119th Congress)". Cook Political Report. April 3, 2025. Retrieved April 5, 2025.
  5. "Minnesota Election Results 2018: Live Midterm Map by County & Analysis" . Retrieved November 7, 2018.
  6. "Minnesota's 8th Congressional District election, 2016 - Ballotpedia" . Retrieved November 14, 2016.
  7. Libraries, University of Minnesota (November 4, 1902). "Minnesota Historical Election Archive". Minnesota Historical Election Archive. Retrieved August 28, 2025.
  8. LaVigne, David (August 26, 2015). "Immigration to the Iron Range, 1880–1930". Minnesota Historical Society. Retrieved August 28, 2025.
  9. "Sulfide-Ore Copper Mining and or A Sustainable Boundary Waters Economy: The Need to Consider Real Tradeoffs" (PDF). Congress.gov. October 2017. Retrieved August 28, 2025.
  10. Schweigert, Benedict J. (2008). ""Now for a Clean Sweep!": Smiley v. Holm, Partisan Gerrymandering, and At-Large Congressional Elections". Michigan Law Review. 107 (1). The Michigan Law Review Association: 133–164. ISSN   0026-2234. JSTOR   40041659 . Retrieved August 28, 2025.
  11. Ostermeier, Dr. Eric (July 28, 2014). "The 8th Congressional District: Minnesota's Political Roller Coaster?". Smart Politics. Retrieved August 28, 2025.
  12. Baran, Madeleine (November 8, 2010). "Rep. Jim Oberstar: A timeline of his career". MPR News. Retrieved August 28, 2025.
  13. Eisele, Albert (November 4, 2010). "Oberstar's stunning defeat makes history". MinnPost. Retrieved August 28, 2025.
  14. "History of Minnesota Congressional Redistricting" (PDF). Minnesota Legislature. November 2018. Retrieved August 28, 2025.
  15. Hemphill, Stephanie (November 4, 2010). "Voters in the 8th District say Oberstar became big government". MPR News. Retrieved August 28, 2025.
  16. Dunbar, Elizabeth (November 10, 2010). "Politics in the 8th: A red blip or something more?". MPR News. Retrieved August 28, 2025.
  17. Libraries, University of Minnesota (November 6, 2012). "U.S. House, District 08, 2012 Election". Minnesota Historical Election Archive. Retrieved August 28, 2025.
  18. Libraries, University of Minnesota (November 4, 2014). "U.S. House, District 08, 2014 Election". Minnesota Historical Election Archive. Retrieved August 28, 2025.
  19. Libraries, University of Minnesota (November 8, 2016). "U.S. House, District 08, 2016 Election". Minnesota Historical Election Archive. Retrieved August 28, 2025.
  20. Kraker, Dan (October 25, 2024). "Congressional rematch tests strength of rightward political shift in northeastern Minnesota". MPR News. Retrieved August 28, 2025.
  21. "Minnesota avoids losing House seat to New York by 89 people". Associated Press . April 26, 2021.
  22. https://www2.census.gov/geo/maps/cong_dist/cd118/cd_based/ST27/CD118_MN08.pdf
  23. 1 2 "My Congressional District". Census.gov. January 25, 2017. Retrieved March 3, 2022.
  24. Area, Metro (September 4, 2018). "The Demographic Statistical Atlas of the United States". Statistical Atlas (in Kinyarwanda). Retrieved August 25, 2022.
  25. "Index". Election Results. November 5, 2002. Retrieved March 3, 2022.
  26. "Dra 2020".
  27. "State & Federal Results in Congressional District 8".
  28. "State & Federal Results in Congressional District 8".

47°15′01″N92°57′50″W / 47.25028°N 92.96389°W / 47.25028; -92.96389