2018 Texas State Senate election

Last updated

2018 Texas State Senate election
Flag of Texas.svg
  2016 November 6, 2018 2020  

15 of the 31 seats in the Texas State Senate
16 seats needed for a majority
 Majority partyMinority party
  Jane Nelson.jpg Kirk Watson.jpg
Leader Jane Nelson Kirk Watson
Party Republican Democratic
Leader's seat 12th 14th
Last election2011
Seats before21 [1] 10 [1]
Seats won1912
Seat changeDecrease2.svg2Increase2.svg2
Popular vote2,280,8842,026,761
Percentage52.14%46.33%

TxSen2018Election.svg
Senate results by district
     Republican hold     Democratic hold
     Republican gain     Democratic gain
     No election

President Pro Tempore before election

Kel Seliger
Republican

Elected President Pro Tempore

Kirk Watson
Democratic

The 2018 Texas State Senate elections took place as part of the biennial United States elections. Texas voters elected state senators in 15 of the state senate's 31 districts. State senators serve four-year terms in the Texas State Senate. A statewide map of Texas's state Senate districts can be obtained from the Texas Legislative Council here, and individual district maps can be obtained from the U.S. Census here.

Contents

A primary election on March 6, 2018, determined which candidates appeared on the November 6 general election ballot. Primary election results can be obtained from the Texas Secretary of State's website. [2]

Following the 2016 state senate elections, Republicans maintained effective control of the Senate with 20 members. However, they gained an extra seat by flipping the 19th District in the August 2018 special election. [1]

To claim control of the chamber from Republicans, the Democrats would have needed to net six Senate seats. The Democratic Party gained two seats, leaving the Republicans with a 19 to 12 majority in the chamber.

Summary of race results

Summary of the November 6, 2018 Texas Senate election results
Texas State Senate 2012.svg
PartyCandidatesVotesSeats
No. %BeforeUpWonAfter+/–
Republican 142,280,88452.1421121019Decrease2.svg2
Democratic 142,026,76146.33103512Increase2.svg2
Libertarian 767,0621.900000Steady2.svg
Total3,525,443100.0035151535Steady2.svg
Source: [3]
Popular vote
Republican
52.14%
Democratic
46.33%
Libertarian
1.90%
Senate seats won
Republican
66.67%
Democratic
33.33%

Retirements

One incumbent did not run for re-election in 2020:

Republican

  1. District 8: Van Taylor is running for U.S House of Texas's 3rd district.

Seats gained in preceding special elections

Republicans

  1. District 19: Pete Flores defeated Pete Gallego in a preceding special election on September 18, 2018 to flip this seat. The seat was vacated by Carlos Uresti, who resigned after multiple convictions on fraud and laundering charges.

Incumbents defeated

In the primary election

Republicans

  1. District 30: Craig Estes lost to Pat Fallon.

In the general election

Republicans

  1. District 10: Konni Burton lost to Beverly Powell.
  2. District 16: Don Huffines lost to Nathan M. Johnson.

Close races

DistrictWinnerMargin
District 8Republican2.36%
District 10Democratic (flip)3.04%
District 17Republican4.64%
District 9Republican8.06%
District 16Democratic (flip)8.26%
District 5Republican13.87%
District 25Republican15.36%
District 7Republican17.41%
District 2Republican18.7%

Summary of results by State Senate District

Race results: [3]

DistrictDemocraticRepublicanLibertarianTotalResult
Votes%Votes%Votes%Votes%
District 2 104,89740.65%153,15159.35%--258,048100.00%Republican hold
District 3 56,39820.53%215,05878.27%3,3011.20%274,757100.00%Republican hold
District 5 136,79241.47%182,55055.34%10,5003.18%329,842100.00%Republican hold
District 7 124,23240.34%177,86457.75%5,8781.91%307,974100.00%Republican hold
District 8 162,15748.82%169,99551.18%--332,152100.00%Republican hold
District 9 112,53745.97%132,25654.03%--244,793100.00%Republican hold
District 10 148,95951.73%138,96848.27%--287,927100.00%D GAIN from R
District 14 276,05271.93%96,83425.23%10,8892.84%383,775100.00%Democratic hold
District 15 153,01665.18%75,51832.17%6,2292.65%234,763100.00%Democratic hold
District 16 159,22854.13%134,93345.87%--294,161100.00%D GAIN from R
District 17 143,97846.80%158,26351.44%5,3961.75%307,637100.00%Republican hold
District 23 192,148100.00%----192,148100.00%Democratic hold
District 25 173,69842.32%236,75357.68%--410,451100.00%Republican hold
District 30 82,66926.08%234,37473.92%--317,043100.00%Republican hold
District 31 --174,36787.52%24,86912.48%199,236100.00%Republican hold
Total2,026,76146.33%2,280,88452.14%67,0621.53%4,374,707100.00%

Source: [4]

State Senate District Incumbent PartyElected SenatorParty
2nd Bob Hall Rep Bob Hall Rep
3rd Robert Nichols Rep Robert Nichols Rep
5th Charles Schwertner Rep Charles Schwertner Rep
7th Paul Bettencourt Rep Paul Bettencourt Rep
8th Van Taylor Rep Angela Paxton Rep
9th Kelly Hancock Rep Kelly Hancock Rep
10th Konni Burton Rep Beverly Powell Dem
14th Kirk Watson Dem Kirk Watson Dem
15th John Whitmire Dem John Whitmire Dem
16th Don Huffines Rep Nathan Johnson Dem
17th Joan Huffman Rep Joan Huffman Rep
19th Vacant [5] Dem Pete Flores Rep
23rd Royce West Dem Royce West Dem
25th Donna Campbell Rep Donna Campbell Rep
30th Craig Estes Rep Pat Fallon Rep
31st Kel Seliger Rep Kel Seliger Rep

Detailed results by State Senate District

District 2District 3District 5District 7District 8District 9District 10District 14District 15District 16District 17District 19District 23District 25District 30District 31

Sources: [6] [2]

District 2

Republican primary
PartyCandidateVotes%
Republican Bob Hall (incumbent) 35,530 53.2
Republican Cindy Burkett31,21646.8
Total votes66,746 100.0
Democratic primary
PartyCandidateVotes%
Democratic Kendall Scudder 20,573 100.0
Total votes20,573 100.0
Texas's 2nd State Senate District General Election, 2018
PartyCandidateVotes%
Republican Bob Hall (incumbent) 153,151 59.35
Democratic Kendall Scudder104,89740.65
Total votes258,048 100.0
Republican hold

District 3

Democratic primary
PartyCandidateVotes%
Democratic Shirley Layton 12,452 100.0
Total votes12,452 100.0
Republican primary
PartyCandidateVotes%
Republican Robert Nichols (incumbent) 78,434 100.0
Total votes78,434 100.0
Texas's 3rd State Senate District General Election, 2018
PartyCandidateVotes%
Republican Robert Nichols (incumbent) 215,058 78.27
Democratic Shirley Layton56,39820.53
Libertarian Bruce Quarles3,3011.20
Total votes274,757 100.0
Republican hold

District 5

Republican primary
PartyCandidateVotes%
Republican Charles Schwertner (incumbent) 50,254 75.1
Republican Harold Ramm16,64824.9
Total votes66,902 100.0
Democratic primary
PartyCandidateVotes%
Democratic Meg Walsh 22,605 71.1
Democratic Brian E. Cronin5,38316.9
Democratic Glenn "Grumpy" Williams3,79111.9
Total votes31,779 100.0
Texas's 5th State Senate District General Election, 2018
PartyCandidateVotes%
Republican Charles Schwertner (incumbent) 182,550 55.34
Democratic Meg Walsh136,79241.47
Libertarian Amy Lyons10,5003.18
Total votes329,842 100.0
Republican hold

District 7

Republican primary
PartyCandidateVotes%
Republican Paul Bettencourt (incumbent) 44,950 100.0
Total votes44,950 100.0
Democratic primary
PartyCandidateVotes%
Democratic David Romero 22,989 100.0
Total votes22,989 100.0
Texas's 7th State Senate District General Election, 2018
PartyCandidateVotes%
Republican Paul Bettencourt (incumbent) 177,864 57.75
Democratic David Romero124,23240.34
Libertarian Tom Glass5,8781.91
Total votes307,974 100.0
Republican hold

District 8

Republican primary
PartyCandidateVotes%
Republican Angela Paxton 32,756 54.3
Republican Phillip Huffines27,54545.7
Total votes60,301 100.0
Democratic primary
PartyCandidateVotes%
Democratic Mark Phariss 16,748 50.9
Democratic Brian Chaput16,14849.1
Total votes32,896 100.0
Texas's 8th State Senate District General Election, 2018
PartyCandidateVotes%
Republican Angela Paxton 169,995 51.18
Democratic Mark Phariss162,15748.82
Total votes332,152 100.0
Republican hold

District 9

Democratic primary
PartyCandidateVotes%
Democratic Gwenn Burud 21,382 100.0
Total votes21,382 100.0
Republican primary
PartyCandidateVotes%
Republican Kelly Hancock (incumbent) 31,188 100.0
Total votes31,188 100.0
Texas's 9th State Senate District General Election, 2018
PartyCandidateVotes%
Republican Kelly Hancock (incumbent) 132,256 54.03
Democratic Gwenn Burud112,53745.97
Total votes244,793 100.0
Republican hold

District 10

Republican primary
PartyCandidateVotes%
Republican Konni Burton (incumbent) 35,758 100.0
Total votes35,758 100.0
Democratic primary
PartyCandidateVotes%
Democratic Beverly Powell 23,148 61.6
Democratic Allison Campolo14,43238.4
Total votes37,580 100.0
Texas's 10th State Senate District General Election, 2018
PartyCandidateVotes%
Democratic Beverly Powell 148,959 51.73
Republican Konni Burton (incumbent)138,96848.27
Total votes287,927 99%
Democratic gain from Republican

District 14

Republican primary
PartyCandidateVotes%
Republican George W. Hindman 24,168 100.0
Total votes24,168 100.0
Democratic primary
PartyCandidateVotes%
Democratic Kirk Watson (incumbent) 82,626 100.0
Total votes82,626 100.0
Texas's 14th State Senate District General Election, 2018
PartyCandidateVotes%
Democratic Kirk Watson (incumbent) 276,052 71.93
Republican George Hindman96,83425.23
Libertarian Micah Verlander10,8892.84
Total votes383,775 100.0
Democratic hold

District 15

Republican primary
PartyCandidateVotes%
Republican Randy Orr 17,057 100.0
Total votes17,057 100.0
Democratic primary
PartyCandidateVotes%
Democratic John Whitmire (incumbent) 27,307 74.9
Democratic Damian Lacroix6,52017.9
Democratic Hank Segelke2,6197.2
Total votes36,446 100.0
Texas's 15th State Senate District General Election, 2018
PartyCandidateVotes%
Democratic John Whitmire (incumbent) 153,016 65.18
Republican Randy Orr75,51832.17
Libertarian Gilberto Velsquez, Jr.6,2292.65
Total votes234,763 100.0
Democratic hold

District 16

Republican primary
PartyCandidateVotes%
Republican Don Huffines (incumbent) 30,311 100.0
Total votes30,311 100.0
Democratic primary
PartyCandidateVotes%
Democratic Nathan Johnson 25,437 69.6
Democratic Joe Bogen11,12530.4
Total votes36,562 100.0
Texas's 16th State Senate District General Election, 2018
PartyCandidateVotes%
Democratic Nathan Johnson 159,228 54.13
Republican Don Huffines (incumbent)134,93345.87
Total votes294,161 100.0
Democratic gain from Republican

District 17

Republican primary
PartyCandidateVotes%
Republican Joan Huffman (incumbent) 36,830 72.7
Republican Kristin Tassin13,84927.3
Total votes50,679 100.0
Democratic primary
PartyCandidateVotes%
Democratic Rita Lucido 17,669 49.0
Democratic Fran Watson 12,663 35.1
Democratic Ahmad R. Hassan5,75715.9
Total votes36,089 100.0
Democratic primary
PartyCandidateVotes%
Democratic Rita Lucido 10,533 57.8
Democratic Fran Watson7,69442.2
Total votes18,227 100.0
Texas's 17th State Senate District General Election, 2018
PartyCandidateVotes%
Republican Joan Huffman (incumbent) 158,263 51.44
Democratic Rita Lucido143,97846.80
Libertarian Lauren LaCount5,3961.75
Total votes307,637 100.0
Republican hold

District 19

[7] [8]

Texas's 19th State Senate district special election, 2018
Primary election
PartyCandidateVotes%
Republican Pete Flores 8,965 34.37
Democratic Pete Gallego 7,541 28.91
Democratic Roland Gutierrez6,35124.35
Republican Carlos Antonio Raymond9123.49
Democratic Tomas Uresti7983.06
Democratic Charles Urbina Jones7833.0
Republican Jesse Alaniz4561.74
Libertarian Tony Valdivia2711.03
Total votes26,077 100.0
General election
Republican Pete Flores 23,576 56.67
Democratic Pete Gallego 20,91143.33
Total votes44,487 100.0
Republican gain from Democratic

District 23

Democratic primary
PartyCandidateVotes%
Democratic Royce West (incumbent) 50,226 100.0
Total votes50,226 100.0
Texas's 23rd State Senate District General Election, 2018
PartyCandidateVotes%
Democratic Royce West (incumbent) 192,148 100.0
Total votes192,148 100.0
Democratic hold

District 25

Republican primary
PartyCandidateVotes%
Republican Donna Campbell (incumbent) 59,143 73.7
Republican Shannon K. McClendon21,05526.3
Total votes80,198 100.0
Democratic primary
PartyCandidateVotes%
Democratic Steven Kling 23,017 51.1
Democratic Jack Guerra22,06448.9
Total votes45,081 100.0
Texas's 25th State Senate District General Election, 2018
PartyCandidateVotes%
Republican Donna Campbell (incumbent) 236,753 57.68
Democratic Steven Kling173,69842.32
Total votes410,451 100.0
Republican hold

District 30

Republican primary
PartyCandidateVotes%
Republican Pat Fallon 53,881 62.0
Republican Craig Estes (incumbent)19,64122.6
Republican Craig Carter13,37115.4
Total votes86,893 100.0
Democratic primary
PartyCandidateVotes%
Democratic Kevin Lopez 15,760 100.0
Total votes15,760 100.0
Texas's 30th State Senate District General Election, 2018
PartyCandidateVotes%
Republican Pat Fallon 234,374 73.92
Democratic Kevin Lopez82,66926.08
Total votes317,043 100.0
Republican hold

District 31

Republican primary
PartyCandidateVotes%
Republican Kel Seliger (incumbent) 40,664 50.4
Republican Mike Canon25,33531.4
Republican Victor Leal14,67118.2
Total votes80,670 100.0
Texas's 31st State Senate District General Election, 2018
PartyCandidateVotes%
Republican Kel Seliger (incumbent) 174,367 87.52
Libertarian Jack Westbrook24,86912.48
Total votes199,236 100.0
Republican hold

See also

Related Research Articles

<span class="mw-page-title-main">2006 Texas Legislature election</span>

The 2006 Texas Legislature election was held on Tuesday, November 7, 2006, in the U.S. state of Texas. The Texas Legislature election was conducted as a part of the 2006 Texas general election, which also included the 2006 United States Senate election in Texas, the 2006 United States House of Representatives elections in Texas, and the 2006 Texas gubernatorial election.

<span class="mw-page-title-main">2018 United States elections</span>

The 2018 United States elections were held on Tuesday, November 6, 2018. These midterm elections occurred during Republican Donald Trump's term. Democrats made a net gain of 41 seats in the United States House of Representatives, gaining a majority in the chamber and thereby ending the federal trifecta that the Republican Party had established in the 2016 elections. The Republican Party retained control of the United States Senate, making a net gain of two seats and defeating four Democratic incumbents in states that had voted for Trump in 2016. As a result of the 2018 elections, the 116th United States Congress became the first Congress since the 99th United States Congress in which the Democrats controlled the U.S. House of Representatives and the Republicans controlled the U.S. Senate.

<span class="mw-page-title-main">2020 United States Senate elections</span>

The 2020 United States Senate elections were held on November 3, 2020, with the 33 class 2 seats of the Senate contested in regular elections. Of these, 21 were held by Republicans, and 12 by Democrats. The winners were elected to six-year terms from January 3, 2021, to January 3, 2027. Two special elections for seats held by Republicans were also held in conjunction with the general elections: one in Arizona, to fill the vacancy created by John McCain's death in 2018; and one in Georgia, following Johnny Isakson's resignation in 2019. These elections ran concurrently with the 2020 United States presidential election in which incumbent Republican president Donald Trump lost to Democratic nominee Joe Biden.

<span class="mw-page-title-main">2018 Georgia State Senate election</span>

The 2018 Georgia State Senate elections took place as part of the biennial United States elections. Georgia voters elected state senators in all 56 of the state senate's districts. State senators serve two-year terms in the Georgia State Senate.

<span class="mw-page-title-main">2018 Texas House of Representatives election</span>

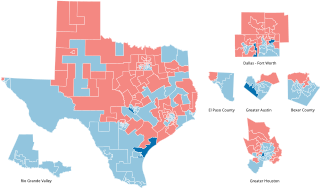
The 2018 Texas House of Representatives elections took place as part of the biennial United States elections. Texas voters elected state representatives in all 150 of the state house's districts. State representatives serve two-year terms in the Texas State House. A statewide map of Texas' state House districts can be obtained from the Texas Legislative Council here, and individual district maps can be obtained from the U.S. Census here.

<span class="mw-page-title-main">2018 Hawaii Senate election</span>

The 2018 Hawaii Senate elections took place as part of the biennial United States elections. Hawaii voters elected state senators in 13 of the state senate's 25 districts. State senators serve four-year terms in the Hawaii Senate.

<span class="mw-page-title-main">2018 Maine State Senate election</span>

The 2018 Maine State Senate elections took place as part of the biennial United States elections. Maine voters elected state senators in all 35 of the state senate's districts. State senators serve two-year terms in the State Senate.

<span class="mw-page-title-main">2018 Georgia House of Representatives election</span>

The 2018 Georgia House of Representatives elections took place as part of the biennial United States elections. Georgia voters elected state representatives in all 180 of the state house's districts. State representatives serve two-year terms in the Georgia House of Representatives.

<span class="mw-page-title-main">2018 Alabama Senate election</span>

The 2018 Alabama Senate elections took place on November 3, 2018, as part of the 2018 United States elections. Alabama voters elected state senators in all 35 of the state's Senate districts. State senators serve four-year terms in the Alabama Senate.

<span class="mw-page-title-main">2018 Iowa Senate election</span>

The 2018 Iowa State Senate elections took place as part of the biennial 2018 United States elections. Iowa voters elected state senators in half of the state senate's districts—the 25 odd-numbered state senate districts. State senators serve four-year terms in the Iowa State Senate, with half of the seats up for election each cycle.

<span class="mw-page-title-main">2010 Iowa Senate election</span>

The 2010 Iowa State Senate elections took place as part of the biennial 2010 United States elections. Iowa voters elected state senators in half of the state senate's districts—the 25 odd-numbered state senate districts. State senators serve four-year terms in the Iowa State Senate, with half of the seats up for election each cycle.

<span class="mw-page-title-main">2012 Iowa Senate election</span>

The 2012 Iowa State Senate elections took place as part of the biennial 2012 United States elections. Iowa voters elected state senators in 26 of the state senate's 50 districts—the 25 even-numbered state senate districts and the 49th district. State senators serve four-year terms in the Iowa State Senate, with half of the seats up for election each cycle. This was the first election cycle following the 2010 census and 2011 redistricting process.

<span class="mw-page-title-main">2004 Iowa Senate election</span>

The 2004 Iowa State Senate elections took place as part of the biennial 2004 United States elections. Iowa voters elected state senators in half of the state senate's districts—the 25 even-numbered state senate districts. State senators serve four-year terms in the Iowa State Senate, with half of the seats up for election each cycle.

<span class="mw-page-title-main">2020 Texas State Senate election</span>

The 2020 Texas State Senate elections took place as part of the biennial United States elections. Texas voters elected state senators in 16 of the 31 state senate districts. State senators serve four-year terms in the Texas State Senate. Those elected in 2020 will only be elected for two years, however, as part of the 2-4-4 term system. A statewide map of Texas's state Senate districts can be obtained from the Texas Legislative Council. and individual district maps can be obtained from the U.S. Census.

<span class="mw-page-title-main">2016 Texas State Senate election</span>

The 2016 Texas State Senate elections took place as part of the biennial United States elections. Texas voters elected state senators in 16 of the 31 state senate districts. State senators serve four-year terms in the Texas State Senate. A statewide map of Texas's state Senate districts can be obtained from the Texas Legislative Council here, and individual district maps can be obtained from the U.S. Census here.

<span class="mw-page-title-main">2014 Texas State Senate election</span>

The 2014 Texas State Senate elections took place as part of the biennial United States elections. Texas voters elected state senators in 15 of the 31 state senate districts. State senators serve four-year terms in the Texas State Senate. A statewide map of Texas's state Senate districts can be obtained from the Texas Legislative Council here, and individual district maps can be obtained from the U.S. Census here.

<span class="mw-page-title-main">2012 Texas State Senate election</span>

The 2012 Texas State Senate elections took place as part of the biennial United States elections. Texas voters elected state senators in all 31 State Senate districts. Typically, State senators serve four-year terms in the Texas State Senate; however, all Senate seats come up for election in the cycle after decennial redistricting. Due to this, senators elected in 2008 served only two-year terms, and half of the senators elected in this election served two-year terms, coming up for re-election again in 2014. A statewide map of Texas's state Senate districts can be obtained from the Texas Legislative Council here, and individual district maps can be obtained from the U.S. Census here.

<span class="mw-page-title-main">2022 United States state legislative elections</span>

The 2022 United States state legislative elections were held on November 8, 2022 for 88 state legislative chambers in 46 states. Across the fifty states, approximately 56 percent of all upper house seats and 92 percent of all lower house seats were up for election. These midterm elections coincided with other state and local elections, including gubernatorial elections in multiple states.

<span class="mw-page-title-main">2010 Texas State Senate election</span>

The 2010 Texas State Senate elections took place as part of the biennial United States elections. Texas voters elected state senators in 16 State Senate districts. State senators typically serve four-year terms in the Texas State Senate, but all Senators come up for election in the cycles following each decennial redistricting. As such, all of the seats up for this election were for two-year terms, with senators up for re-election in the following 2012 Texas State Senate elections.

The 2011 United States state legislative elections were held on November 8, 2011. Seven legislative chambers in four states held regularly-scheduled elections. These off-year elections coincided with other state and local elections, including gubernatorial elections in four states.

References

  1. 1 2 3 "Race Summary Report 2018 Special Runoff Election, Senate District 19". Texas Secretary of State. Archived from the original on December 19, 2018.
  2. 1 2 "Election Results". Texas Secretary of State . Retrieved August 4, 2018.
  3. 1 2 "Race Summary Report - 2018 General Election". Office of the Secretary of State. Archived from the original on April 28, 2021. Retrieved May 13, 2021.
  4. "Texas State Senate elections, 2018". Ballotpedia . Retrieved August 5, 2018.
  5. "2018 Special Election, Senate District 19". Texas Secretary of State. Archived from the original on August 7, 2018. Retrieved August 4, 2018.
  6. "Texas State Senate elections, 2018". Ballotpedia . Retrieved August 4, 2018.
  7. "Texas state legislative special elections, 2018". Ballotpedia . Retrieved August 5, 2018.
  8. "2018 Special Election, Senate District 19". Texas Secretary of State. Archived from the original on August 7, 2018. Retrieved August 5, 2018.