The Kansas Republican Party is the state affiliate political party in Kansas of the United States Republican Party. The Kansas Republican Party was organized in May 1859 and has often been the dominant political party in the state.

The politics of Oklahoma exists in a framework of a presidential republic modeled after the United States. The governor of Oklahoma is both head of state and head of government, and of a pluriform two-party system. Executive power is exercised by the governor and the government. Legislative power is vested in the governor and the bicameral Oklahoma Legislature. Judicial power is vested in the judiciary of Oklahoma. The political system is laid out in the 1907 Oklahoma Constitution.

The 2008 United States presidential election in Arizona took place on November 4, 2008, and was part of the 2008 United States presidential election. Voters chose 10 representatives, or electors to the Electoral College, who voted for president and vice president.

The 2014 United States Senate elections were held on November 4, 2014. A total of 36 seats in the 100-member U.S. Senate were contested. Thirty-three Class 2 seats were contested for regular six-year terms to be served from January 3, 2015 to January 3, 2021, and three Class 3 seats were contested in special elections due to Senate vacancies. The elections marked 100 years of direct elections of U.S. Senators. Going into the elections, 21 of the contested seats were held by the Democratic Party, while 15 were held by the Republican Party.

The 2010 Wisconsin Fall General Election was held in the U.S. state of Wisconsin on November 2, 2010. All of Wisconsin's executive and administrative officers were up for election as well as one of Wisconsin's U.S. Senate seats, Wisconsin's eight seats in the United States House of Representatives, seventeen seats in the Wisconsin State Senate, and all 99 seats in the Wisconsin State Assembly. The 2010 Wisconsin Fall Partisan Primary was held September 14, 2010.

The 2018 United States Senate elections were held on November 6, 2018. 33 of the 100 seats were contested in regular elections while two others were contested in special elections due to Senate vacancies in Minnesota and Mississippi. The winners were elected to six-year terms running from January 3, 2019, to January 3, 2025. Senate Democrats had 26 seats up for election, while Senate Republicans had nine seats up for election.

The 2020 United States Senate elections were held on November 3, 2020, with the 33 class 2 seats of the Senate contested in regular elections. Of these, 21 were held by Republicans, and 12 by Democrats. The winners were elected to six-year terms from January 3, 2021, to January 3, 2027. Two special elections for seats held by Republicans were also held in conjunction with the general elections: one in Arizona, to fill the vacancy created by John McCain's death in 2018; and one in Georgia, following Johnny Isakson's resignation in 2019. In both races, the appointed incumbent Republicans lost to Democrats. These elections ran concurrently with the 2020 United States presidential election in which incumbent Republican president Donald Trump lost to Democratic nominee Joe Biden.

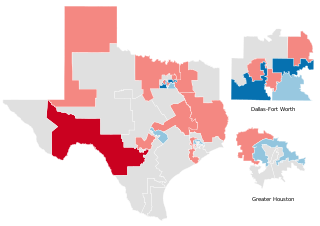
The 2018 Texas State Senate elections took place as part of the biennial United States elections. Texas voters elected state senators in 15 of the state senate's 31 districts. State senators serve four-year terms in the Texas State Senate. A statewide map of Texas's state Senate districts can be obtained from the Texas Legislative Council here, and individual district maps can be obtained from the U.S. Census here.

The 2018 Hawaii Senate elections took place as part of the biennial United States elections. Hawaii voters elected state senators in 13 of the state senate's 25 districts. State senators serve four-year terms in the Hawaii Senate.

The 2020 Iowa State Senate elections took place as part of the biennial 2020 United States state legislative elections. Iowa voters elected state senators in half of the state senate's districts – the 25 even-numbered state senate districts. State senators serve four-year terms in the Iowa Senate, with half of the seats up for election each cycle.

The 1990 Iowa State Senate elections took place as part of the biennial 1990 United States elections. Iowa voters elected state senators in half of the state senate's districts—the 25 odd-numbered state senate districts. State senators serve four-year terms in the Iowa State Senate, with half of the seats up for election each cycle. A statewide map of the 50 state Senate districts in the year 1990 is provided by the Iowa General Assembly here.

The 2020 Texas State Senate elections took place as part of the biennial United States elections. Texas voters elected state senators in 16 of the 31 state senate districts. State senators serve four-year terms in the Texas State Senate. Those elected in 2020 will only be elected for two years, however, as part of the 2-4-4 term system. A statewide map of Texas's state Senate districts can be obtained from the Texas Legislative Council. and individual district maps can be obtained from the U.S. Census.

The 1986 Iowa State Senate elections took place as part of the biennial 1986 United States elections. Iowa voters elected state senators in half of the state senate's districts—the 25 odd-numbered state senate districts. State senators serve four-year terms in the Iowa State Senate, with half of the seats up for election each cycle. A statewide map of the 50 state Senate districts in the year 1986 is provided by the Iowa General Assembly here.

The 1984 Iowa State Senate elections took place as part of the biennial 1984 United States elections. Iowa voters elected state senators in half of the state senate's districts—the 25 even-numbered state senate districts. State senators serve four-year terms in the Iowa State Senate, with half of the seats up for election each cycle. A statewide map of the 50 state Senate districts in the year 1984 is provided by the Iowa General Assembly here.

The 1980 Iowa State Senate elections took place as part of the biennial 1980 United States elections. Iowa voters elected state senators in half of the state senate's districts—the 25 even-numbered state senate districts. State senators serve four-year terms in the Iowa State Senate, with half of the seats up for election each cycle. A statewide map of the 50 state Senate districts in the year 1980 is provided by the Iowa General Assembly here.

The 1978 Iowa State Senate elections took place as part of the biennial 1978 United States elections. Iowa voters elected state senators in half of the state senate's districts—the 25 odd-numbered state senate districts. State senators serve four-year terms in the Iowa State Senate, with half of the seats up for election each cycle. A statewide map of the 50 state Senate districts in the year 1978 is provided by the Iowa General Assembly here.

The 1972 Iowa State Senate elections took place as part of the biennial 1972 United States elections. Iowa voters elected state senators in all of the state senate's 50 districts—the 25 even-numbered seats were up for regularly-scheduled four-year terms and, due to the oddities of redistricting following the 1970 Census, the 25 odd-numbered seats were up for shortened two-year terms. State senators typically serve four-year terms in the Iowa State Senate, with half of the seats traditionally up for election each cycle. The decennial census and redistricting process causes one cycle each decade to be disrupted.

The 2016 Texas State Senate elections took place as part of the biennial United States elections. Texas voters elected state senators in 16 of the 31 state senate districts. State senators serve four-year terms in the Texas State Senate. A statewide map of Texas's state Senate districts can be obtained from the Texas Legislative Council here, and individual district maps can be obtained from the U.S. Census here.

The 2012 Texas State Senate elections took place as part of the biennial United States elections. Texas voters elected state senators in all 31 State Senate districts. Typically, State senators serve four-year terms in the Texas State Senate; however, all Senate seats come up for election in the cycle after decennial redistricting. Due to this, senators elected in 2008 served only two-year terms, and half of the senators elected in this election served two-year terms, coming up for re-election again in 2014. A statewide map of Texas's state Senate districts can be obtained from the Texas Legislative Council here, and individual district maps can be obtained from the U.S. Census here.

The 2010 Texas State Senate elections took place as part of the biennial United States elections. Texas voters elected state senators in 16 State Senate districts. State senators typically serve four-year terms in the Texas State Senate, but all Senators come up for election in the cycles following each decennial redistricting. As such, all of the seats up for this election were for two-year terms, with senators up for re-election in the following 2012 Texas State Senate elections.


