2012 Texas State Senate election

Last updated

2012 Texas State Senate election
Flag of Texas.svg
  2010 November 6, 2012 2014  

All 31 seats in the Texas State Senate
16 seats needed for a majority
 Majority partyMinority partyThird party
 
Party Republican Democratic Libertarian
Last election19 seats, 70.65% [1] 12 seats, 22.71% [1] 0 seats, 6.61% [1]
Seats before19120
Seats won19120
Seat changeSteady2.svgSteady2.svgSteady2.svg
Popular vote4,327,8632,272,085355,249
Percentage62.65%32.76%5.12%
SwingDecrease2.svg 8.00%Increase2.svg 10.05%Decrease2.svg 1.49%

TxSen2012Results.png
Election Results
     Republican hold
     Democratic hold

President Pro Tempore before election


Republican

Elected President Pro Tempore


Republican

The 2012 Texas State Senate elections took place as part of the biennial United States elections. Texas voters elected state senators in all 31 State Senate districts. Typically, State senators serve four-year terms in the Texas State Senate; however, all Senate seats come up for election in the cycle after decennial redistricting. Due to this, senators elected in 2008 served only two-year terms, and half of the senators elected in this election served two-year terms, coming up for re-election again in 2014. A statewide map of Texas's state Senate districts can be obtained from the Texas Legislative Council here, and individual district maps can be obtained from the U.S. Census here.

Contents

Following the 2010 State Senate elections, the Republicans maintained effective control of the Senate with nineteen members to the Democrats' twelve. As the first election after the 2010 United States Census, all senate districts had to be redrawn to account for population changes over the preceding decade. The map passed by the Republican state government was challenged through various avenues for racial gerrymandering, and ultimately a somewhat less biased map was used.

To claim control of the chamber from Republicans, the Democrats needed to gain four seats. In the end, no seats changed hands.

Background

The Republican Party had held the State Senate since the 1996 elections. Most observers, as well as the national parties, viewed Texas as a safe red state, as Republican candidates had swept statewide elections since 1998. State Republicans reached a new zenith after the 2010 elections, when backlash to the presidency of Barack Obama kept the State Senate firmly in their control and led to a record number of victories in the State House of Representatives.

Challenges to Republican-drawn Senate map

After retaining the Governor's mansion and State Senate and flipping the Texas House of Representatives in the 2002 elections, the Republicans held the trifecta for the first time in state history and kept it for the rest of the decade (see also: Political party strength in Texas). As such, after the 2010 census, they had sole control over redistricting the state's U.S. House delegation and both state legislative chambers for the 2012 elections. The 10th Senate District, the most-altered in the body, belonged to Wendy Davis (D-Fort Worth), whose seat was drawn to add more Republican voters from greater Tarrant County while placing voters from Democratic areas out of the district. However, the proposed Senate map for 2012 was challenged under Section 5 of the Voting Rights Act and in U.S. District Court for racial gerrymandering. The United States District Court for the Western District of Texas ruled with the plaintiffs and proposed its own example map, undoing the racial gerrymander in Senate District 10, and ordered the legislature to draw a new map based on its own. Ultimately, this election used boundaries made with input from both the Court and Republican legislators. [2]

Summary of results

Summary of the November 6, 2012 Texas Senate election results
Texas State Senate 2012.svg
PartyCandidatesVotesSeats
No. %BeforeUpWonAfter+/–
Republican 274,275,67661.65%19191919Steady2.svg
Democratic 182,272,08532.76%12121212Steady2.svg
Libertarian 12355,2495.12%0000Steady2.svg
Green 231,8400.46%0000Steady2.svg
Write-in 19660.00%0000Steady2.svg
Total6,987,503100.00%31151531Steady2.svg
Source: [3]
Popular vote
Republican
61.65%
Democratic
32.76%
Libertarian
5.12%
Green
0.46%
Write-in
0.00%
Senate seats won
Republican
61.29%
Democratic
38.71%
DistrictDemocraticRepublicanOthersTotalResult
Votes%Votes%Votes%Votes%
District 1 84,26228.63%210,09171.37%--294,353100.00%Republican hold
District 2 --172,451100.00%--172,451100.00%Republican hold
District 3 --226,978100.00%--226,978100.00%Republican hold
District 4 --216,07686.25%34,44513.75%250,521100.00%Republican hold
District 5 --182,55477.14%54,10722.86%236,661100.00%Republican hold
District 6 93,28970.95%38,20129.05%--131,490100.00%Democratic hold
District 7 90,79331.60%196,52668.40%--287,319100.00%Republican hold
District 8 99,10134.60%178,23862.29%8,8993.11%286,147100.00%Republican hold
District 9 89,25538.21%136,28858.35%8,0343.44%233,577100.00%Republican hold
District 10 147,10351.12%140,65648.88%--287,759100.00%Democratic hold
District 11 93,22733.98%181,10666.02%--274,333100.00%Republican hold
District 12 --203,98883.41%40,57016.59%244,558100.00%Republican hold
District 13 181,866100.00%----181,866100.00%Democratic hold
District 14 212,52780.29%--52,18719.71%264,714100.00%Democratic hold
District 15 135,82262.34%82,03837.66%--217,860100.00%Democratic hold
District 16 --181,746100.00%--181,746100.00%Republican hold
District 17 --185,42977.68%53,27822.32%238,707100.00%Republican hold
District 18 --211,230100.00%--211,230100.00%Republican hold
District 19 122,21459.40%83,52240.60%--205,736100.00%Democratic hold
District 20 112,62961.53%70,40938.47%--183,038100.00%Democratic hold
District 21 129,89467.63%56,03229.17%6,1473.20%192,073100.00%Democratic hold
District 22 --188,54485.57%31,78614.43%220,330100.00%Republican hold
District 23 187,40781.90%41,42918.10%--228,836100.00%Democratic hold
District 24 --209,319100.00%--209,319100.00%Republican hold
District 25 121,90634.42%232,26165.58%--354,167100.00%Republican hold
District 26 141,04080.33%--34,04319.67%175,583100.00%Democratic hold
District 27 113,542100.00%----113,542100.00%Democratic hold
District 28 --183,61986.39%28,93213.61%212,551100.00%Republican hold
District 29 116,20868.60%53,19031.40%--169,398100.00%Democratic hold
District 30 --217,87786.12%35,12713.88%253,004100.00%Republican hold
District 31 --195,878100.00%--195,878100.00%Republican hold
Total2,272,08532.76%4,275,67661.65%387,5555.59%6,935,316100.00%Source: [3]

Related Research Articles

Gerrymandering Manipulation of electoral district borders to favor certain outcomes of an election

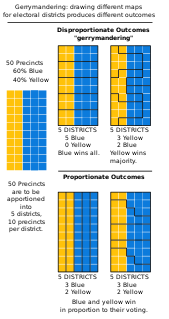
In representative democracies, gerrymandering is the political manipulation of electoral district boundaries with the intent of creating undue advantage for a party, group, or socio-economic class within the constituency. The manipulation may consist of "cracking" or "packing".

Florida Legislature Legislative branch of the state government of Florida

The Florida Legislature is the legislature of the U.S. State of Florida. It is organized as a bicameral body composed of an upper chamber, the Senate, and a lower chamber, the House of Representatives. Article III, Section 1 of the Florida Constitution, adopted in 1968, defines the role of the legislature and how it is to be constituted. The legislature is composed of 160 state legislators. The primary purpose of the legislature is to enact new laws and amend or repeal existing laws. It meets in the Florida State Capitol building in Tallahassee.

North Carolinas congressional districts U.S. House districts in the state of North Carolina

North Carolina is currently divided into 13 congressional districts, each represented by a member of the United States House of Representatives. After the 2000 Census, the number of North Carolina's seats was increased from 12 to 13 due to the state's increase in population.

Politics of Texas Politics of a U.S. state

For about a hundred years, from after Reconstruction until the 1990s, the Democratic Party dominated Texas politics.

2003 Texas redistricting Controversial redistricting of Texass districts for the U.S. House of Representatives

The 2003 Texas redistricting refers to a controversial mid-decade state plan that defined new Congressional districts. In the 2004 elections, this redistricting supported the Republicans taking a majority of Texas's House seats for the first time since Reconstruction. Opponents challenged the plan in three suits, combined when the case went to the United States Supreme Court in League of United Latin American Citizens v. Perry (2006).

Alabamas congressional districts

Alabama is currently divided into seven congressional districts, each represented by a member of the United States House of Representatives. After the 2010 Census, the number of Alabama's seats remained unchanged.

Ohios congressional districts Congressional districts in the U.S. state of Ohio

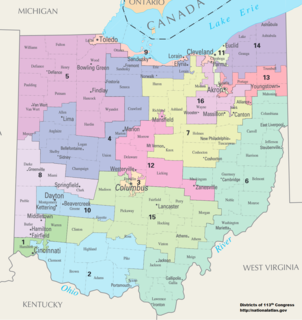
Ohio is divided into 16 congressional districts, each represented by a member of the United States House of Representatives. After the 2010 Census, Ohio lost two House seats due to slow population growth compared to the national average, and a new map was signed into law on September 26, 2011. This map was ruled unconstitutional as partisan gerrymandering, and state Republicans were told to redraw the map before June 14, 2019. However, on October 7, 2019, the U.S. Supreme Court dismissed the challenge to the map, allowing it to stay in effect for the 2020 election.

Virginias congressional districts U.S. House districts in the state of Virginia

Virginia is currently divided into 11 congressional districts, each represented by a member of the United States House of Representatives. The districts were redrawn most recently in 2016 by court order.

Redistricting in Pennsylvania Overview about redistricting in Pennsylvania

Redistricting in Pennsylvania refers to the decennial process of redrawing state and federal congressional districts in Pennsylvania.

Gerrymandering in the United States Setting electoral district boundaries to favor specific political interests in legislative bodies

Gerrymandering in the United States has been used to increase the power of a political party. Gerrymandering is the practice of setting boundaries of electoral districts to favor specific political interests within legislative bodies, often resulting in districts with convoluted, winding boundaries rather than compact areas. The term "gerrymandering" was coined after a review of Massachusetts's redistricting maps of 1812 set by Governor Elbridge Gerry noted that one of the districts looked like a salamander.

Redistricting in California

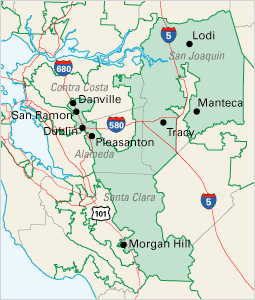
Redistricting in California has historically been highly controversial. Critics have accused legislators of attempting to protect themselves from competition by gerrymandering districts. Conflicts between the governor and the legislature during redistricting often have only been resolved by the courts.

2020 United States redistricting cycle

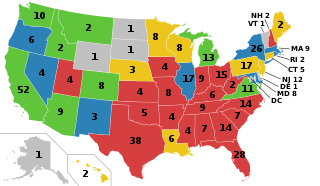
The 2020 United States redistricting cycle is in progress following the completion of the 2020 United States census. In all fifty states, various bodies will re-draw state legislative districts. States that are apportioned more than one seat in the United States House of Representatives will also draw new districts for that legislative body.

Gill v. Whitford, 585 U.S. ___ (2018), was a United States Supreme Court case involving the constitutionality of partisan gerrymandering. Other forms of gerrymandering based on racial or ethnic grounds have been deemed unconstitutional, and while the Supreme Court has identified that extreme partisan gerrymandering can also be unconstitutional, the Court has not agreed on how this can be defined, leaving the question to lower courts to decide.

Redistricting in Virginia Overview of redistricting in Virginia

Redistricting in Virginia has been a controversial topic due to allegations of gerrymandering. In the 2017 Virginia General Assembly, all of the redistricting reform bills were killed.

Redistricting in North Carolina

Redistricting in North Carolina has been a controversial topic due to allegations and admissions of gerrymandering.

2020 Texas State Senate election

The 2020 Texas State Senate elections took place as part of the biennial United States elections. Texas voters elected state senators in 16 of the 31 state senate districts. State senators serve four-year terms in the Texas State Senate. Those elected in 2020 will only be elected for two years, however, as part of the 2-4-4 term system. A statewide map of Texas's state Senate districts can be obtained from the Texas Legislative Council. and individual district maps can be obtained from the U.S. Census.

<i>League of Women Voters of Pennsylvania v. Commonwealth of Pennsylvania</i> 2018 Pennsylvania Supreme Court case regarding gerrymandering

League of Women Voters of Pennsylvania et al. v. Commonwealth of Pennsylvania et al.—abbreviated League of Women Voters v. Commonwealth—was a decision of the Pennsylvania Supreme Court on gerrymandering, concerning the power of the Pennsylvania General Assembly to draw maps based on partisan advantage. The Court ruled that the maps adopted by the Republican controlled legislature in 2011 was an unconstitutional partisan gerrymander under the Constitution of Pennsylvania.

Redistricting in Wisconsin

Redistricing in Wisconsin is the process by which boundaries are redrawn for municipal wards, Wisconsin State Assembly districts, Wisconsin State Senate districts, and Wisconsin's congressional districts. Redistricting occurs—as in other U.S. states—once every decade, usually in the year after the decennial United States Census. According to the Wisconsin Constitution, redistricting in Wisconsin follows the regular legislative process, it must be passed by both houses of the Wisconsin Legislature and signed by the Governor of Wisconsin—unless the Legislature has sufficient votes to override a gubernatorial veto. Due to legislative gridlock, however, it has become common for Wisconsin redistricting to be conducted by courts. The 1982, 1992, and 2002 legislative maps were each created by panels of United States federal judges.

2016 Texas State Senate election

The 2016 Texas State Senate elections took place as part of the biennial United States elections. Texas voters elected state senators in 16 of the 31 state senate districts. State senators serve four-year terms in the Texas State Senate. A statewide map of Texas's state Senate districts can be obtained from the Texas Legislative Council here, and individual district maps can be obtained from the U.S. Census here.

2014 Texas State Senate election

The 2014 Texas State Senate elections took place as part of the biennial United States elections. Texas voters elected state senators in 15 of the 31 state senate districts. State senators serve four-year terms in the Texas State Senate. A statewide map of Texas's state Senate districts can be obtained from the Texas Legislative Council here, and individual district maps can be obtained from the U.S. Census here.

References

  1. 1 2 3 "Race Summary Report - 2010 General Election". Texas Secretary of State. Archived from the original on 2021-04-27. Retrieved 2021-06-04.
  2. Ramsey, Ross; Murphy, Ryan (2011-11-17). "Federal Judges Propose Map for Texas Legislative Districts". The Texas Tribune. Archived from the original on 2021-02-27. Retrieved 2021-06-10.
  3. 1 2 "Race Summary Report - 2012 General Election". Texas Secretary of State. Archived from the original on 2021-04-25. Retrieved 2021-06-04.