
The energy policy of the United States is determined by federal, state, and local entities. It addresses issues of energy production, distribution, consumption, and modes of use, such as building codes, mileage standards, and commuting policies. Energy policy may be addressed via legislation, regulation, court decisions, public participation, and other techniques.

In 2022, 79.6% of Taiwan's electricity generation came from fossil fuels, 9.1% from nuclear, 8.6% from renewables, and 1.2% from hydro. Taiwan relies on imports for almost 98% of its energy, which leaves the island's energy supply vulnerable to external disruption. In order to reduce this dependence, the Ministry of Economic Affairs' Bureau of Energy has been actively promoting energy research at several universities since the 1990s.

Energy in the United Kingdom came mostly from fossil fuels in 2021. Total energy consumption in the United Kingdom was 142.0 million tonnes of oil equivalent in 2019. In 2014, the UK had an energy consumption per capita of 2.78 tonnes of oil equivalent compared to a world average of 1.92 tonnes of oil equivalent. Demand for electricity in 2023 was 29.6 GW on average, supplied through 235 TWh of UK-based generation and 24 TWh of energy imports.
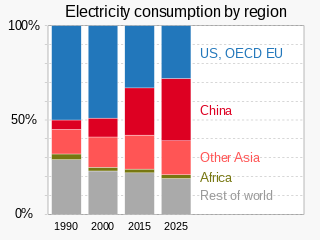
Electric energy consumption is energy consumption in the form of electrical energy. About a fifth of global energy is consumed as electricity: for residential, industrial, commercial, transportation and other purposes. Quickly increasing this share by further electrification is extremely important to limit climate change, because most other energy is consumed by burning fossil fuels thus emitting greenhouse gases which trap heat.

Energy in the United States is obtained from a diverse portfolio of sources, although the majority came from fossil fuels in 2021, as 36% of the nation's energy originated from petroleum, 32% from natural gas, and 11% from coal. Electricity from nuclear power supplied 8% and renewable energy supplied 12%, which includes biomass, wind, hydro, solar and geothermal.

Iran possesses significant energy reserves, holding the position of the world's third-largest in proved oil reserves and the second-largest in natural gas reserves as of 2021. At the conclusion of the same year, Iran's share comprised 24% of the oil reserves in the Middle East and 12% of the worldwide total.

The United States produced 5.2 billion metric tons of carbon dioxide equivalent greenhouse gas (GHG) emissions in 2020, the second largest in the world after greenhouse gas emissions by China and among the countries with the highest greenhouse gas emissions per person. In 2019 China is estimated to have emitted 27% of world GHG, followed by the United States with 11%, then India with 6.6%. In total the United States has emitted a quarter of world GHG, more than any other country. Annual emissions are over 15 tons per person and, amongst the top eight emitters, is the highest country by greenhouse gas emissions per person.

China is both the world's largest energy consumer and the largest industrial country, and ensuring adequate energy supply to sustain economic growth has been a core concern of the Chinese Government since the founding of the People's Republic of China in 1949. Since the country's industrialization in the 1960s, China is currently the world's largest emitter of greenhouse gases, and coal in China is a major cause of global warming. China is also the world's largest renewable energy producer, and the largest producer of hydroelectricity, solar power and wind power in the world. The energy policy of China is connected to its industrial policy, where the goals of China's industrial production dictate its energy demand managements.

Coal generated about 19.5% of the electricity at utility-scale facilities in the United States in 2022, down from 38.6% in 2014 and 51% in 2001. In 2021, coal supplied 9.5 quadrillion British thermal units (2,800 TWh) of primary energy to electric power plants, which made up 90% of coal's contribution to U.S. energy supply. Utilities buy more than 90% of the coal consumed in the United States. There were over 200 coal powered units across the United States in 2024. Coal plants have been closing since the 2010s due to cheaper and cleaner natural gas and renewables. Due to measures such as scrubbers air pollution from the plants kills far fewer people nowadays, but deaths in 2020 from PM25 have been estimated at 1600. Environmentalists say that political action is needed to close them faster, to also reduce greenhouse gas emissions by the United States and better limit climate change.
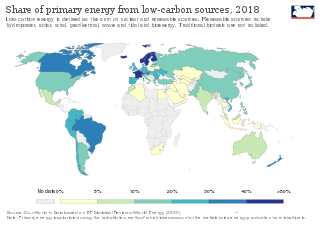
Low-carbon electricity or low-carbon power is electricity produced with substantially lower greenhouse gas emissions over the entire lifecycle than power generation using fossil fuels. The energy transition to low-carbon power is one of the most important actions required to limit climate change.

South Korea is a major energy importer, importing nearly all of its oil needs and ranking as the second-largest importer of liquefied natural gas in the world. Electricity generation in the country mainly comes from conventional thermal power, which accounts for more than two thirds of production, and from nuclear power.

Energy in Australia is the production in Australia of energy and electricity, for consumption or export. Energy policy of Australia describes the politics of Australia as it relates to energy.
Wind power in Indiana was limited to a few small water-pumping windmills on farms until 2008 with construction of Indiana's first utility-scale wind power facility, Goodland with a nameplate capacity of 130 MW. As of March of 2024, Indiana had a total of 2,743 MW of wind power capacity installed, ranking it 12th among U.S. states. Wind power was responsible for 4.8% of in-state electricity production in 2016.
Energy in Algeria encompasses the production, consumption, and import of energy. As of 2009, the primary energy use in Algeria was 462 TWh, with a per capita consumption of 13 TWh. Algeria is a significant producer and exporter of oil and gas and has been a member of the Organization of the Petroleum Exporting Countries (OPEC) since 1969. It also participates in the OPEC+ agreement, collaborating with non-OPEC oil-producing nations. Historically, the country has relied heavily on fossil fuels, which are heavily subsidized and constitute the majority of its energy consumption. In response to global energy trends, Algeria updated its Renewable Energy and Energy Efficiency Development Plan in 2015, aiming for significant advancements by 2030. This plan promotes the deployment of large-scale renewable technologies, such as solar photovoltaic systems and onshore wind installations, supported by various incentive measures.

Energy in Sweden is characterized by relatively high per capita production and consumption, and a reliance on imports for fossil fuel supplies.

Primary energy consumption in Spain in 2020 was mainly composed of fossil sources. The largest sources are petroleum (42.3%), natural gas (19.8%) and coal (11.6%). The remaining 26.3% is accounted for by nuclear energy (12%) and different renewable energy sources (14.3%). Domestic production of primary energy includes nuclear (44.8%), solar, wind and geothermal (22.4%), biomass and waste (21.1%), hydropower (7.2%) and fossil (4.5%).
As of 2023, wind power was the top source of energy in New Mexico, with approximately 4,400 megawatts (MW) of electricity generating capacity responsible for 38% of electricity produced that year. Wind power in New Mexico has the potential to generate more than all of the electricity consumed in the state.


