List of largest recorded music markets

Last updated

World location map (equirectangular 180).svg
Red pog.svg
1
Red pog.svg
2
Red pog.svg
3
Red pog.svg
4
Red pog.svg
5
Red pog.svg
6
Red pog.svg
7
Red pog.svg
8
Red pog.svg
9
Red pog.svg
10
Top 10 largest recorded music markets as of 2023

The world's largest recorded music markets are listed annually by the International Federation of the Phonographic Industry (IFPI). The ranking is based on retail value (rather than units) each market generates respectively per year; retail value generated by each market varies from year to year. As all financial data is given in US dollars, annual rates of change for all countries other than the United States are heavily influenced by exchange rate fluctuations, as well as by actual changes in revenue in local currency terms.

Contents

The information presented in this page only accounts for revenue generated from the recorded music industry (recorded music and auxiliary revenues generated by these recordings), and is not reflective of the entirety of the music industry, including sectors such as publishing, live music, etc.

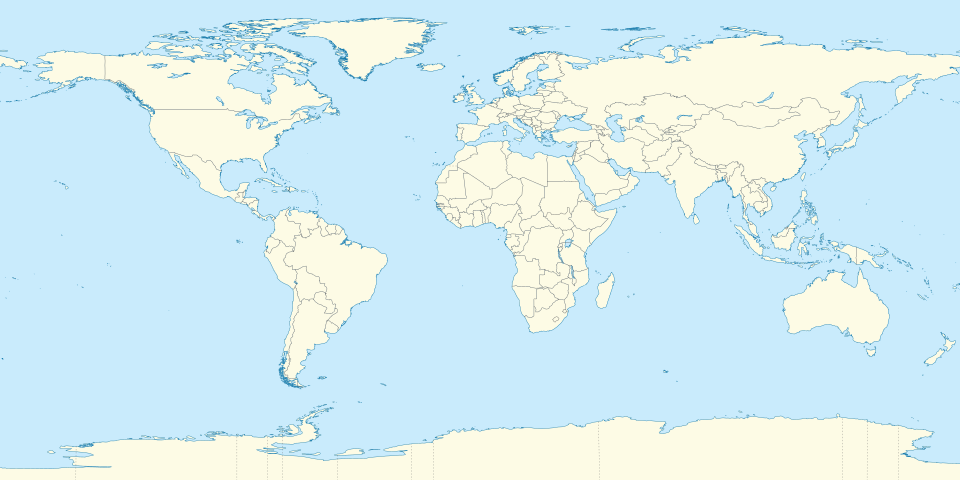
The United States has remained the biggest market for recorded music in IFPI history, except in 2010 when Japan topped the list. The largest Asian music market, Japan has always stayed within the top two. The other largest music markets by region include the United Kingdom in Europe, Australia in Oceania, and Brazil in South America. Meanwhile, United States, Japan, United Kingdom, Germany, France, and Canada have consistently appeared among the top ten music markets throughout IFPI history. Other countries historically having appeared in the top ten include Italy, Netherlands, South Korea, Spain, China, Russia, and Mexico.

IFPI annual data

2023

Music markets, with total retail value, and format share (physical/digital/streaming)
RankMarketRetail value
US$ (millions)
StreamingPhysicalDigitalPerformance rightsSynchronization
1 United States n/an/an/an/an/an/a
2 Japan n/an/an/an/an/an/a
3 United Kingdom n/an/an/an/an/an/a
4 Germany n/an/an/an/an/an/a
5 China n/an/an/an/an/an/a
6 France n/an/an/an/an/an/a
7 South Korea n/an/an/an/an/an/a
8 Canada n/an/an/an/an/an/a
9 Brazil n/an/an/an/an/an/a
10 Australia n/an/an/an/an/an/a
Global total28,60019,3005,1009002,700600

Source: Figures within the table are based on IFPI Global Music Report 2024. [1]

2022

Music markets, with total retail value, and format share (physical/digital/streaming)
RankMarketRetail value
US$ (millions)
StreamingPhysicalDigitalPerformance rightsSynchronization
1United Statesn/a84% [2] 11% [3] n/an/an/a
2Japan2,400.0 [4] n/a66% [5] n/an/an/a
3United Kingdom1,638.0 [6] 86.1% [7] n/an/an/an/a
4Germanyn/an/an/an/an/an/a
5Chinan/an/an/an/an/an/a
6Francen/an/an/an/an/an/a
7South Korean/an/an/an/an/an/a
8Canadan/an/an/an/an/an/a
9Braziln/an/an/an/an/an/a
10Australian/an/an/an/an/an/a
Global total26,20017,5004,6009002,500600

Source: Figures within the table are based on IFPI Global Music Report 2023. [8]

2021

Music markets, with total retail value, and format share (physical/digital/streaming)
RankMarketRetail value
US$ (millions)
StreamingPhysicalDigitalPerformance rightsSynchronization
1United Statesn/an/an/an/an/an/a
2Japann/an/an/an/an/an/a
3United Kingdomn/an/an/an/an/an/a
4Germanyn/an/an/an/an/an/a
5Francen/an/an/an/an/an/a
6Chinan/an/an/an/an/an/a
7South Korean/an/an/an/an/an/a
8Canadan/an/an/an/an/an/a
9Australian/an/an/an/an/an/a
10 Italy n/an/an/an/an/an/a
Global total25,90016,9005,0001,1002,400500

Source: Figures within the table are based on IFPI Global Music Report 2022. [9]

2020

Music markets, with total retail value, and format share (physical/digital/streaming)
RankMarketRetail value
US$ (millions)
StreamingPhysicalDigitalPerformance rightsSynchronization
1United Statesn/an/an/an/an/an/a
2Japann/an/an/an/an/an/a
3United Kingdomn/an/an/an/an/an/a
4Germanyn/an/an/an/an/an/a
5Francen/an/an/an/an/an/a
6South Korean/an/an/an/an/an/a
7Chinan/an/an/an/an/an/a
8Canadan/an/an/an/an/an/a
9Australian/an/an/an/an/an/a
10 Netherlands n/an/an/an/an/an/a
Global total21,60013,4004,2001,2002,300400

Source: Figures within the table are based on IFPI Global Music Report 2021. [10]

2019

Music markets, with total retail value, and format share (physical/digital/streaming)
RankMarketRetail value
US$ (millions)
StreamingPhysicalDigitalPerformance rightsSynchronization
1United Statesn/an/an/an/an/an/a
2Japann/an/an/an/an/an/a
3United Kingdomn/an/an/an/an/an/a
4Germanyn/an/an/an/an/an/a
5Francen/an/an/an/an/an/a
6South Korean/an/an/an/an/an/a
7Chinan/an/an/an/an/an/a
8Canadan/an/an/an/an/an/a
9Australian/an/an/an/an/an/a
10Braziln/an/an/an/an/an/a
Global total20,20011,4004,4001,5002,600500

Source: Figures within the table are based on IFPI Global music report 2020. [11] [12]

2018

Music markets, with total retail value, and format share (physical/digital/streaming)
RankMarketRetail value
US$ (millions)
StreamingPhysicalDigitalPerformance rightsSynchronization
1United Statesn/an/an/an/an/an/a
2Japann/an/an/an/an/an/a
3United Kingdomn/an/an/an/an/an/a
4Germanyn/an/an/an/an/an/a
5Francen/an/an/an/an/an/a
6South Korean/an/an/an/an/an/a
7Chinan/an/an/an/an/an/a
8Australian/an/an/an/an/an/a
9Canadan/an/an/an/an/an/a
10Braziln/an/an/an/an/an/a
Global total19,1008,9004,7002,3002,700400

Source: Figures within the table are based on IFPI Global music report 2019. [13]

2017

Music markets, with total retail value, and format share (physical/digital)
RankMarketRetail value
US$ (millions)
PhysicalDigitalPerformance rightsSynchronization
1United States5,916.115%75%7%3%
2Japan2,727.572%21%5%1%
3Germany1,323.143%36%20%1%
4United Kingdom1,310.730%50%18%2%
5France925.136%34%27%3%
6South Korea494.437%59%4%0%
7Canada437.221%65%14%1%
8Australia412.919%68%11%2%
9Brazil295.85%60%34%0%
10China292.33%90%7%0%
Global total17,270n/an/an/an/a

Source: Figures within the table are based on IFPI Global music report 2018. [14]

2016

Music markets, with total retail value, and format share (physical/digital)
RankMarketRetail value
US$ (millions)
PhysicalDigitalPerformance rightsSynchronization
1United States5,318.218%70%8%4%
2Japan2,745.973%20%6%1%
3United Kingdom1,251.132%47%19%2%
4Germany1,212.052%32%16%1%
5France849.538%30%29%3%
6Canada367.927%63%9%0%
7Australia357.223%64%11%2%
8South Korea330.135%59%5%0%
9Italy263.741%34%22%3%
10Netherlands243.328%43%29%1%
Global total15,700n/an/an/an/a

Source: Figures within the table are based on IFPI Grobal music report 2017. [15]

2015

Music markets, with total retail value, and format share (physical/digital)
RankMarketRetail value
US$ (millions)
 % ChangePhysicalDigitalPerformance rightsSynchronization
1United States4,997.31.0%23%66%7%4%
2Japan2,446.73.0%75%18%6%1%
3United Kingdom1,354.00.6%35%44%19%2%
4Germany1,309.9–0.3%60%25%14%1%
5France809.1–2.2%42%25%29%4%
6Australia342.86.1%29%57%12%2%
7Canada335.88.3%35%52%11%2%
8South Korea281.312.4%31%62%7%0%
9Italy265.525.1%44%31%22%3%
10Brazil247.0–1.8%25%38%37%0%
Global total14,800n/an/an/an/an/a

Source: Figures within the table are based on IFPI Grobal music report 2016. [16]

2014

Music markets, with total retail value, and format share (physical/digital/streaming)
RankMarketRetail value
US$ (millions)
 % ChangePhysicalDigitalPerformance rightsSynchronization
1United States4,898.32.1%26%71%0%4%
2Japan2,627.9–5.5%78%17%3%1%
3Germany1,404.81.9%70%22%7%1%
4United Kingdom1,334.6–2.8%41%45%12%2%
5France842.8–3.4%57%27%13%3%
6Australia376.1–6.8%32%56%9%2%
7Canada342.5–11.3%38%53%6%2%
8South Korea265.819.2%38%58%3%1%
9Brazil246.52.0%41%37%21%1%
10Italy235.2–4.1%51%33%13%3%
Global total14,966-0.4%46%46%6%2%

Source: Figures within the table are based on IFPI 2014 annual report. [17]

2013

Music markets, with total retail value, and format share (physical/digital/streaming)
RankMarketRetail value
US$ (millions)
 % ChangePhysicalDigitalPerformance rightsSynchronization
1United States4,473.50.8%30%60%6%4%
2Japan3,012.0–16.7%80%16%3%1%
3Germany1,365.11.1%73%21%6%1%
4United Kingdom1,303.52.2%44%44%10%1%
5France956.21.3%64%23%12%2%
6Australia430.8–8.4%37%54%7%2%
7Canada424.1–2.5%41%50%7%2%
8Italy238.88.3%56%27%15%3%
9Brazil227.9–1.7%54%34%12%1%
10South Korea211.39.7%46%51%2%0%
Global total15,029.5-3.9%51%39%7%2%

Source: Figures within the table are based on IFPI 2013 annual report. [18]

2012

Music markets, with total retail value, and format share (physical/digital/streaming)
RankMarketRetail value
US$ (millions)
 % ChangePhysicalDigitalPerformance rightsSynchronization
1United States4,481.8–0.5%34%58%4%4%
2Japan4,422.04%80%17%2%1%
3United Kingdom1,325.8–6.1%49%39%10%2%
4Germany1,297.9–4.6%75%19%5%1%
5France907.6–2.9%64%23%11%2%
6Australia507.46.8%45%47%6%2%
7Canada453.55.8%48%43%7%2%
8Brazil257.28.9%62%27%9%2%
9Italy217.5–1.8%62%27%9%2%
10Netherlands216.3–4.7%58%27%14%1%
Global total16,480.60.2%57%35%6%2%

Source: Figures within the table are based on IFPI 2012 annual report. [19]

2011

Music markets, with total retail value, and format share (physical/digital/streaming)
RankMarketRetail value
US$ (millions)
 % ChangePhysicalDigitalPerformance rightsSynchronization
1United States4,372.9–0.1%42%51%3%4%
2Japan4,087.7–7.0%75%22%2%1%
3Germany1,473.7–0.2%78%15%6%1%
4United Kingdom1,433.7–3.1%58%32%8%2%
5France1,002.2–3.7%71%19%8%2%
6Australia475.25.7%55%38%5%2%
7Canada434.02.6%54%38%4%4%
8Netherlands240.2–12.1%71%14%15%0%
9Italy239.9–6.4%68%20%9%3%
10Brazil262.68.6%74%17%8%1%
Global total16,645.9-3.0%61%31%6%2%

Source: Figures within the table are based on IFPI 2011 annual report. [19]

2010

Music markets, with total units sold in various categories, total retail value, and population of market region
RankMarketSingles
(millions)
Albums
(millions)
DVDs
(millions)
VHS cassettes
(millions)
Total units
(millions)
Retail value
US$ (millions)
Population
(millions)
1Japan44.5114.517.5176.54,096.9126.8
2United States1.5225.88.70.4236.43,635.2310.2
3Germany6.898.78.7114.21,713.682.3
4United Kingdom2.499.83.5105.71,388.162.3
5France1.648.43.353.3999.664.8
6Australia0.024.52.60.027.140821.5
7Canada0.225.92.728.8343.233.7
8Italy0.1160.616.7275.458.1
9Netherlands0.516.7221.3270.216.8
10Brazil0.020.77.328258.7201.1
Global total66.4933.278.10.51,078.216,146.8

Source: Figures within the table are based on IFPI 2010 annual report. [20] Total units figures are derived by addition of figures reported by referenced sources.

2009

Music markets, with total units sold in various categories, total retail value, and population of market region
RankMarketSingles
(millions)
Albums
(millions)
DVDs
(millions)
VHS cassettes
(millions)
Total units
(millions)
Retail value
US$ (millions)
Population
(millions)
1United States1.2292.811.50.63064,562307.2
2Japan43.6125190.01187.64,244.5127.1
3Germany4.7103.38.9116.91,945.882.3
4United Kingdom4.2119.45.0128.61,730.561.1
5France2.8513.457.21,157.564.1
6Australia0.629.440.00234456.222
7Canada30.82.333.1401.633.5
8Netherlands0.717.82.821.3340.616.6
9Italy0.616.60.70.0117.9293.858.1
10 Spain 0.0215.240.0119.2266.846.7
Global total60.91074.992.60.61,22918,606.2

Source: Figures within the table are based on IFPI 2009 annual report. [21] Total units figures are derived by addition of figures reported by referenced sources.

2008

Music markets, with total units sold in various categories, total retail value, and population of market region
RankMarketSingles
(millions)
Albums
(millions)
DVDs
(millions)
VHS cassettes
(millions)
Total units
(millions)
Retail value
US$ (millions)
Population
(millions)
1United States1.2384.712.30.53985,977.4303.8
2Japan48.3165.417.10.04230.85,171.1127.3
3Germany7.5107.17.41222,37082.4
4United Kingdom6.6131.24.5142.32,274.960.9
5France4.753.83.261.71,342.564.1
6Australia1.430.23.90.0435.5555.321
7Canada0.09353.138.253033.2
8Italy0.320.60.60.0721.5742758.1
9 Russia 70.170.1395.2140.7
10Spain0.0719.81.30.0921.26374.345.2
Global totalN/AN/AN/AN/AN/A23,490.0

Source: Figures within the table are based on IFPI 2008 annual report, except where noted below. [22] Total units figures are derived by addition of figures reported by referenced sources.

Notes ^

  • ^ Ireland's population figure is based on the CIA's 2010 estimation due to the missing information on the IFPI 2008 report. [23]
  • ^ Iceland's population figure is based on the CIA's 2010 estimation due to the missing information on the IFPI 2008 report. [24]

2007

Music markets, with total units sold in various categories, total retail value, and population of market region
RankMarketSingles
(millions)
Albums
(millions)
DVDs
(millions)
VHS cassettes
(millions)
Total units
(millions)
Retail value
US$ (millions)
Population
(millions)
1United States3.3511.126.60.95427,985.6303.8
2Japan57.6176.517.10.2251.44,174.5127.3
3United Kingdom11.31395.2155.52,696.460.9
4Germany10.6113.39.11332,142.282.4
5France7.962.64.979.951,47164.1
6Australia2.633.84.50.00140.9564.820.6
7Canada0.0940.83.30.0344.2561.833.2
8Italy0.425.51.10.00127493.358.1
9Russia0.057575418.8140.7
10Netherlands118.8322.838516.6
Global totalN/AN/AN/AN/AN/A25,258.4

Source: Figures within the table are based on IFPI 2007 annual report, except where noted below. [25] Total units figures are derived by addition of figures reported by referenced sources.

Notes ^

  • ^ Croatia's, Venezuela's, Bulgaria's, Iceland's, Uruguay's, Ecuador's and Peru's population figures are based on IFPI 2008 annual report due to the missing information on the IFPI 2007 report. [22]

2006

Music markets, with total units sold in various categories, total retail value, and population of market region
RankMarketSingles
(millions)
Albums
(millions)
DVDs
(millions)
VHS cassettes
(millions)
Total units
(millions)
Retail value
US$ (millions)
Population
(millions)
1United States2.9614.922.20.9640.99,651.4301.1
2Japan63.2197.518.70.2279.64,495.2127.4
3United Kingdom19164.47.3190.73,051.160.8
4Germany15.9114.410.20.08140.52,029.182.4
5France18.375.75.70.00299.71,661.763.7
6Canada0.249.13.953.2667.833.4
7Australia4.638.14.146.8583.620.4
8Italy0.728.81.731.2556.958.1
9Spain0.825.92.40.129.2464.844.4
10Russia0.0672.172.1405141.4
Global totalN/AN/AN/AN/AN/A28,121.0

Source: Figures within the table are based on IFPI 2006 annual report, except where noted below. [26] Total units figures are derived by addition of figures reported by referenced sources.

Notes ^

  • ^ Venezuela's, Central America's population figures are based on the IFPI 2004 report due to not having the information on IFPI 2006 report. [27]
  • ^ Slovakia's population figure is based on the CIA's 2010 estimation due to not having the information on the IFPI 2008 report. [28]
  • ^ Uruguay's, Ecuador's and Peru's population figures are based on IFPI 2008 report due to not having the information on IFPI 2006 report. [22]

2005

Music markets, with total units sold in various categories, total retail value, and population of market region
RankMarketSingles
(millions)
Albums
(millions)
DVDs
(millions)
VHS cassettes
(millions)
Total units
(millions)
Retail value
US$ (millions)
Population
(millions)
1United States5705.427.86744.211,195295.7
2Japan63.3211.820.10.2295.44,883.5127.4
3United Kingdom26.8172.68.3207.73,330.460.4
4Germany17.8114.79.60.7142.82,146.482.4
5France25.496.214.70.09136.391,940.360.7
6Canada0.352.54.20.0556.7708.332.8
7Italy131.61.834.4639.858.4
8Australia7.8423.80.00253.6637.720.1
9Spain1.731.13.20.236.2547.140.4
10Netherlands220.44.60.00127423.116.4
Global total162.01,974.9142.87.52,287.231,595.2

Source: Figures within the table are based on IFPI 2005 annual report, except where noted below. [29] Total units figures are derived by addition of figures reported by referenced sources.

Notes ^

  • ^ Ukraine's, Colombia's, Venezuela's, Central America's population figures are based on IFPI 2004 annual report due to the missing information on the IFPI 2005 report. [27]
  • ^ Slovakia's population figure is based on the CIA's 2010 estimation due to not having the information on the IFPI 2005 report. [28]
  • ^ Paraguay's population figure is based on the CIA's 2010 estimation due to not having the information on the IFPI 2005 report. [30]
  • ^ Uruguay's, Ecuador's population figures are based on IFPI 2008 annual report due to the missing information on the IFPI 2005 report. [22]
  • ^ Egypt's population figure is based on the CIA's 2010 estimation due to not having the information on the IFPI 2005 report. [31]

2004

Music markets, with total units sold in various categories, total retail value, and population of market region
RankMarketSingles
(millions)
Albums
(millions)
DVDs
(millions)
Total units
(millions)
Retail value
US$ (millions)
Population
(millions)
1United States6.676729809.7 [l] 12,153.4297
2Japan81.3201.320.3255.6 [m] 5,167.8127.8
3United Kingdom31.4174.67.7194.1 [m] 3,508.759.4
4Germany23.5146.611.5181.3 [m] 2,14982.5
5France24.3106.49126.6 [m] 1,979.360.4
6Australia9.639.54.547.6 [m] 716.719.9
7Canada0.554.84.860.2 [l] 693.831.7
8Italy1.433.1237.8 [l] 652.557.3
9Spain1.3343.538.4 [m] 572.841.1
10Netherlands2.723.25.329.9 [m] 507.716.2
Global total197.82,114.2197.72,755.733,613.64,948.1

Source: Figures within the table are based on IFPI 2004 annual report, except where noted below. [27] Total units figures are derived by addition of figures reported by referenced sources.

Notes ^

  • ^ Note that the figures in the column of Total units for some markets may be higher than what the combined total from the columns of Singles, CDs, DVD might represent. This is due to the missing sales of Digital Downloads, Cassette Albums and VHS Cassettes which are not included on IFPI 2004 report provided by RIAJ.
  • ^ Note that the figures posted in the column of Total units for some markets may be lower than what the combined total from the columns of Singles, CDs, DVDs might represent. This is because the columns of Singles, CDs, DVDs represent shipped units, whereas the column of Total units represent sold units.

2003

Music markets, with total units sold in various categories, total retail value, and population of market region
RankMarketSingles
(millions)
LPs
(millions)
Cassettes
(millions)
CDs
(millions)
DVDs
(millions)
VHSs
(millions)
Retail value
US$ (millions)
Population
(millions)
1United States12.11.517.274617.51.611,847.9294
2Japan86.51.44205.818.21.14,909.7127.7
3United Kingdom36.420.9233.96.40.63,215.759.3
4France30.91.42.5117.96.90.52,114.760.1
5Germany26.81.115.5146.89.01.92,022.182.5
6Canada0.90.453.14.00.867631.5
7Australia100.050.452.95.10.1673.819.7
8Italy2.80.031.336.21.30.05644.657.4
9Spain3.80.01153.91.50.008595.941.1
10Netherlands3.20.20.0724.64.80.2498.816.1
Global total232.57.3427.22,111.6105.79.432,012.24,882.7

Source: Figures within the table are based on IFPI 2004 annual report, except where noted below. [32] Total units figures are derived by addition of figures reported by referenced sources.

2002

Music markets, with total units sold in various categories, total retail value, and population of market region
RankMarketSingles
(millions)
LPs
(millions)
Cassettes
(millions)
CDs
(millions)
Retail value
US$ (millions)
Population
(millions)
1United States8.41.732.4803.312,325.7285,9
2Japan77.12.24.6228.94,593.3127.2
3United Kingdom52.52.21.9221.62,859.45
4France40.50.55130.41,989.759.4
5Germany39.2121.8178.21,988.082
6Canada0.61.157587.930.7
7Italy3.60.1444.7554.757.5
8Spain2.20.012.461.7542.339.9
9Australia11.90.030.649.2499.919.3
10 Mexico 0.60.022.951.1445.5100.3
Global total265.38.54872,253.430,980.94,771,3

Source: Figures within the table are based on IFPI 2004 annual report, except where noted below. [33] Total units figures are derived by addition of figures reported by referenced sources.

1998

Music markets, with total units sold in various categories, and total retail value
RankMarketSingles
(millions)
Cassettes
(millions)
CDs
(millions)
Retail value
US$ (millions)
1United States13,193.4
2Japan6,521.0
3United Kingdom32.2175.72.855.6
4Germany2.832.5
5France2.134.8
6Brazil1.055.7
7Canada11.2969.3
8Spain680.8
9Australia606.7
10Italy597.7
Global total458.81,3002,40038,700

Source: Figures within the table are based on the IFPI annual report and reported by Billboard. [34]

1997

Music markets, with total units sold in various categories, and total retail value
RankMarketSingles
(millions)
Cassettes
(millions)
CDs
(millions)
Retail value
US$ (millions)
1United States11,906.0
2Japan6,261.7
3Germany2,836.8
4United Kingdom2,729.7
5France2,199.5
6Brazil1,199.1
7Canada977.5
8Australia739.1
9Netherlands600.1
10Spain599.9
Global total30,049.3

Source: Figures within the table are based on the IFPI annual report and reported by Billboard. [35]

1996

Music markets, with total units sold in various categories, and total retail value
RankMarketSingles
(millions)
Cassettes
(millions)
CDs
(millions)
Retail value
US$ (millions)
1United States12,300
2Japan6,800
3Germany3,200
4United Kingdom2,700
5France2,300
6Brazil1,400
7Canada912
8Australia815
9Netherlands660
10Italy637
Global total4611,4002,10039,800

Source: Figures within the table are based on the IFPI annual report and reported by Billboard. [36]

1991

Global total units sold in various categories, and total retail value
MarketSingles
(millions)
LPs
(millions)
Cassettes
(millions)
CDs
(millions)
Retail value
US$ (millions)
Global total3201501,1001,00025,400

Source: Figures within the table are based on the IFPI annual report and reported by Billboard. [37]

Statistics

World location map (equirectangular 180).svg
Red pog.svg
US
Red pog.svg
JP
Red pog.svg
UK
Red pog.svg
DE
Red pog.svg
FR
Red pog.svg
CA
Red pog.svg
AU
Red pog.svg
IT
Red pog.svg
BR
Red pog.svg
NL
Red pog.svg
KR
Red pog.svg
ES
Red pog.svg
CN
Red pog.svg
RU
Red pog.svg
MX
Major music markets in history
List of countries by top 10 appearances
CountryGeographical
region
Top 10 appearances
(number of years)
Latest year
in the top 10
Highest
rank
United StatesUSA & Canada2520231
JapanAsia2520231
United KingdomEurope2520233
GermanyEurope2520233
FranceEurope2520234
CanadaUSA & Canada2520236
AustraliaAustralasia2520236
ItalyEurope1820217
BrazilLatin America1420236
NetherlandsEurope1220208
South KoreaAsia1120236
SpainEurope920098
ChinaAsia720235
RussiaEurope320089
MexicoLatin America1200210

See also

45 record.png  Record productionportal

Related Research Articles

<span class="mw-page-title-main">International Federation of the Phonographic Industry</span> Organisation that represents the interests of the recording industry

The International Federation of the Phonographic Industry (IFPI) is the organisation that represents the interests of the recording industry worldwide. It is a non-profit members' organisation registered in Switzerland and founded in Italy in 1933 by Francesco Braga. It operates a secretariat based in London, with regional offices in Brussels, Hong Kong, Miami, Abu Dhabi, Singapore and Nairobi.

<span class="mw-page-title-main">The Rolling Stones discography</span> Catalogue of published recordings by the Rolling Stones

The English rock group The Rolling Stones have released 31 studio albums, 13 live albums, 28 compilation albums, 3 extended plays, 122 singles, 31 box sets, 51 video albums, 2 video box sets and 77 music videos. Throughout their career, they have sold over 200 million records worldwide, making them one of the best-selling music artists of all time. Billboard ranked them as the 2nd Greatest artist of all time. The Rolling Stones have scored 38 top-10 albums on the Billboard 200 and 8 No. 1 hits on the Billboard Hot 100. According to the Recording Industry Association of America, they have sold 66.5 million albums in the US, making them the 16th best-selling group in history.

<span class="mw-page-title-main">Music industry</span> Companies and individuals that create and sell music

The music industry consists of the individuals and organizations that earn money by writing songs and musical compositions, creating and selling recorded music and sheet music, presenting concerts, as well as the organizations that aid, train, represent and supply music creators. Among the many individuals and organizations that operate in the industry are: the songwriters and composers who write songs and musical compositions; the singers, musicians, conductors, and bandleaders who perform the music; the record labels, music publishers, recording studios, music producers, audio engineers, retail and digital music stores, and performance rights organizations who create and sell recorded music and sheet music; and the booking agents, promoters, music venues, road crew, and audio engineers who help organize and sell concerts.

<span class="mw-page-title-main">Remix album</span> Album consisting mostly of remixes or re-recorded versions of earlier released material

A remix album is an album consisting of remixes or rerecorded versions of an artist's earlier released material. The first act who employed the format was American singer-songwriter Harry Nilsson. As of 2007, the best-selling remix album of all time is Michael Jackson's Blood on the Dance Floor: HIStory in the Mix (1997).

<span class="mw-page-title-main">Recording Industry Association of Japan</span> Japanese industry trade group

The Recording Industry Association of Japan (RIAJ) is an industry trade group composed of Japanese corporations involved in the music industry. It was founded in 1942 as the Japan Phonogram Record Cultural Association, and adopted its current name in 1969.

<span class="mw-page-title-main">Bon Jovi discography</span>

American rock band Bon Jovi has released 15 studio albums, three live albums, five compilation albums, five EPs, 66 singles, 14 video albums, and 71 music videos. Bon Jovi has sold over 130 million records worldwide, making them one of the best-selling bands of all time. As of 2018, the band has sold 21.8 million albums in the US Nielsen SoundScan era. Billboard ranked Bon Jovi as the 45th Greatest Artist of all time, achieving 6 No. 1 albums on the Billboard 200 & 4 No. 1 hits on the Billboard Hot 100. According to Recording Industry Association of America, Bon Jovi has sold 34.5 million albums in the United States.

<span class="mw-page-title-main">Recording Industry of South Africa</span> South African record industry trade association

Recording Industry of South Africa (RiSA) is a trade association representing the interests of major and independent record labels of South Africa. Located in Randburg, RiSA is responsible for running the annual South African Music Awards (SAMAs) and for music recording certification in South Africa. It also runs The Official South African Charts (TOSAC).

The Asociación Venezolana de Intérpretes y Productores de Fonogramas (AVINPRO) is an industry trade group composed of Venezuelan corporations involved in the music industry founded in 1993. It serves as the affiliate member of the International Federation of the Phonographic Industry (IFPI) in the country.

<span class="mw-page-title-main">Ariana Grande discography</span>

The discography of American singer, songwriter, and actress Ariana Grande consists of seven studio albums, two compilation albums, one live album, two extended plays (EPs), fifty-four singles, and fifteen promotional singles. Throughout her career thus far, Grande has sold over 90 million records worldwide, making her one of the best-selling music artists of all time. According to the Recording Industry Association of America (RIAA), she has sold over 100 million units, across albums, singles, and features, and 10 million albums and 86.5 million digital singles units as a lead artist. In the U.S., Grande has moved 22.4 million album units, and garnered over 23.6 billion streams across lead artist credits, according to Luminate. Having amassed over 105 billion consumed streams thus far, Grande is the most streamed female artist ever. She is also the most streamed female artist of the 2010s on Spotify and Apple Music. She has amassed 85 chart entries on the Billboard Hot 100—the third most entries for a female artist—including nine number ones and 22 top-10 hits altogether so far. Grande was named the sixth top female artist of the 2010s decade, and was ranked among Billboard's Greatest of All Time Hot 100 Artists, at number 78. Grande is also one of the most certified female artists in the UK, with nearly 25 million units.

<span class="mw-page-title-main">Vinyl revival</span> Record sales phenomenon in the 21st century

The vinyl revival, also known as the vinyl resurgence, is the renewed interest and increased sales of vinyl records, or gramophone records, that has been taking place in the music industry. Beginning in 2007, vinyl records experienced renewed popularity in the West and in East Asia.

The music industry of East Asia, a region that includes Mainland China, Hong Kong, Macau, Japan, Mongolia, North Korea, South Korea and Taiwan is a rapidly growing economic sector that is home to some of the world's largest music markets.

<span class="mw-page-title-main">Album-equivalent unit</span> Measurement unit in the music industry

The album-equivalent unit, or album equivalent, is a measurement unit in music industry to define the consumption of music that equals the purchase of one album copy. This consumption includes streaming and song downloads in addition to traditional album sales. The album-equivalent unit was introduced in the mid-2010s as an answer to the drop of album sales in the 21st century. Album sales more than halved from 1999 to 2009, declining from a $14.6 to $6.3 billion industry. For instance, the only albums that went platinum in the United States in 2014 were the Frozen soundtrack and Taylor Swift's 1989, whereas several artists' works had in 2013.

The Unión Peruana de Productores Fonográficos (UNIMPRO) is a non-profit organization and industry trade group integrated by multinational and national record companies in Peru composed of various Peruvian corporations involved in the music industry. It was founded in 2001 and it serves as the affiliate member of the International Federation of the Phonographic Industry (IFPI) in the country since 2012 and also serves as the national ISRC agency. It is one of the three collective societies in Perú along with Asociación Peruana de Autores y Compositores (APDAYC) and Sociedad Nacional de Intérpretes y Ejecutantes de la Música (SONIEM).

References

  1. "IFPI Global Music Report 2024" (PDF).
  2. "JAPAN MUSIC MARKET". trade.gov. 2023. Retrieved 18 February 2024.
  3. "JAPAN MUSIC MARKET". trade.gov. 2023. Retrieved 18 February 2024.
  4. "JAPAN MUSIC MARKET". trade.gov. 2023. Retrieved 18 February 2024.
  5. "JAPAN MUSIC MARKET". trade.gov. 2023. Retrieved 18 February 2024.
  6. "UK recorded music revenues rise for an eighth successive year in 2022". British Phonographic Industry (BPI). 9 March 2023. Retrieved 18 February 2024. £1.3 billion pounds equates to around US$1.6 dollars
  7. "The New Music Democracy - BPI" (PDF). BPI. 2023. Retrieved 18 February 2024.
  8. "IFPI Global Music Report 2023" (PDF). p. 10. Archived (PDF) from the original on 25 March 2023. Retrieved 19 April 2023.
  9. "IFPI Global Music Report 2022" (PDF). Archived from the original (PDF) on 23 March 2022.
  10. "IFPI Global Music Report 2021" (PDF). www.ifpi.org. Archived from the original (PDF) on 23 March 2021. Retrieved 11 January 2022.
  11. https://www.ifpi.org/wp-content/uploads/2020/07/Global_Music_Report-the_Industry_in_2019-en.pdf [ bare URL PDF ]
  12. "IFPI Global Music Report 2020: Music Revenues Rise for Fifth Straight Year to $20 Billion". Billboard .
  13. https://www.cudisco.org/pdf/GLOBAL-MUSIC%20REPORT-2019.pdf [ bare URL PDF ]
  14. "RIAJ Yearbook 2018: IFPI Global Music Report 2018 (Page 4)". Recording Industry Association of Japan. Archived from the original on 18 June 2018. Retrieved 18 June 2017.
  15. "RIAJ Yearbook 2017: IFPI Global Music Report 2017 (Page 5)". Recording Industry Association of Japan. Archived from the original on 8 August 2017. Retrieved 21 July 2017.
  16. "RIAJ Yearbook 2016: IFPI Global Music Report 2016 (Page 5)". Recording Industry Association of Japan. Archived from the original on 24 July 2017. Retrieved 21 July 2017.
  17. "RIAJ Yearbook 2015: IFPI 2013, 2014. Global Sales of Recorded Music (Page 24)" (PDF). Recording Industry Association of Japan. Archived (PDF) from the original on 8 December 2015. Retrieved 29 November 2015.
  18. "RIAJ Yearbook 2014: IFPI 2012, 2013 Report: 28. Global Sales of Recorded Music (Page 24)" (PDF). Recording Industry Association of Japan. Archived (PDF) from the original on 8 December 2015. Retrieved 29 November 2015.
  19. 1 2 "RIAJ Yearbook 2013: IFPI 2011, 2012 Report: 29. Global Sales of Recorded Music (Page 24)" (PDF). Recording Industry Association of Japan. Archived (PDF) from the original on 8 December 2015. Retrieved 29 November 2015.
  20. "RIAJ: Yearbook 2012, IFPI 2010 Report: 31. Global Sales of Recorded Music by Country in 2010 (Page 24)" (PDF). Recording Industry Association of Japan. Archived (PDF) from the original on 8 December 2015. Retrieved 29 November 2015.
  21. "RIAJ: Yearbook 2011, IFPI 2009 Report: 33. Global Sales of Recorded Music by Country in 2009 (Page 23)" (PDF). Recording Industry Association of Japan. Archived (PDF) from the original on 8 December 2015. Retrieved 29 November 2015.
  22. 1 2 3 4 "RIAJ: Yearbook 2010, IFPI 2008 Report (Page 24)" (PDF). Recording Industry Association of Japan. Archived (PDF) from the original on 8 December 2015. Retrieved 29 November 2015.
  23. "CIA: The World Factbook: Ireland". Central Intelligence Agency . Retrieved 7 November 2010.
  24. "CIA: The World Factbook: Iceland". Central Intelligence Agency . Retrieved 7 November 2010.
  25. "RIAJ: Yearbook 2009, IFPI 2007 Report (Page 24)" (PDF). Recording Industry Association of Japan. Archived (PDF) from the original on 8 December 2015. Retrieved 29 November 2015.
  26. "RIAJ: Yearbook 2008, IFPI 2006 Report (Page 24)" (PDF). Recording Industry Association of Japan. Archived (PDF) from the original on 8 December 2015. Retrieved 29 November 2015.
  27. 1 2 3 "RIAJ: Yearbook 2006, IFPI 2004 Report (Page 23)" (PDF). Recording Industry Association of Japan. Archived (PDF) from the original on 13 September 2017. Retrieved 29 November 2015.
  28. 1 2 "CIA: The World Factbook: Slovakia". Central Intelligence Agency . Retrieved 7 November 2010.
  29. "RIAJ: Yearbook 2007, IFPI 2005 Report (Page 24)" (PDF). Recording Industry Association of Japan. Archived (PDF) from the original on 13 September 2017. Retrieved 29 November 2015.
  30. "CIA: The World Factbook: Paraguay". Central Intelligence Agency . Retrieved 26 February 2011.
  31. "CIA: The World Factbook: Egypt". Central Intelligence Agency . Retrieved 26 February 2011.
  32. "RIAJ: Yearbook 2005, IFPI 2003 Report (Page 22)" (PDF). Recording Industry Association of Japan . Retrieved 21 June 2021.
  33. "RIAJ: Yearbook 2004, IFPI 2002 Report (Page 23)" (PDF). Recording Industry Association of Japan . Retrieved 21 June 2021.
  34. Legrand, Emmanuel; White, Adam; LeBlanc, Larry; Lannert, John (8 May 1999). "U.S., U.K. shine in '98 IFPI stats". Billboard . Vol. 111, no. 19. pp. 1, 72 via Google Books.
  35. Clark-Meads, Jeff (9 May 1998). "Domestic Push Seen as a Cure for '97's Flat Global Sales". Billboard . Vol. 110, no. 19. pp. 1, 87 via Google Books.
  36. White, Adam (10 May 1997). "IFPI Stats Show Top 10 Markets Were Flat in '96". Billboard . Vol. 109, no. 19. pp. 1, 74 via Google Books.
  37. Clark-Meads, Jeff (24 October 1992). "World Music Sales Up 5.5% in '91, But New Markets Falter, IFPI Says". Billboard . Vol. 104, no. 43. pp. 8, 87 via Google Books.