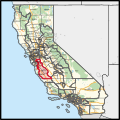
California's 18th congressional district | |
---|---|
Interactive map of district boundaries since 2023 (Used in the 2022 elections) | |
Representative | |
Population (2023) | 743,048 |
Median household income | $96,762 [1] |
Ethnicity |
|
Cook PVI | D+21 [2] |
California's 18th congressional district is a congressional district located in the U.S. state of California. The district is currently represented by Democrat Zoe Lofgren. Since the 2022 election, the district is landlocked and includes all of San Benito County and parts of Santa Clara and Monterey counties, including Salinas, Hollister, Watsonville, Gilroy, Soledad, and downtown and eastern San Jose. [3]
Due to the presence of Silicon Valley, the district had[ when? ] a median household income of $149,375, the second highest of any congressional district in the country. [1] [4] After redistricting, the district picked up agricultural areas of Monterey County, and its median household income dropped substantially, to $90,456.
Following the 2020 census and the subsequent 2020 United States redistricting cycle, California lost a congressional district, leading to significant changes across California's districts. Most of the area previously part of the 18th district was split into the new 16th district and 19th district. The 18th district was moved to cover the Salinas Valley in Monterey County and the downtown and east side of San Jose. With the changes, the 18th became a Latino majority district. [5]
Following the 2010 census and the subsequent 2010 United States redistricting cycle, California's 18th congressional district was redrawn by the California Citizens Redistricting Commission. Cities and CDPs in the district include Palo Alto, Stanford, Los Altos, Woodside, Mountain View, Los Altos Hills, Campbell, Saratoga, Los Gatos, and Scotts Valley; most of Menlo Park and Redwood City; and part of San Jose.
Following the 2000 census and the subsequent 2000 United States redistricting cycle, California's congressional districts were redrawn by the California State Legislature. From 2003 to 2013, the district was located in the San Joaquin Valley. It included Merced County and portions of San Joaquin, Stanislaus, Madera, and Fresno counties. Cities in the district included Modesto, most of Stockton, Ceres, Atwater, Merced, and Los Banos.
Year | Office | Results [6] [7] [8] [9] |
---|---|---|
2008 | President | Obama 71% - 28% |
2012 | President | Obama 74% - 26% |
2016 | President | Clinton 71% - 23% |
2018 | Governor | Newsom 69% - 31% |
Attorney General | Becerra 71% - 29% | |
2020 | President | Biden 71% - 27% |
2022 | Senate (Reg.) | Padilla 68% - 32% |
Governor | Newsom 65% - 35% | |
Lt. Governor | Kounalakis 66% - 34% | |
Secretary of State | Weber 66% - 34% | |
Attorney General | Bonta 66% - 34% | |
Treasurer | Ma 65% - 35% | |
Controller | Cohen 63% - 37% | |
2024 | President | Harris 63% - 34% |
Senate (Reg.) | Schiff 65% - 35% |
# | County | Seat | Population |
---|---|---|---|
53 | Monterey | Salinas | 430,723 |
69 | San Benito | Hollister | 68,175 |
81 | San Mateo | Redwood City | 737,888 |
85 | Santa Clara | San Jose | 1,877,592 |
87 | Santa Cruz | Santa Cruz | 261,547 |
As of the 2020 redistricting, California's 18th congressional district was shifted geographically to cover the Salinas Valley. It encompasses San Benito, the southernmost point of Santa Cruz County, and the interiors of Santa Clara and Monterey Counties.
Santa Cruz County is split between this district and the 19th district. They are partitioned by Pajaro River, Highway 129, W Beach St, Lee Rd, Highway 1, Harkins Slough Rd, Harkins Slough, Old Adobe Rd, Corralitos Creek, Varin Rd, Pioneer Rd, Green Valley Rd, Casserly Rd, Mt Madonna Rd. The 18th district takes in most of the city of Watsonville and the census-designated places Interlaken, Amesti, and Freedom.
Santa Clara County is split between this district, the 19th district, the 16th district, and the 17th district. The 18th, 16th, and 19th are partitioned by Bella Vista Ln, Bodfish Creek, Burchell Rd, Bluebell Dr, Day Rd, Highway G8, W San Martin Ave, Santa Teresa Blvd, Sunnyside Ave, Morgan Hill City Limits, Hale Ave, Tilton Ave, Monterey Rd, Highway 101, Coyote Rd, Anderson Lake, Las Animas Rd, Metcalf Rd, Yerba Buena Creek, Old Yerba Buena Rd, Aborn Rd, Quincy Rd, Norwood Ave, Murillo Ave, Pleasant Acres Dr, Westview Dr, Pleasant Knoll Dr, Guluzzo Dr, Flint Ave, Marten Ave, Coldwater Dr, Ocala Ave, Wonderama Dr, Cunningham Ave, Swift Ave, Highway 101, Story Rd, Monterey Rd, Highway 87, Highway 280, Highway 880. The 18th and 17th are partitioned by Steven's Creek Blvd, Di Salvo Ave, Bellerose Dr, Forest Ave, Wabash Ave, W San Carlos St, Race St, The Alameda, University Ave, Elm St, Highway 82, Newhall St, Morse St, Idaho St, Alameda Ct, Sherwood Ave, Hamline St, Highway 880, Highway 101, McKee Rd, Toyon Ave, Penitencia Creek Rd, Canon Vista Ave, Crothers Rd, Alum Rock Park, Sierra Rd, Felter Rd, Weller Rd. The 18th district takes in the center of the city of San Jose and part of the San Jose district of Alum Rock. It also takes in the cities of Morgan Hill and Gilroy and the census-designated places East Foothills and San Martin.
Monterey County is split between this district and the 19th district. They are partitioned by Union Pacific, Highway G12, Elkhorn Rd, Echo Valley Rd, Maher Rd, Maher Ct, La Encina Dr, Crazy Horse Canyon Rd, San Juan Grade Rd, Highway 101, Espinosa Rd, Castroville Blvd, Highway 156, Highway 1, Tembladero Slough, Highway 183, Cooper Rd, Blanco Rd, Salinas River, Davis Rd, Hitchcock Rd, Highway 68, E Blanco Rd, Nutting St, Abbott St, Highway G17, Limekiln Creek, Likekiln Rd, Rana Creek, Tularcitos Creek, Highway G16, Tassajara Rd, Camp Creek, Lost Valley Creek, Lost Valley Conn, N Coast Rdg, 2 Central Coa, Cone Peak Rd, Nacimiento Fergusson Rd, Los Bueyes Creek, and the Monterey County Southern border. The 18th district takes in the cities of Salinas, Soledad, Greenfield, King City, and Gonzales, and the north side of the census-designated place Prunedale, and the census-designated places Aromas (shared with San Benito County), Pajaro, Las Lomas, Boronda, Chualar, Pine Canyon, San Lucas, San Ardo, Lockwood, and Fort Hunter Liggett
1932 • 1934 • 1936 • 1938 • 1940 • 1942 • 1944 • 1946 • 1948 • 1950 • 1952 • 1954 • 1956 • 1958 • 1960 • 1962 • 1964 • 1966 • 1968 • 1970 • 1972 • 1974 • 1976 • 1978 • 1980 • 1982 • 1984 • 1986 • 1988 • 1990 • 1992 • 1994 • 1996 • 1998 • 2000 • 2002 • 2004 • 2006 • 2008 • 2010 • 2012 • 2014 • 2016 • 2018 • 2020 • 2022 |
Party | Candidate | Votes | % | ||
---|---|---|---|---|---|
Democratic | John H. Burke | 48,179 | 53.3 | ||
Republican | Robert Henderson | 33,817 | 37.4 | ||
Independent | William E. Hinshaw | 8,399 | 9.3 | ||
Total votes | 90,395 | 100.0 | |||
Turnout | |||||
Democratic win (new seat) |
Party | Candidate | Votes | % | |
---|---|---|---|---|
Democratic | Byron N. Scott | 52,377 | 56.3 | |
Republican | William Brayton | 40,179 | 43.2 | |
Communist | Clyde Champion | 507 | 0.5 | |
Total votes | 93,063 | 100.0 | ||
Turnout | ||||
Democratic hold |
Party | Candidate | Votes | % | |
---|---|---|---|---|
Democratic | Byron N. Scott (incumbent) | 61,415 | 59 | |
Republican | James F. Collins | 42,748 | 41 | |
Total votes | 134,163 | 100 | ||
Turnout | ||||
Democratic hold |
Party | Candidate | Votes | % | |||
---|---|---|---|---|---|---|
Republican | Thomas M. Eaton | 52,216 | 48.6 | |||
Democratic | Byron N. Scott (incumbent) | 51,874 | 48.3 | |||
Progressive | Solomon Carr | 3,384 | 3.1 | |||
Total votes | 107,474 | 100.0 | ||||
Turnout | ||||||
Republican gain from Democratic |
Party | Candidate | Votes | % | |
---|---|---|---|---|
Republican | William Ward Johnson (inc.) | 73,932 | 54.4 | |
Democratic | Byron N. Scott | 60,764 | 44.7 | |
Communist | George R. Ashby | 1,355 | 0.9 | |
Total votes | 136,051 | 100.0 | ||
Turnout | ||||
Republican hold |
Party | Candidate | Votes | % | |
---|---|---|---|---|
Republican | William Ward Johnson (inc.) | 53,136 | 56.8 | |
Democratic | Francis H. Gentry | 40,339 | 43.2 | |
Total votes | 93,475 | 100.0 | ||
Turnout | ||||
Republican hold |
Party | Candidate | Votes | % | |||
---|---|---|---|---|---|---|
Democratic | Clyde Doyle | 95,090 | 55.7 | |||
Republican | William Ward Johnson (inc.) | 75,749 | 44.3 | |||
Total votes | 170,839 | 100.0 | ||||
Turnout | ||||||
Democratic gain from Republican |
Party | Candidate | Votes | % | |||
---|---|---|---|---|---|---|
Republican | Willis W. Bradley | 67,363 | 52.8 | |||
Democratic | Clyde Doyle (incumbent) | 60,218 | 47.2 | |||
Total votes | 127,581 | 100.0 | ||||
Turnout | ||||||
Republican gain from Democratic |
Party | Candidate | Votes | % | |||
---|---|---|---|---|---|---|
Democratic | Clyde Doyle | 105,687 | 51.1 | |||
Republican | Willis W. Bradley (incumbent) | 92,721 | 44.9 | |||
Progressive | Stanley Moffatt | 8,232 | 4.0 | |||
Total votes | 206,640 | 100.0 | ||||
Turnout | ||||||
Democratic gain from Republican |
Party | Candidate | Votes | % | |
---|---|---|---|---|
Democratic | Clyde Doyle (incumbent) | 97,177 | 50.5 | |
Republican | Craig Hosmer | 95,308 | 49.5 | |
Total votes | 192,485 | 100.0 | ||
Turnout | ||||
Democratic hold |
Party | Candidate | Votes | % | ||
---|---|---|---|---|---|
Republican | Craig Hosmer | 90,438 | 55.5 | ||
Democratic | Joseph M. Kennick | 72,457 | 44.5 | ||
Total votes | 162,895 | 100.0 | |||
Turnout | |||||
Republican win (new seat) |
Party | Candidate | Votes | % | |
---|---|---|---|---|
Republican | Craig Hosmer (incumbent) | 71,731 | 55 | |
Democratic | Joseph M. Kennick | 58,647 | 45 | |
Total votes | 130,378 | 100 | ||
Turnout | ||||
Republican hold |
Party | Candidate | Votes | % | |
---|---|---|---|---|
Republican | Craig Hosmer (incumbent) | 103,108 | 59.3 | |
Democratic | Raymond C. "Ray" Simpson | 70,911 | 40.7 | |
Total votes | 174,019 | 100.0 | ||
Turnout | ||||
Republican hold |
Party | Candidate | Votes | % | |
---|---|---|---|---|
Republican | Craig Hosmer (incumbent) | 95,682 | 60 | |
Democratic | Harry S. May | 63,684 | 40 | |
Total votes | 159,366 | 100 | ||
Turnout | ||||
Republican hold |
Party | Candidate | Votes | % | |
---|---|---|---|---|
Republican | Craig Hosmer (incumbent) | 129,851 | 70 | |
Democratic | D. Patrick Ahern | 55,735 | 30 | |
Total votes | 185,586 | 100 | ||
Turnout | ||||
Republican hold |
Party | Candidate | Votes | % | |
---|---|---|---|---|
Democratic | Harlan Hagen (incumbent) | 91,684 | 58.9 | |
Republican | G. Ray Arnett | 64,037 | 41.1 | |
Total votes | 155,721 | 100.0 | ||
Turnout | ||||
Democratic hold |
Party | Candidate | Votes | % | |
---|---|---|---|---|
Democratic | Harlan Hagen (incumbent) | 121,304 | 66.7 | |
Republican | James E. Williams Jr. | 60,523 | 33.3 | |
Total votes | 181,827 | 100.0 | ||
Turnout | ||||
Democratic hold |
Party | Candidate | Votes | % | |||
---|---|---|---|---|---|---|
Republican | Bob Mathias | 96,699 | 55.9 | |||
Democratic | Harlan Hagen (incumbent) | 76,346 | 44.1 | |||
Total votes | 173,045 | 100.0 | ||||
Turnout | ||||||
Republican gain from Democratic |
Party | Candidate | Votes | % | |
---|---|---|---|---|
Republican | Bob Mathias (incumbent) | 100,008 | 65.2 | |
Democratic | Harlan Hagen | 51,274 | 33.4 | |
American Independent | Edward Calvin Williams | 2,186 | 1.4 | |
Total votes | 153,468 | 100.0 | ||
Turnout | ||||
Republican hold |
Party | Candidate | Votes | % | |
---|---|---|---|---|
Republican | Bob Mathias (incumbent) | 86,071 | 63.2 | |
Democratic | Milton Spartacus Miller | 48,415 | 33.4 | |
American Independent | Nora E. Hensley | 1,709 | 3.4 | |
Total votes | 136,195 | 100.0 | ||
Turnout | ||||
Republican hold |
Party | Candidate | Votes | % | |
---|---|---|---|---|
Republican | Bob Mathias (incumbent) | 109,993 | 66.5 | |
Democratic | Vincent J. Lavery | 55,484 | 33.5 | |
Total votes | 165,477 | 100.0 | ||
Turnout | ||||
Republican hold |
Party | Candidate | Votes | % | |
---|---|---|---|---|
Republican | William M. Ketchum (inc.) | 66,603 | 52.7 | |
Democratic | George A. Seielstad | 59,931 | 47.3 | |
Total votes | 126,534 | 100.0 | ||
Turnout | ||||
Republican hold |
Party | Candidate | Votes | % | |
---|---|---|---|---|
Republican | William M. Ketchum (inc.) | 101,658 | 64.2 | |
Democratic | Dean Close | 56,683 | 35.8 | |
Total votes | 158,341 | 100.0 | ||
Turnout | ||||
Republican hold |
Party | Candidate | Votes | % | |
---|---|---|---|---|
Republican | Bill Thomas | 85,663 | 59.3 | |
Democratic | Bob Sogge | 58,900 | 40.7 | |
Total votes | 144,563 | 100.0 | ||
Turnout | ||||
Republican hold |
Party | Candidate | Votes | % | |
---|---|---|---|---|
Republican | Bill Thomas (incumbent) | 126,046 | 71 | |
Democratic | Mary Pat Timmermans | 51,415 | 29 | |
Total votes | 177,461 | 100 | ||
Turnout | ||||
Republican hold |
Party | Candidate | Votes | % | ||
---|---|---|---|---|---|
Democratic | Richard H. Lehman | 92,762 | 59.5 | ||
Republican | Adrian C. Fondse | 59,664 | 38.3 | ||
Libertarian | Marshall William Fritz | 3,501 | 2.2 | ||
Total votes | 155,927 | 100.0 | |||
Turnout | |||||
Democratic win (new seat) |
Party | Candidate | Votes | % | |
---|---|---|---|---|
Democratic | Richard H. Lehman (inc.) | 128,186 | 67.3 | |
Republican | Dale L. Ewen | 62,339 | 32.7 | |
Total votes | 190,525 | 100.0 | ||
Turnout | ||||
Democratic hold |
Party | Candidate | Votes | % | |
---|---|---|---|---|
Democratic | Richard H. Lehman (inc.) | 101,480 | 71.3 | |
Republican | David C. Crevelt | 40,907 | 28.7 | |
Total votes | 142,387 | 100.0 | ||
Turnout | ||||
Democratic hold |
Party | Candidate | Votes | % | |
---|---|---|---|---|
Democratic | Richard H. Lehman (inc.) | 125,715 | 69.9 | |
Republican | David A. Linn | 54,034 | 30.1 | |
Total votes | 179,749 | 100.0 | ||
Turnout | ||||
Democratic hold |
Party | Candidate | Votes | % | |
---|---|---|---|---|
Democratic | Richard H. Lehman (inc.) | 98,804 | 100.0 | |
Turnout | ||||
Democratic hold |
Party | Candidate | Votes | % | |
---|---|---|---|---|
Democratic | Gary Condit (incumbent) | 139,704 | 84.7 | |
Libertarian | Kim R. Almstrom | 25,307 | 15.3 | |
Total votes | 165,011 | 100.0 | ||
Turnout | ||||
Democratic hold |
Party | Candidate | Votes | % | |
---|---|---|---|---|
Democratic | Gary Condit (incumbent) | 91,106 | 65.52 | |
Republican | Tom Carter | 44,046 | 31.68 | |
Libertarian | James B. Morzella | 3,902 | 2.81 | |
Total votes | 139,054 | 100.0 | ||
Turnout | ||||
Democratic hold |
Party | Candidate | Votes | % | |
---|---|---|---|---|
Democratic | Gary Condit (incumbent) | 108,827 | 65.8% | |
Republican | Bill Conrad | 52,695 | 31.8% | |
Libertarian | James Morzella | 2,233 | 1.3% | |
Natural Law | Page Riskin | 1,831 | 1.1% | |
Total votes | 165,586 | 100.0% | ||
Turnout | ||||
Democratic hold |
Party | Candidate | Votes | % | |
---|---|---|---|---|
Democratic | Gary Condit (incumbent) | 118,842 | 86.79% | |
Libertarian | Linda M. Degroat | 18,089 | 13.21% | |
Total votes | 136,931 | 100.0% | ||
Turnout | ||||
Democratic hold |
Party | Candidate | Votes | % | |
---|---|---|---|---|
Democratic | Gary Condit (incumbent) | 118,842 | 67.2% | |
Republican | Steve R. Wilson | 56,465 | 31.3% | |
Natural Law | Page Roth Riskin | 2,860 | 1.5% | |
Total votes | 178,167 | 100.0% | ||
Turnout | ||||
Democratic hold |
Party | Candidate | Votes | % | |
---|---|---|---|---|
Democratic | Dennis Cardoza | 56,181 | 51.3 | |
Republican | Dick Monteith | 47,528 | 43.4 | |
American Independent | Kevin H. Cripe | 3,641 | 3.3 | |
Libertarian | Linda De Groat | 2,194 | 2.0 | |
No party | Donna Crowder (write-in) | 49 | 0.0 | |
Turnout | 109,593 | |||
Democratic hold |
Party | Candidate | Votes | % | |
---|---|---|---|---|
Democratic | Dennis Cardoza (incumbent) | 103,732 | 67.5 | |
Republican | Charles F. Pringle Sr. | 49,973 | 32.5 | |
Total votes | 153,705 | 100.0 | ||
Turnout | ||||
Democratic hold |
Party | Candidate | Votes | % | |
---|---|---|---|---|
Democratic | Dennis Cardoza (incumbent) | 71,182 | 65.5 | |
Republican | John A. Kanno | 37,531 | 34.5 | |
Total votes | 108,713 | 100.0 | ||
Turnout | ||||
Democratic hold |
Party | Candidate | Votes | % | |
---|---|---|---|---|
Democratic | Dennis Cardoza (incumbent) | 130,192 | 100.0 | |
Total votes | 130,192 | 100.0 | ||
Turnout | ||||
Democratic hold |
Party | Candidate | Votes | % | |
---|---|---|---|---|
Democratic | Dennis Cardoza (incumbent) | 72,853 | 58.48 | |
Republican | Michael Clare Berryhill Sr. | 51,716 | 41.52 | |
Total votes | 124,569 | 100.00 | ||
Turnout | ||||
Democratic hold |
Party | Candidate | Votes | % | |
---|---|---|---|---|
Democratic | Anna Eshoo | 212,831 | 70.5 | |
Republican | Dave Chapman | 89,103 | 29.5 | |
Total votes | 301,934 | 100.0 | ||
Democratic hold |
Party | Candidate | Votes | % | |
---|---|---|---|---|
Democratic | Anna Eshoo (incumbent) | 133,060 | 68% | |
Republican | Richard B. Fox | 63,326 | 32% | |
Total votes | 196,386 | 100% | ||
Democratic hold |
Party | Candidate | Votes | % | |
---|---|---|---|---|
Democratic | Anna Eshoo (incumbent) | 230,460 | 71% | |
Republican | Richard B. Fox | 93,470 | 29% | |
Total votes | 323,930 | 100% | ||
Democratic hold |
Party | Candidate | Votes | % | |
---|---|---|---|---|
Democratic | Anna Eshoo (incumbent) | 225,142 | 74.5% | |
Republican | Christine Russell | 77,096 | 25.5% | |
Total votes | 302,238 | 100% | ||
Democratic hold |
Party | Candidate | Votes | % | |
---|---|---|---|---|
Democratic | Anna Eshoo (incumbent) | 217,377 | 63.2 | |
Democratic | Rishi Kumar | 126,750 | 36.8 | |
Total votes | 344,127 | 100.0 | ||
Democratic hold |
Party | Candidate | Votes | % | |
---|---|---|---|---|
Democratic | Zoe Lofgren (incumbent) | 99,776 | 65.9 | |
Republican | Peter Hernandez | 51,737 | 34.1 | |
Total votes | 151,513 | 100.0 | ||
Democratic hold |