Elasticity (economics)

Last updated

In economics, elasticity measures the responsiveness of one economic variable to a change in another. [1] If the price elasticity of the demand of something is -2, a 10% increase in price causes the quantity demanded to fall by 20%. Elasticity in economics provides an understanding of changes in the behavior of the buyers and sellers with price changes. There are two types of elasticity for demand and supply, one is inelastic demand and supply and the other one is elastic demand and supply. [2]

Contents

Introduction

Principles of Economics (1890) -- Alfred Marshall Alfred Marshall - Principles of Economics (1890), Prometheus Books.JPG
Principles of Economics (1890) -- Alfred Marshall

The concept of price elasticity was first cited in an informal form in the book Principles of Economics published by the author Alfred Marshall in 1890. [3] Subsequently, a major study of the price elasticity of supply and the price elasticity of demand for US products was undertaken by Joshua Levy and Trevor Pollock in the late 1960s. [4]

Elasticity is an important concept in neoclassical economic theory, and enables in the understanding of various economic concepts, such as the incidence of indirect taxation, marginal concepts relating to the theory of the firm, distribution of wealth, and different types of goods relating to the theory of consumer choice. An understanding of elasticity is also important when discussing welfare distribution, in particular consumer surplus, producer surplus, or government surplus. [5]

Elasticity is present throughout many economic theories, with the concept of elasticity appearing in several main indicators. These include price elasticity of demand, price elasticity of supply, income elasticity of demand, elasticity of substitution between factors of production, cross-price elasticity of demand, and elasticity of intertemporal substitution. [6]

In differential calculus, elasticity is a tool for measuring the responsiveness of one variable to changes in another causative variable. Elasticity can be quantified as the ratio of the percentage change in one variable to the percentage change in another variable when the latter variable has a causal influence on the former and all other conditions remain the same. For example, the factors that determine consumers' choice of goods mentioned in consumer theory include the price of the goods, the consumer's disposable budget for such goods, and the substitutes of the goods. [3]

Within microeconomics, elasticity and slope are closely linked. For price elasticity, the relationship between the two variables on the x-axis and y-axis can be obtained by analyzing the linear slope of the demand or supply curve or the tangent to a point on the curve. When the tangent of the straight line or curve is steeper, the price elasticity (demand or supply) is smaller; when the tangent of the straight line or curve is flatter, the price elasticity (demand or supply) is higher. [7]

Elasticity is a unitless ratio, independent of the type of quantities being varied. An elastic variable (with an absolute elasticity value greater than 1) responds more than proportionally to changes in other variables. A unit elastic variable (with an absolute elasticity value equal to 1) responds proportionally to changes in other variables. In contrast, an inelastic variable (with an absolute elasticity value less than 1) changes less than proportionally in response to changes in other variables. A variable can have different values of its elasticity at different starting points. For example, for the suppliers of the goods, the quantity of a good supplied by producers might be elastic at low prices but inelastic at higher prices, so that a rise from an initially low price might bring on a more-than-proportionate increase in quantity supplied. In contrast, a raise from an initially high price might bring on a less-than-proportionate rise in quantity supplied. [8]

In empirical work, an elasticity is the estimated coefficient in a linear regression equation where both the dependent variable and the independent variable are in natural logs. Elasticity is a popular tool among empiricists because it is independent of units and thus simplifies data analysis. [9]

Definition

Elasticity is the measure of the sensitivity of one variable to another. [10] A highly elastic variable will respond more dramatically to changes in the variable it is dependent on. The x-elasticity of y measures the fractional response of y to a fraction change in x, which can be written as

x-elasticity of y:

In economics, the common elasticities (price elasticity of demand, price elasticity of supply, and cross-price elasticity) all have the same form:

P-elasticity of Q: if continuous, or if discrete.
elasticQ changes more than P
unit elasticQ changes like P
inelasticQ changes less than P

Suppose price rises by 1%. If the elasticity of supply is 0.5, quantity rises by .5%; if it is 1, quantity rises by 1%; if it is 2, quantity rises by 2%.

Special cases:

Perfectly elastic: ; quantity has an infinite response to even a small price change.
Perfectly inelastic: ; quantity does not respond at all to a price change.

Example of calculation

Suppose the demand curve is

Then

The price-elasticity of demand will be:

Maximizing revenue

Seller revenue (or, alternatively, consumer expenditure) is maximized when (unit elasticity) because at that point a change in price is exactly cancelled by the quantity response, leaving the total revenue unchanged. To maximize revenue, a firm must increase price if demand is inelastic: and reduce price if demand is elastic:

As the total revenue is unchanged, we have that

So

The cancellation of the 's is justified by the fact that both time differentials are non-zero and the same.

The elasticity of demand is different at different points of a demand curve, so for most demand functions, including linear demand, a firm following this advice will find some price at which and further price changes would reduce revenue. (This is not true for some theoretical demand functions: has an elasticity of -.5 for any value of , so revenue rises infinitely as price rises to infinity even though quantity approaches zero. See Isoelastic function.)

Types of elasticity

Price elasticity of demand

Formula for price elasticity of demand Formula of Price Elasticity Of Demand 2.png
Formula for price elasticity of demand

Price elasticity of demand measures sensitivity of demand to price. Thus, it measures the percentage change in demand in response to a change in price. [11] More precisely, it gives the percentage change in quantity demanded in response to a one per cent change in price (ceteris paribus, i.e. holding constant all the other determinants of demand, such as income). Expressing this mathematically, price elasticity of demand is calculated by dividing the percentage change in the quantity demanded by the percentage change in the price. [12]

If price elasticity of demand is calculated to be less than 1, the good is said to be inelastic. An inelastic good will respond less than proportionally to a change in price; for example, a price increase of 40% that results in a decrease in demand of 10%.

Goods that are inelastic often have at least one of the following characteristics:

For goods with a high elasticity value, consumers will be more sensitive to price changes. For the average consumer, an increase in price of an inessential good with many available substitutes will often result in that consumer not purchasing the good at all, or purchasing one of the substitutes instead. [13]

Example showing Elasticity of demand.jpg

Example: In the above graphical representation which shows an effect of prices on demand. If the price of the pizza is $20 at which the quantity demanded is 5, if there is an increase in price of pizza to $30 it will lead to decrease in quantity demanded to 3 which shows that small changes in the price of pizza lead to higher changes in quantity demanded.

Price elasticity of supply

Calculating the price elasticity of supply Price elasticity of supply.PNG
Calculating the price elasticity of supply

The price elasticity of supply measures how the amount of a good that a supplier wishes to supply changes in response to a change in price. [14] In a manner analogous to the price elasticity of demand, it captures the extent of horizontal movement along the supply curve relative to the extent of vertical movement. If supply elasticity is zero, the supply of a good supplied is "totally inelastic", and the quantity supplied is fixed. It is calculated by dividing the percentage change in quantity supplied by the percentage change in price. [15]

The supply is said to be inelastic when the change in the prices leads to small changes in the quantity of supply. Whereas the elastic supply means the changes in prices causes higher changes in the quantity supplied.

Income elasticity of demand

Engels curves showing income elasticity of demand (YED) of normal goods (comprising luxury (red) and necessity goods (yellow)), perfectly inelastic (green) and inferior goods (blue) Income elasticity of demand graph.svg
Engels curves showing income elasticity of demand (YED) of normal goods (comprising luxury (red) and necessity goods (yellow)), perfectly inelastic (green) and inferior goods (blue)

Income elasticity of demand is a measure used to show the responsiveness of the quantity demanded of a good or service to a change in the consumer income. Mathematically, this is calculated by dividing the percentage change in the quantity demanded by the percentage change in income. [16] Generally, a higher income will increase quantity demanded as consumers will be willing to spend more.

Cross-price elasticity of demand

Formula for cross-price elasticity Cross-Price Elasticity.jpg
Formula for cross-price elasticity

Cross-price elasticity of demand (or cross elasticity of demand) measures the sensitivity between the quantity demanded in one good when there is a change in the price of another good. [17] As a common elasticity, it follows a similar formula to price elasticity of demand. Thus, to calculate it the percentage change in the quantity of the first good is divided by the percentage change in price in the second good. [17] The related goods that may be used to determine sensitivity can be complements or substitutes. [11] Finding a high-cross price elasticity between the goods may indicate that they are more likely substitutes and may have similar characteristics. [18] If cross-price elasticity is negative, the goods are likely to be complements.

Real-world examples of cross-price elasticity: [19]

Product Under InvestigationComparison ProductPrice Elasticity
US Domestic TunaImported Tuna0.45
US Domestic TunaBread-0.33
US Domestic TunaGround Meat0.3
BeerWine0.2
BeerSoft Drinks0.3
TransitAutomobiles0.85
TransportationRecreation-0.05
FoodRecreation0.15
ClothingFood-0.18

Elasticity of scale

Elasticity of scale or output elasticity measures the percentage change in output induced by a collective percent change in the usages of all inputs. [20] A production function or process is said to exhibit constant returns to scale if a percentage change in inputs results in an equal percentage in outputs (an elasticity equal to 1). It exhibits increasing returns to scale if a percentage change in inputs results in greater percentage change in output (an elasticity greater than 1). The definition of decreasing returns to scale is analogous. [21] [22] [23] [24]

Determinants of elasticity

There are various factors that may affect elasticity, and these factors differ for the types of elasticity.

Factors affecting price elasticity of demand

Availability of substitutes

If a product has various available substitutes that exist in the market, it is likely that it would be elastic. [25] If a product has a competitive product at a cheaper price in the market in which it shares many characteristics with, it is likely that consumers would deviate to the cheaper substitute. Thus, if many substitutions existed in the market, a consumer would have more choices and the elasticity of demand would be higher (elastic). In contrast, if there were few substitutions that existed in the market, consumers will have fewer choices and little to no available substitutes which means elasticity of demand would be lower (inelastic). [25]

Product is necessity or luxury

If a product is a necessity to the survival or daily life of a consumer, it is likely to be inelastic. [26] This is due to the fact that if a product is so intrinsically important to the daily life of a consumer, a change in price is not likely to affect its demand. [1]

Time elapsed since price changed

If the price of a product is increasing and it has little available substitutes, it is likely that the consumer will still continue to pay this higher price. [1] The fact that the consumer needs the good in the short-run, means that he is likely to continue this action regardless in the long-run. This shows inelasticity of demand, because even if there is a huge increase of a product's price, there is no reduction of demand. However, if the consumer could not afford the new price of the product, they would likely have to learn to live without it, making the price elastic in the long-run. [25]

Percentage Income spent on the good

When the consumer spends a considerable portion of their income on goods, it shows elastic demand. This indicates that a change in the price of the goods will have a low impact on the consumer's marginal consumption propensity. If the income spent by the consumer on the goods is in a small proportion of their total income which means the price elasticity of demand is low in such case. [27]

Alternatively, we may also determine the factors affecting demand elasticity by considering three "Intuitive factors. Firstly, we may consider that there is different nature of elasticity when weighting a "brand" of a product or a "category" of a product, a particular brand of product is subject to elasticity as other brand may replace it, while a "category" of a product may not be easily replaced by other category of products. Secondly, like a complementary product, there are some commodities that is inelastic as buyer may have proceeding commitment to purchase it in the future, such as vehicle spare part. Thirdly, consumer mostly pay attention to product which cost a majority of share of their spending, hence any change of price in this product or services would be immediately affect consumer demand, hence this kind of product is elastic, while a product which is not part of consumer majority of purchase is inelastic due to "low involvement to products" effect. [28]

Factors affecting price elasticity of supply

Availability of scarce resources in the market

It is one factor affecting the price elasticity of any industry if the industry uses scarce resources to produce goods. If there is an increase in demand for the goods, the company will not be able to meet the demand because of the availability of resources. Thus, it will increase the prices of the resources, leading to a corresponding increase in the price of the producer goods. [29] For example, Petrol is a natural resource, and thus it is scarce. If the demand for Petrol increases as there is a scarcity of Petrol, it will lead to an increase in petrol prices.

Number of competitors in the industry

It means that if the number of competitors is producing the same goods, there is an easy supply of the goods and thus supply is more inelastic with the increase in competitors. [30]

Others

Like Price Elasticity of Demand, time also affects Price Elasticity of Supply. Though, there are other varying factors that affect this too, such as: capacity, availability of raw materials, flexibility, and the number of competitors in the market. Though, the time horizon is arguably the most influential detriment to price elasticity of supply. [15]

The longer the time horizon, the easier it is for commodity buyers to choose alternative products (substitutes). Further, as the time for suppliers to respond to price changes increases, a given price change will have a more significant impact on supply. However, suppliers can also hire more labour overtime, raise more funds, build more new factories to expand production capacity, and ultimately increase supply. In general, long-term supply is more elastic than short-term supply because producers need some time to adjust their ability to adapt to changes in demand. [31]

Applications

The concept of elasticity has an extensive range of applications in economics. In particular, an understanding of elasticity is fundamental in understanding the response of supply and demand in a market. [12]

Elasticity is also an important concept for enterprises and governments. For enterprises, elasticity is relevant in the calculation of the fluctuation of commodity prices, and its relation to income.

For enterprise, the concept of elasticity also can be applied for pricing strategy. At one hand a businessman has to calculate as if reducing price will necessarily increasing the demand of their products, or will it not be necessary so and resolving a lost for the company [32] At the other hand, enterprise have to consider whether Increasing price and cutting production quantity led to greater revenue. [33] To answer that, it is suggested that if the demand of that product is elastic enough, it is profitable for enterprises to cut price and let the demand to increase over time. [34] But in other hand if the price is inelastic, it is profitable to cut the quantity of production and let the price to rise, because as the product is inelastic enough, so consumer have no alternative to purchase other type of product or services to replace it. Though it is clear that the enterprise should not let their product price to pass by that inelasticity threshold, if so, then the product will be subject to price elasticity and be affected by declining demand over time. [33]

For governments, the concept is important for the implementation of taxation. When a government wants to increase taxes on goods, it can use elasticity to judge whether increasing the tax rate will be beneficial. Often, the demand for goods will be significantly reduced when a government increases taxes on them. Whilst a tax increase on inelastic goods will not impact their demand, it may affect goods that are elastic. Aside from taxation, elasticity can also assist in analysing the need for government intervention.

Additionally, for essential goods, the government must ensure that they are available to most consumers. Through setting price ceilings and floors, the government is intervening by ensuring that these goods are reasonably available.

As stated by British political economist David Ricardo, luxury goods taxes have certain advantages over necessities taxes. They are usually paid from income and, therefore, will not reduce the country's production capital. For instance, when the price of wine products rises due to increased taxes, consumers can give up drinking wine. [35]

Other common uses of elasticity include:

Variants

In some cases the discrete (non-infinitesimal) arc elasticity is used instead. In other cases, such as modified duration in bond trading, a percentage change in output is divided by a unit (not percentage) change in input, yielding a semi-elasticity instead.

See also

Related Research Articles

<span class="mw-page-title-main">Supply and demand</span> Economic model of price determination in a market

In microeconomics, supply and demand is an economic model of price determination in a market. It postulates that, holding all else equal, in a competitive market, the unit price for a particular good or other traded item such as labor or liquid financial assets, will vary until it settles at a point where the quantity demanded will equal the quantity supplied, resulting in an economic equilibrium for price and quantity transacted. The concept of supply and demand forms the theoretical basis of modern economics.

<span class="mw-page-title-main">Deadweight loss</span> Measure of lost economic efficiency

In economics, deadweight loss is the loss of societal economic welfare due to production/consumption of a good at a quantity where marginal benefit does not equal marginal cost – in other words, there are either goods being produced despite the cost of doing so being larger than the benefit, or additional goods are not being produced despite the fact that the benefits of their production would be larger than the costs. The deadweight loss is the net benefit that is missed out on. While losses to one entity often lead to gains for another, deadweight loss represents the loss that is not regained by anyone else. This loss is therefore attributed to both producers and consumers.

<span class="mw-page-title-main">Profit maximization</span> Process to determine the highest profits for a firm

In economics, profit maximization is the short run or long run process by which a firm may determine the price, input and output levels that will lead to the highest possible total profit. In neoclassical economics, which is currently the mainstream approach to microeconomics, the firm is assumed to be a "rational agent" which wants to maximize its total profit, which is the difference between its total revenue and its total cost.

A good's price elasticity of demand is a measure of how sensitive the quantity demanded is to its price. When the price rises, quantity demanded falls for almost any good, but it falls more for some than for others. The price elasticity gives the percentage change in quantity demanded when there is a one percent increase in price, holding everything else constant. If the elasticity is −2, that means a one percent price rise leads to a two percent decline in quantity demanded. Other elasticities measure how the quantity demanded changes with other variables.

In economics, the crosselasticity of demand measures the effect of changes in the price of one good on the quantity demanded of another good. This reflects the fact that the quantity demanded of good is dependent on not only its own price but also the price of other "related" good.

<span class="mw-page-title-main">Substitute good</span> Economics concept of goods considered interchangeable

In microeconomics, substitute goods are two goods that can be used for the same purpose by consumers. That is, a consumer perceives both goods as similar or comparable, so that having more of one good causes the consumer to desire less of the other good. Contrary to complementary goods and independent goods, substitute goods may replace each other in use due to changing economic conditions. An example of substitute goods is Coca-Cola and Pepsi; the interchangeable aspect of these goods is due to the similarity of the purpose they serve, i.e. fulfilling customers' desire for a soft drink. These types of substitutes can be referred to as close substitutes.

<span class="mw-page-title-main">Price elasticity of supply</span> Measure in economics

The price elasticity of supply is a measure used in economics to show the responsiveness, or elasticity, of the quantity supplied of a good or service to a change in its price. Price elasticity of supply, in application, is the percentage change of the quantity supplied resulting from a 1% change in price. Alternatively, PES is the percentage change in the quantity supplied divided by the percentage change in price.

<span class="mw-page-title-main">Law of demand</span> Fundamental principle in microeconomics

In microeconomics, the law of demand is a fundamental principle which states that there is an inverse relationship between price and quantity demanded. In other words, "conditional on all else being equal, as the price of a good increases (↑), quantity demanded will decrease (↓); conversely, as the price of a good decreases (↓), quantity demanded will increase (↑)". Alfred Marshall worded this as: "When we say that a person's demand for anything increases, we mean that he will buy more of it than he would before at the same price, and that he will buy as much of it as before at a higher price". The law of demand, however, only makes a qualitative statement in the sense that it describes the direction of change in the amount of quantity demanded but not the magnitude of change.

<span class="mw-page-title-main">Demand curve</span> Graph of how much of something a consumer would buy at a certain price

A demand curve is a graph depicting the inverse demand function, a relationship between the price of a certain commodity and the quantity of that commodity that is demanded at that price. Demand curves can be used either for the price-quantity relationship for an individual consumer, or for all consumers in a particular market.

<span class="mw-page-title-main">Marginal revenue</span> Additional total revenue generated by increasing product sales by 1 unit

Marginal revenue is a central concept in microeconomics that describes the additional total revenue generated by increasing product sales by 1 unit. Marginal revenue is the increase in revenue from the sale of one additional unit of product, i.e., the revenue from the sale of the last unit of product. It can be positive or negative. Marginal revenue is an important concept in vendor analysis. To derive the value of marginal revenue, it is required to examine the difference between the aggregate benefits a firm received from the quantity of a good and service produced last period and the current period with one extra unit increase in the rate of production. Marginal revenue is a fundamental tool for economic decision making within a firm's setting, together with marginal cost to be considered.

In microeconomics, the Slutsky equation, named after Eugen Slutsky, relates changes in Marshallian (uncompensated) demand to changes in Hicksian (compensated) demand, which is known as such since it compensates to maintain a fixed level of utility.

In economics, the total revenue test is a means for determining whether demand is elastic or inelastic. If an increase in price causes an increase in total revenue, then demand can be said to be inelastic, since the increase in price does not have a large impact on quantity demanded. If an increase in price causes a decrease in total revenue, then demand can be said to be elastic, since the increase in price has a large impact on quantity demanded.

In economics, tax incidence or tax burden is the effect of a particular tax on the distribution of economic welfare. Economists distinguish between the entities who ultimately bear the tax burden and those on whom the tax is initially imposed. The tax burden measures the true economic effect of the tax, measured by the difference between real incomes or utilities before and after imposing the tax, and taking into account how the tax causes prices to change. For example, if a 10% tax is imposed on sellers of butter, but the market price rises 8% as a result, most of the tax burden is on buyers, not sellers. The concept of tax incidence was initially brought to economists' attention by the French Physiocrats, in particular François Quesnay, who argued that the incidence of all taxation falls ultimately on landowners and is at the expense of land rent. Tax incidence is said to "fall" upon the group that ultimately bears the burden of, or ultimately suffers a loss from, the tax. The key concept of tax incidence is that the tax incidence or tax burden does not depend on where the revenue is collected, but on the price elasticity of demand and price elasticity of supply. As a general policy matter, the tax incidence should not violate the principles of a desirable tax system, especially fairness and transparency. The concept of tax incidence is used in political science and sociology to analyze the level of resources extracted from each income social stratum in order to describe how the tax burden is distributed among social classes. That allows one to derive some inferences about the progressive nature of the tax system, according to principles of vertical equity.

In economics, demand is the quantity of a good that consumers are willing and able to purchase at various prices during a given time. In economics "demand" for a commodity is not the same thing as "desire" for it. It refers to both the desire to purchase and the ability to pay for a commodity.
<span class="mw-page-title-main">Supply (economics)</span> Amount of a good that sellers are willing to provide in the market

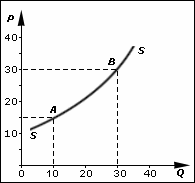
In economics, supply is the amount of a resource that firms, producers, labourers, providers of financial assets, or other economic agents are willing and able to provide to the marketplace or to an individual. Supply can be in produced goods, labour time, raw materials, or any other scarce or valuable object. Supply is often plotted graphically as a supply curve, with the price per unit on the vertical axis and quantity supplied as a function of price on the horizontal axis. This reversal of the usual position of the dependent variable and the independent variable is an unfortunate but standard convention.

In mathematics, the elasticity or point elasticity of a positive differentiable function f of a positive variable at point a is defined as

In economics, the income elasticity of demand (YED) is the responsivenesses of the quantity demanded for a good to a change in consumer income. It is measured as the ratio of the percentage change in quantity demanded to the percentage change in income. For example, if in response to a 10% increase in income, quantity demanded for a good or service were to increase by 20%, the income elasticity of demand would be 20%/10% = 2.0.

Total revenue is the total receipts a seller can obtain from selling goods or services to buyers. It can be written as P × Q, which is the price of the goods multiplied by the quantity of the sold goods.

In mathematical economics, an isoelastic function, sometimes constant elasticity function, is a function that exhibits a constant elasticity, i.e. has a constant elasticity coefficient. The elasticity is the ratio of the percentage change in the dependent variable to the percentage causative change in the independent variable, in the limit as the changes approach zero in magnitude.

<span class="mw-page-title-main">Monopoly price</span> Aspect of monopolistic markets

In microeconomics, a monopoly price is set by a monopoly. A monopoly occurs when a firm lacks any viable competition and is the sole producer of the industry's product. Because a monopoly faces no competition, it has absolute market power and can set a price above the firm's marginal cost.

References

  1. 1 2 3 Hayes, Adam (2022-07-05). "What Is Elasticity in Finance; How Does it Work (with Example)?". Investopedia. Retrieved 2023-03-31.
  2. "Elasticity: What It Means in Economics, Formula, and Examples". Investopedia. Retrieved 2023-04-20.
  3. 1 2 L.F.G., López (Apr–Jun 2019). "The concept of elasticity and strategies for teaching it in introductory courses of economics". Semestre Económico. 22 (51): 149–167. doi: 10.22395/seec.v22n51a7 . hdl: 11407/5594 .
  4. Taylor, Lester D.; Houthakker, H.S. (2010). Consumer demand in the United States : prices, income, and consumption behavior (Originally published by Harvard University Press, 2005) (3rd ed.). Springer. ISBN   978-1-4419-0510-9.
  5. Vekstein, G. E. "The Theory of Elasticity". Physics of Continuous Media. doi:10.1201/9781003062882.
  6. "Elasticity Theory - an overview | ScienceDirect Topics". www.sciencedirect.com. Retrieved 2023-04-20.
  7. Chen, Xudong (October 1, 2017). "Elasticity as Relative Slopes: A Graphical Approach to Linking the Concepts of Elasticity and Slope". The American Economist. 62 (2): 258–267. doi:10.1177/0569434516682713. S2CID   157222255.
  8. "Categories of Elasticity | Macroeconomics". courses.lumenlearning.com. Retrieved 2023-04-20.
  9. "13.5 Interpretation of Regression Coefficients: Elasticity and Logarithmic Transformation - Introductory Business Statistics | OpenStax". openstax.org. Retrieved 2023-04-20.
  10. "The Economic Times: Business News, Personal Finance, Financial News, India Stock Market Investing, Economy News, SENSEX, NIFTY, NSE, BSE Live, IPO News". economictimes.indiatimes.com. Retrieved 2023-04-20.
  11. 1 2 Webster, Thomas, J. (2015). Managerial Economics: Tools for Analysing Business Strategy. Lanham, Maryland: Lexington Books. pp. 55, 70. ISBN   978-1-4985-0794-3.{{cite book}}: CS1 maint: multiple names: authors list (link)
  12. 1 2 Layton, Allan; Robinson, Tim; Tucker, Irvin, B. (2016). Economics for Today. South Melbourne, Victoria: Cengage Learning Australia Pty Ltd. p. 105.{{cite book}}: CS1 maint: multiple names: authors list (link)
  13. "Elasticity | economics | Britannica".
  14. Perloff, J. (2008). p.36.
  15. 1 2 Gans, Joshua; King, Stephen; Mankiw, Gregory, N. (2017). Principles Of Microeconomics. South Melbourne, Victoria: Cengage Learning. pp. 108–116. ISBN   978-0-17-028246-8.{{cite book}}: CS1 maint: multiple names: authors list (link)
  16. Gans, Joshua; King, Stephen; Mankiw, Gregory, N. (2017). Principles of Microeconomics. South Melbourne, Victoria: Cengage Learning. p. 107. ISBN   978-0-17-028246-8.{{cite book}}: CS1 maint: multiple names: authors list (link)
  17. 1 2 Hayes, Adam. "Understanding the Cross Elasticity of Demand". Investopedia. Retrieved 2021-04-25.
  18. Kolay, Sreya; Tyagi, Rajeev, K. (2018). "Product Similarity and Cross-Price Elasticity". Review of Industrial Organization. 52: 85–100. doi:10.1007/s11151-017-9578-8. S2CID   157974644 via Springer Link.{{cite journal}}: CS1 maint: multiple names: authors list (link)
  19. MOTTA, DOBRESCU (March 2019). PRINCIPLES OF ECONOMICS (FOURTH ed.). LIONSHEART STUDIOS. pp. 64–80.
  20. Varian (1992). pp.16–17.
  21. Samuelson, W. & Marks, S. (2003). p.233.
  22. Hanoch, G. (1975). "The Elasticity of Scale and the Shape of Average Costs". American Economic Review . 65 (3): 492–497. JSTOR   1804855.
  23. Panzar, J. C.; Willig, R. D. (1977). "Economies of Scale in Multi-Output Production". Quarterly Journal of Economics . 91 (3): 481–493. doi:10.2307/1885979. JSTOR   1885979.
  24. Zelenyuk, V. (2013). "A scale elasticity measure for directional distance function and its dual: Theory and DEA estimation". European Journal of Operational Research. 228 (3): 592–600. doi:10.1016/j.ejor.2013.01.012.
  25. 1 2 3 Ravelojaona, Paola (2019). "On constant elasticity of substitution – Constant elasticity of transformation Directional Distance Functions". European Journal of Operational Research. 272 (2): 780–791. doi:10.1016/j.ejor.2018.07.020. S2CID   52900747.
  26. Dholakia, R.H., 2016. Demand elasticities for pulses and public policy options, London: Indian Institute of Management, Ahmedabad.
  27. "Elasticity". Corporate Finance Institute. Retrieved 2023-04-20.
  28. Png, Ivan (30 June 2012). "Managerial Economics". (4 ed.). Routledge. p. 41. doi:10.4324/9780203116098. ISBN   978-0-203-11609-8.{{cite book}}: Missing or empty |title= (help)
  29. Rustam, R. (2009). "Study of factors affecting demand and supply of sugar in Indonesia". Journal of Research in National Development. 7 (2). doi:10.4314/jorind.v7i2.50943. ISSN   1596-8308.
  30. Suman, Sanket (2015-10-16). "9 Factors Affecting Price Elasticity of Supply". Economics Discussion. Retrieved 2023-04-20.
  31. Galchynskyi, Leonid (2020-06-24). "Estimation of the price elasticity of petroleum products' consumption in Ukraine". Equilibrium (Toruń ). 15 (2): 315–339. doi: 10.24136/eq.2020.015 .
  32. Mithani, D (2009). Introductory Managerial Economics. Global Media, Mumbai. pp. 108–109.
  33. 1 2 Png, Ivan (30 June 2012). "Managerial Economics". (4 ed.). Routledge. pp. 43–44. doi:10.4324/9780203116098. ISBN   978-0-203-11609-8.{{cite book}}: Missing or empty |title= (help)
  34. Mithani, D (2009). Introductory Managerial Economics. Mumbai: Global Media. pp. 108–109.
  35. Maneschi, Andrea (2004). "The true meaning of David Ricardo's four magic numbers". Journal of International Economics. 62 (2): 433–443. doi:10.1016/S0022-1996(03)00008-4.

Further reading