Related Research Articles
The 1910 United States House of Representatives elections were held for the most part on November 8, 1910, while Maine and Vermont held theirs early in September, in the middle of President William Howard Taft's term. Elections were held for all 391 seats of the United States House of Representatives, representing 46 states, to the 62nd United States Congress.
The 1908 United States House of Representatives elections were held for the most part on November 3, 1908, with Oregon, Maine, and Vermont holding theirs early in either June or September. They coincided with the 1908 United States presidential election, which William Howard Taft won. Elections were held for all 391 seats of the United States House of Representatives, representing 46 states, to serve in the 61st United States Congress.
The 1906 United States House of Representatives elections were held for the most part on November 6, 1906, with Oregon, Maine, and Vermont holding theirs early in either June or September. They occurred in the middle of President Theodore Roosevelt's second term. Elections were held for 386 seats of the United States House of Representatives, representing 45 states, to serve in the 60th United States Congress.

The 1904 United States House of Representatives elections were held for the most part on November 8, 1904, with Oregon, Maine, and Vermont holding theirs early in either June or September. They coincided with the election to a full term of President Theodore Roosevelt. Elections were held for 386 seats of the United States House of Representatives, representing 45 states, to serve in the 59th United States Congress.
The 1902 United States House of Representatives elections were held for the most part on November 4, 1902, with Oregon, Maine, and Vermont holding theirs early in either June or September. They occurred in the middle of President Theodore Roosevelt's first term, about a year after the assassination of President William McKinley in September 1901. Elections were held for 386 seats of the United States House of Representatives, representing 45 states, to serve in the 58th United States Congress.

The 1896 United States House of Representatives elections were held for the most part on November 3, 1896, with Oregon, Maine, and Vermont holding theirs early in either June or September. They coincided with the election of President William McKinley. Elections were held for 357 seats of the United States House of Representatives, representing 45 states, to serve in the 55th United States Congress. The size of the House increased by one seat after Utah gained statehood on January 4, 1896. Special elections were also held throughout the year.
The 1894 United States House of Representatives elections were held from June 4, 1894 to November 6, 1894, with special elections throughout the year. Elections were held to elect representatives from all 356 congressional districts across each of the 44 U.S. states at the time, as well as non-voting delegates from the inhabited U.S. territories. The winners of this election served in the 54th Congress, with seats apportioned among the states based on the 1890 United States census.

The 1886 United States House of Representatives elections were held for the most part on November 2, 1886, with three states holding theirs early between June and September. They occurred in the middle of President Grover Cleveland's first term. Elections were held for 325 seats of the United States House of Representatives, representing 38 states, to serve in the 50th United States Congress. Special elections were also held throughout the year.

The 1884 United States House of Representatives elections were held for the most part on November 4, 1884, with four states holding theirs early between June and October. They coincided with the election of President Grover Cleveland. Elections were held for 325 seats of the United States House of Representatives, representing 38 states, to serve in the 49th United States Congress. Special elections were also held throughout the year.

The 1882 United States House of Representatives elections were held for the most part on November 7, 1882, with five states holding theirs early between June and October. They occurred during President Chester A. Arthur's term. Elections were held for 325 seats of the United States House of Representatives, representing 38 states, to serve in the 48th United States Congress. They were the first elections after reapportionment following the 1880 United States Census, increasing the size of the House. Special elections were also held throughout the year.

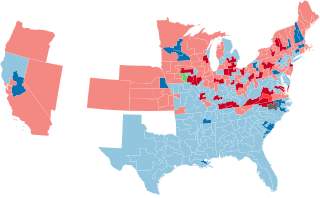
The 1868–69 United States House of Representatives elections were held on various dates in various states between June 1, 1868 and August 2, 1869. Each state set its own date for its elections to the House of Representatives before or after the first session of the 41st United States Congress convened on March 4, 1869. They coincided with the 1868 United States presidential election, which was won by Ulysses S. Grant. Elections were held for all 243 seats, representing 37 states. All of the former Confederate states were represented in Congress for the first time since they seceded from the Union.

The 1844–45 United States House of Representatives elections were held on various dates in various states between July 1, 1844 and November 4, 1845. Each state set its own date for its elections to the House of Representatives. 224 elected members representing 27 states took their seats when the first session of the 29th United States Congress convened on December 1, 1845. The new state of Florida elected its first representative during this election cycle, while one vacancy in New Hampshire's delegation remained unfilled for the duration of the 29th Congress.

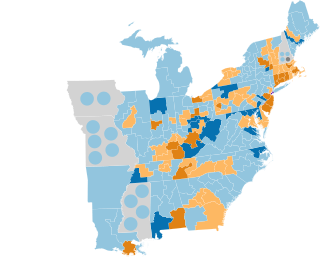
The 1834–35 United States House of Representatives elections were held on various dates in various states between July 7, 1834, and November 5, 1835. Each state set its own date for its elections to the House of Representatives before the first session of the 24th United States Congress convened on December 7, 1835. They were held during President Andrew Jackson's second term. Elections were held for 240 seats that represented 24 states, as well as the at-large-district seat for the pending new state of Michigan.

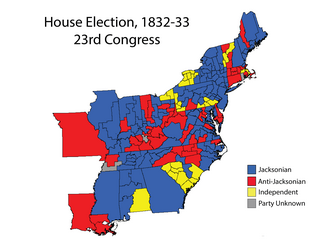
The 1832–33 United States House of Representatives elections were held on various dates in various states between July 2, 1832 and October 7, 1833. Each state set its own date for its elections to the House of Representatives before the first session of the 23rd United States Congress convened on December 2, 1833. They were held concurrently with the 1832 presidential election, in which Democrat Andrew Jackson was re-elected. The congressional reapportionment based on the 1830 United States Census increased the size of the House to 240 seats.

The 1830–31 United States House of Representatives elections were held on various dates in various states between July 5, 1830 and October 3, 1831. Each state set its own date for its elections to the House of Representatives before the first session of the 22nd United States Congress convened on December 5, 1831. Elections were held for all 213 seats, representing 24 states.
This is a list detailing the electoral history of the Libertarian Party in the United States, sorted by office. The list currently consists of candidates who ran for partisan office.
This is a list detailing the electoral history of the Conservative Party in New York, sorted by year. The list currently consists of candidates who ran for partisan office, either those who ran on the Conservative Party label or were endorsed by the party. In the case of endorsements, the vote tallied is that which the candidate received under that label.
There were six special elections to the United States House of Representatives in 1885 during the 48th and 49th Congresses.
References
- ↑ "Our Campaigns - Tucson, AZ Mayor Race - Nov 06, 1979". www.ourcampaigns.com. Retrieved 2021-06-28.
- ↑ "Our Campaigns - Bridgeport Mayor Race - Nov 05, 1929". www.ourcampaigns.com. Retrieved 2021-06-26.
- ↑ "Our Campaigns - Bridgeport Mayor Race - Nov 03, 1931". www.ourcampaigns.com. Retrieved 2021-06-26.
- ↑ "Our Campaigns - Bridgeport Mayor Race - Nov 07, 1933". www.ourcampaigns.com. Retrieved 2021-06-26.
- ↑ "Our Campaigns - Bridgeport Mayor Race - Nov 05, 1935". www.ourcampaigns.com. Retrieved 2021-06-26.
- ↑ "Our Campaigns - Bridgeport Mayor Race - Nov 02, 1937". www.ourcampaigns.com. Retrieved 2021-06-26.
- ↑ "Our Campaigns - Bridgeport Mayor Race - Nov 07, 1939". www.ourcampaigns.com. Retrieved 2021-06-26.
- ↑ "Our Campaigns - Bridgeport Mayor Race - Nov 04, 1941". www.ourcampaigns.com. Retrieved 2021-06-26.
- ↑ "Our Campaigns - Bridgeport Mayor Race - Nov 02, 1943". www.ourcampaigns.com. Retrieved 2021-06-26.
- ↑ "Our Campaigns - Bridgeport Mayor Race - Nov 06, 1945". www.ourcampaigns.com. Retrieved 2021-06-26.
- ↑ "Our Campaigns - Bridgeport Mayor Race - Nov 04, 1947". www.ourcampaigns.com. Retrieved 2021-06-26.
- ↑ "Our Campaigns - Bridgeport Mayor Race - Nov 08, 1949". www.ourcampaigns.com. Retrieved 2021-06-26.
- ↑ "Our Campaigns - Bridgeport Mayor Race - Nov 06, 1951". www.ourcampaigns.com. Retrieved 2021-06-26.
- ↑ "Our Campaigns - Bridgeport Mayor Race - Nov 03, 1953". www.ourcampaigns.com. Retrieved 2021-06-26.
- ↑ "Our Campaigns - Bridgeport Mayor Race - Nov 08, 1955". www.ourcampaigns.com. Retrieved 2021-06-26.
- ↑ "Our Campaigns - Bridgeport Mayor Race - Nov 05, 1957". www.ourcampaigns.com. Retrieved 2021-06-26.
- ↑ "Our Campaigns - Bridgeport Mayor Race - Nov 03, 1959". www.ourcampaigns.com. Retrieved 2021-06-26.
- ↑ "Our Campaigns - Bridgeport Mayor Race - Nov 07, 1961". www.ourcampaigns.com. Retrieved 2021-06-26.
- ↑ "Our Campaigns - Bridgeport Mayor Race - Nov 05, 1963". www.ourcampaigns.com. Retrieved 2021-06-26.
- ↑ "Our Campaigns - Bridgeport Mayor Race - Nov 02, 1971". www.ourcampaigns.com. Retrieved 2021-06-26.
- ↑ "Our Campaigns - Bridgeport Mayor Race - Nov 06, 1973". www.ourcampaigns.com. Retrieved 2021-06-26.
- ↑ "Our Campaigns - Bridgeport Mayor Race - Nov 04, 1975". www.ourcampaigns.com. Retrieved 2021-06-26.
- ↑ "Our Campaigns - Mayor of Hartford Race - Nov 03, 1981". www.ourcampaigns.com. Retrieved 2021-07-05.
- ↑ "Our Campaigns - Mayor of Hartford Race - Nov 07, 1995". www.ourcampaigns.com. Retrieved 2021-07-05.
- ↑ "Our Campaigns - Bridgeport Mayor Race - Nov 04, 1997". www.ourcampaigns.com. Retrieved 2021-06-26.
- ↑ "Our Campaigns - Mayor of Hartford Race - Nov 04, 1997". www.ourcampaigns.com. Retrieved 2021-06-26.
- ↑ "Our Campaigns - Mayor of Hartford Race - Nov 06, 2001". www.ourcampaigns.com. Retrieved 2021-06-26.
- ↑ "Our Campaigns - Mayor of Hartford Race - Nov 04, 2003". www.ourcampaigns.com. Retrieved 2021-06-26.
- ↑ "Our Campaigns - Mayor of Hartford Race - Nov 06, 2007". www.ourcampaigns.com. Retrieved 2021-07-05.
- ↑ "Our Campaigns - Mayor of New Haven Race - Nov 06, 2007". www.ourcampaigns.com. Retrieved 2021-06-26.
- ↑ "Our Campaigns - Mayor of New Haven Race - Nov 03, 2009". www.ourcampaigns.com. Retrieved 2021-06-26.
- ↑ "Our Campaigns - Mayor of New Haven Race - Nov 08, 2011". www.ourcampaigns.com. Retrieved 2021-07-05.
- ↑ "Our Campaigns - Mayor of New Haven Race - Nov 05, 2013". www.ourcampaigns.com. Retrieved 2021-07-05.
- ↑ "Our Campaigns - Mayor of Wilmington Race - Nov 07, 2000". www.ourcampaigns.com. Retrieved 2021-06-28.
- ↑ "Our Campaigns - Gary, IN Mayor Race - Nov 08, 1983". www.ourcampaigns.com. Retrieved 2021-07-02.
- ↑ "Our Campaigns - Gary, IN - Mayor Race - Nov 07, 1995". www.ourcampaigns.com. Retrieved 2021-07-02.
- ↑ "Our Campaigns - Indianapolis Mayor Race - Nov 07, 1995". www.ourcampaigns.com. Retrieved 2021-07-02.
- ↑ "Our Campaigns - Gary, IN Mayor Race - Nov 08, 2011". www.ourcampaigns.com. Retrieved 2021-07-02.
- ↑ "Our Campaigns - Gary, IN Mayor Race - Nov 03, 2015". www.ourcampaigns.com. Retrieved 2021-07-02.
- ↑ "Our Campaigns - Terre Haute Mayor Race - Nov 05, 2019". www.ourcampaigns.com. Retrieved 2021-07-02.
- ↑ "Our Campaigns - Annapolis, MD Mayor Race - Nov 08, 2005". www.ourcampaigns.com. Retrieved 2021-07-14.
- ↑ "Our Campaigns - Boston Mayor Race - Dec 14, 1846". www.ourcampaigns.com. Retrieved 2021-07-05.
- ↑ "Our Campaigns - Boston Mayor Race - Dec 13, 1848". www.ourcampaigns.com. Retrieved 2021-07-05.
- ↑ "Our Campaigns - Boston Mayor Race - Dec 10, 1849". www.ourcampaigns.com. Retrieved 2021-07-05.
- ↑ "Our Campaigns - Boston Mayor - 3rd Ballot Race - Dec 24, 1851". www.ourcampaigns.com. Retrieved 2021-07-05.
- ↑ "Our Campaigns - Boston Mayor Race - Dec 13, 1852". www.ourcampaigns.com. Retrieved 2021-07-05.
- ↑ "Our Campaigns - Boston Mayor Race - Dec 10, 1855". www.ourcampaigns.com. Retrieved 2021-07-05.
- ↑ "Our Campaigns - Woodbridge NJ - Mayor Race - Nov 02, 1999". www.ourcampaigns.com. Retrieved 2021-07-02.
- ↑ "Our Campaigns - Mayor of Atlantic City Race - Nov 08, 2005". www.ourcampaigns.com. Retrieved 2021-07-02.
- ↑ "Our Campaigns - Mayor of Atlantic City - Special Election Race - Nov 04, 2008". www.ourcampaigns.com. Retrieved 2021-07-02.
- ↑ "Our Campaigns - Mayor of Atlantic City Race - Nov 03, 2009". www.ourcampaigns.com. Retrieved 2021-07-02.
- 1 2 3 4 The Mozart Hall political organization was run by Fernando Wood, to promote his political interests, usually against those of Tammany Hall.
- 1 2 3 Political organization of the 1880s and 1890s that served as a coalition of forces within the Democratic Party opposed to Tammany Hall.
- ↑ Short-lived political society of the Central Labor Union.
- ↑ Party created for Randolph Hearst's mayoral campaign.
- ↑ "Our Campaigns - Buffalo NY Mayor Race - Nov 04, 1913". www.ourcampaigns.com. Retrieved 2021-07-02.
- ↑ "Our Campaigns - Schenectady NY Mayor Race - Nov 02, 1915". www.ourcampaigns.com. Retrieved 2021-07-14.
- ↑ "Our Campaigns - Buffalo NY Mayor Race - Nov 05, 1929". www.ourcampaigns.com. Retrieved 2021-07-02.
- ↑ Party run by Polish residents of Erie County and used as a party line for local races.
- ↑ Created by Fiorello LaGuardia to give Newbold Morris a place on the ballot. This was done to draw votes away from the GOP, with whom LaGuardia was involved in a dispute. Disbanded soon after the election.
- ↑ Party created for Vincent Impellitteri's mayoral campaign after he was refused nomination by the Democratic Party.
- ↑ "Our Campaigns - Albany NY Mayor Race - Nov 08, 1977". www.ourcampaigns.com. Retrieved 2021-07-28.
- ↑ Progressive Party that existed from the 1970s to 1990s, focused on supporting union members and small businesses
- ↑ "Our Campaigns - Syracuse NY Mayor Race - Nov 03, 1981". www.ourcampaigns.com. Retrieved 2021-06-26.
- ↑ "Our Campaigns - Albany NY Mayor Race - Nov 04, 1997". www.ourcampaigns.com. Retrieved 2021-07-28.
- ↑ "Our Campaigns - Syracuse NY Mayor Race - Nov 06, 2001". www.ourcampaigns.com. Retrieved 2021-06-26.
- ↑ "Our Campaigns - New Rochelle NY Mayor Race - Nov 04, 2003". www.ourcampaigns.com. Retrieved 2021-06-27.
- ↑ "Our Campaigns - Albany NY Mayor Race - Nov 08, 2005". www.ourcampaigns.com. Retrieved 2021-07-28.
- ↑ "Our Campaigns - Albany NY Mayor Race - Nov 03, 2009". www.ourcampaigns.com. Retrieved 2021-07-28.
- ↑ "Our Campaigns - Syracuse NY Mayor Race - Nov 03, 2009". www.ourcampaigns.com. Retrieved 2021-07-14.
- ↑ "Our Campaigns - New Rochelle NY Mayor Race - Nov 03, 2015". www.ourcampaigns.com. Retrieved 2021-06-27.
- ↑ "Our Campaigns - Cleveland Mayor Race - Nov 02, 1965". www.ourcampaigns.com. Retrieved 2021-07-11.
- ↑ "Our Campaigns - Cleveland Mayor Race - Nov 02, 1971". www.ourcampaigns.com. Retrieved 2021-07-11.
- ↑ "Our Campaigns - Youngstown Mayor Race - Nov 05, 2013". www.ourcampaigns.com. Retrieved 2021-07-11.
- ↑ "Our Campaigns - Youngstown Mayor Race - Nov 07, 2017". www.ourcampaigns.com. Retrieved 2021-07-11.
- ↑ "Our Campaigns - Mayor of Harrisburg Race - Nov 06, 2001". www.ourcampaigns.com. Retrieved 2021-06-27.
- ↑ "Our Campaigns - Mayor of Scranton Race - Nov 03, 2009". www.ourcampaigns.com. Retrieved 2021-06-27.
- ↑ "Our Campaigns - Mayor of Allentown Race - Nov 05, 2013". www.ourcampaigns.com. Retrieved 2021-06-27.
- ↑ "Our Campaigns - Mayor of Harrisburg Race - Nov 05, 2013". www.ourcampaigns.com. Retrieved 2021-06-27.
- ↑ "Our Campaigns - Providence Mayor Race - Nov 06, 1990". www.ourcampaigns.com. Retrieved 2021-07-02.
- ↑ "Our Campaigns - Providence Mayor Race - Nov 08, 1994". www.ourcampaigns.com. Retrieved 2021-07-02.
- ↑ "Our Campaigns - Providence Mayor Race - Nov 03, 1998". www.ourcampaigns.com. Retrieved 2021-07-02.
- ↑ "Our Campaigns - Warwick Mayor Race - Nov 02, 2004". www.ourcampaigns.com. Retrieved 2021-07-02.
- ↑ "Our Campaigns - Pawtucket Mayor Race - Nov 04, 2008". www.ourcampaigns.com. Retrieved 2021-07-02.
- ↑ "Our Campaigns - Providence Mayor Race - Nov 02, 2010". www.ourcampaigns.com. Retrieved 2021-07-02.
- ↑ "Our Campaigns - Warwick Mayor Race - Nov 06, 2012". www.ourcampaigns.com. Retrieved 2021-07-02.
- ↑ "Our Campaigns - Providence Mayor Race - Nov 04, 2014". www.ourcampaigns.com. Retrieved 2021-07-02.
- ↑ "Our Campaigns - Warwick Mayor Race - Nov 04, 2014". www.ourcampaigns.com. Retrieved 2021-07-02.
- ↑ "Our Campaigns - Pawtucket Mayor Race - Nov 08, 2016". www.ourcampaigns.com. Retrieved 2021-07-02.
- ↑ "Our Campaigns - Pawtucket Mayor Race - Nov 06, 2018". www.ourcampaigns.com. Retrieved 2021-07-02.
- ↑ "Our Campaigns - Providence Mayor Race - Nov 06, 2018". www.ourcampaigns.com. Retrieved 2021-07-02.
- ↑ "Our Campaigns - Warwick Mayor Race - Nov 03, 2020". www.ourcampaigns.com. Retrieved 2021-07-02.
- ↑ "Our Campaigns - Charleston SC Mayor Race - Dec 09, 1975". www.ourcampaigns.com. Retrieved 2021-06-26.
- ↑ "Our Campaigns - Charleston SC Mayor Race - Nov 02, 1999". www.ourcampaigns.com. Retrieved 2021-06-26.
- ↑ "Our Campaigns - Alexandria, VA Mayor Race - Jun 13, 1961". www.ourcampaigns.com. Retrieved 2021-07-14.
- ↑ "Our Campaigns - Alexandria, VA Mayor Race - Jun 13, 1967". www.ourcampaigns.com. Retrieved 2021-07-14.
- ↑ "Our Campaigns - Alexandria, VA Mayor - Special Election Race - Feb 20, 1996". www.ourcampaigns.com. Retrieved 2021-07-14.
- ↑ "Our Campaigns - Alexandria, VA Mayor Race - May 02, 2000". www.ourcampaigns.com. Retrieved 2021-07-14.
- ↑ "Our Campaigns - Alexandria, VA Mayor Race - May 06, 2003". www.ourcampaigns.com. Retrieved 2021-07-14.
- ↑ "Our Campaigns - Alexandria, VA Mayor Race - Nov 06, 2012". www.ourcampaigns.com. Retrieved 2021-07-14.