Marion County, Iowa

Last updated

Marion County
Marion County, Iowa Courthouse.jpg
Map of Iowa highlighting Marion County.svg
Location within the U.S. state of Iowa
Iowa in United States.svg
Iowa's location within the U.S.
Coordinates: 41°19′52″N93°06′08″W / 41.331111111111°N 93.102222222222°W / 41.331111111111; -93.102222222222
CountryFlag of the United States.svg United States
StateFlag of Iowa.svg  Iowa
Founded1845
Named for Francis Marion
Seat Knoxville
Largest city Pella
Area
  Total
571 sq mi (1,480 km2)
  Land555 sq mi (1,440 km2)
  Water16 sq mi (40 km2)  2.8%
Population
 (2020)
  Total
33,414
  Estimate 
(2023)
33,770 Increase2.svg
  Density59/sq mi (23/km2)
Time zone UTC−6 (Central)
  Summer (DST) UTC−5 (CDT)
Congressional district 1st
Website www.marioncountyiowa.gov

Marion County is a county in the U.S. state of Iowa. As of the 2020 census, the population was 33,414. [1] The county seat is Knoxville. [2] It is named for Francis Marion, a brigadier general from South Carolina in the American Revolutionary War. [3]

Contents

Geography

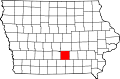
According to the U.S. Census Bureau, the county has a total area of 571 square miles (1,480 km2), of which 555 square miles (1,440 km2) is land and 16 square miles (41 km2) (2.8%) is water. [4]

Major highways

Adjacent counties

Demographics

Historical population
CensusPop.Note
1850 5,482
1860 16,813206.7%
1870 24,43645.3%
1880 25,1112.8%
1890 23,058−8.2%
1900 24,1594.8%
1910 22,995−4.8%
1920 24,9578.5%
1930 25,7273.1%
1940 27,0195.0%
1950 25,930−4.0%
1960 25,886−0.2%
1970 26,3521.8%
1980 29,66912.6%
1990 30,0011.1%
2000 32,0526.8%
2010 33,3093.9%
2020 33,4140.3%
2023 (est.)33,770 [5] 1.1%
U.S. Decennial Census [6]
1790-1960 [7] 1900-1990 [8]
1990-2000 [9] 2010-2018 [10]
Population of Marion County from US census data MarionCountyIowaPop2020.png
Population of Marion County from US census data

2020 census

2022 US Census population pyramid for Marion County from ACS 5-year estimates MarionCountyIA2022PopPyr.png
2022 US Census population pyramid for Marion County from ACS 5-year estimates

The 2020 census recorded a population of 33,414 in the county, with a population density of

2010 census

The 2010 census recorded a population of 33,309 in the county, with a population density of

2000 census

As of the census [12] of 2000, there were 32,052 people, 12,017 households, and 8,532 families residing in the county. The population density was 58 people per square mile (22 people/km2). There were 12,755 housing units at an average density of 23 units per square mile (8.9 units/km2). The racial makeup of the county was 97.46% White, 0.42% Black or African American, 0.19% Native American, 1.03% Asian, 0.04% Pacific Islander, 0.22% from other races, and 0.64% from two or more races. 0.80% of the population were Hispanic or Latino of any race.

There were 12,017 households, out of which 33.00% had children under the age of 18 living with them, 61.20% were married couples living together, 6.90% had a female householder with no husband present, and 29.00% were non-families. 25.60% of all households were made up of individuals, and 11.90% had someone living alone who was 65 years of age or older. The average household size was 2.50 and the average family size was 3.02.

In the county, the population was spread out, with 25.30% under the age of 18, 10.20% from 18 to 24, 26.50% from 25 to 44, 22.10% from 45 to 64, and 15.90% who were 65 years of age or older. The median age was 37 years. For every 100 females there were 98.60 males. For every 100 females age 18 and over, there were 95.80 males.

The median income for a household in the county was $42,401, and the median income for a family was $50,052. Males had a median income of $36,460 versus $25,573 for females. The per capita income for the county was $18,717. About 5.20% of families and 7.60% of the population were below the poverty line, including 8.70% of those under age 18 and 10.80% of those age 65 or over.

Communities

Cities

Unincorporated communities

Townships

Population ranking

Red Rock Lake and Dam in Marion County near Pella. Elk Rock State Park is situated on both sides of the lake to the northwest. County road T15 crosses over the dam. Red Rock Lake and Dam Iowa.jpg
Red Rock Lake and Dam in Marion County near Pella. Elk Rock State Park is situated on both sides of the lake to the northwest. County road T15 crosses over the dam.

The population ranking of the following table is based on the 2020 census of Marion County. [1]

county seat

RankCity/town/etc.Municipal typePopulation (2020 Census)
1 Pella City10,464
2 Knoxville City7,595
3 Pleasantville City1,676
4 Melcher-Dallas City1,195
5 Bussey City387
6 Harvey City236
7 Hamilton City119
8 Swan City76
9 Marysville City44

Politics

United States presidential election results for Marion County, Iowa [13]
Year Republican Democratic Third party(ies)
No.%No.%No.%
2024 13,28967.92%5,92830.30%3491.78%
2020 12,66365.84%6,17832.12%3912.03%
2016 10,96261.53%5,48230.77%1,3727.70%
2012 9,82855.57%7,50742.44%3521.99%
2008 9,25654.34%7,42143.57%3552.08%
2004 9,99059.83%6,57439.37%1320.79%
2000 8,35858.01%5,74139.85%3092.14%
1996 6,10046.74%5,97845.80%9747.46%
1992 6,06244.79%5,53140.87%1,94014.34%
1988 5,91445.65%6,92253.44%1180.91%
1984 7,25953.24%6,31346.30%620.45%
1980 6,66549.30%5,49040.61%1,36310.08%
1976 5,42945.79%6,22652.51%2021.70%
1972 6,58357.09%4,64340.27%3052.65%
1968 5,79152.35%4,61841.75%6535.90%
1964 3,90332.96%7,91166.80%280.24%
1960 7,44461.99%4,54737.87%170.14%
1956 6,83056.13%5,31643.69%220.18%
1952 7,16557.25%5,19641.51%1551.24%
1948 4,31239.67%6,30057.96%2582.37%
1944 4,87442.99%6,36556.14%990.87%
1940 5,76345.19%6,91554.22%750.59%
1936 4,97541.51%6,74556.27%2662.22%
1932 3,69533.49%7,06764.05%2722.47%
1928 6,22559.36%4,11339.22%1491.42%
1924 5,05847.65%2,38322.45%3,17429.90%
1920 5,43556.62%3,86140.22%3033.16%
1916 2,45942.90%3,09453.98%1793.12%
1912 1,19122.66%2,27643.31%1,78834.02%
1908 2,62546.12%2,73948.12%3285.76%
1904 2,98853.05%2,20239.10%4427.85%
1900 2,95048.53%2,95048.53%1792.94%
1896 2,74146.05%3,11952.40%921.55%
1892 2,31943.70%2,54047.86%4488.44%
1888 2,37447.30%2,32246.26%3236.44%
1884 2,35647.27%2,59352.03%350.70%
1880 2,45247.46%1,52029.42%1,19423.11%

See also

References

  1. 1 2 3 "2020 Census State Redistricting Data". census.gov. United states Census Bureau. Retrieved August 12, 2021.
  2. "Find a County". National Association of Counties. Retrieved June 7, 2011.
  3. Gannett, Henry (1905). The Origin of Certain Place Names in the United States. U.S. Government Printing Office. p.  200.
  4. "US Gazetteer files: 2010, 2000, and 1990". United States Census Bureau. February 12, 2011. Retrieved April 23, 2011.
  5. "Annual Estimates of the Resident Population for Counties: April 1, 2020 to July 1, 2023". United States Census Bureau. Retrieved April 2, 2024.
  6. "U.S. Decennial Census". United States Census Bureau. Retrieved July 20, 2014.
  7. "Historical Census Browser". University of Virginia Library. Retrieved July 20, 2014.
  8. "Population of Counties by Decennial Census: 1900 to 1990". United States Census Bureau. Retrieved July 20, 2014.
  9. "Census 2000 PHC-T-4. Ranking Tables for Counties: 1990 and 2000" (PDF). United States Census Bureau. Archived (PDF) from the original on March 27, 2010. Retrieved July 20, 2014.
  10. "State & County QuickFacts". United States Census Bureau. Archived from the original on June 7, 2011. Retrieved July 20, 2014.
  11. "Population & Housing Occupancy Status 2010" (PDF). United States Census Bureau American FactFinder. Archived (PDF) from the original on October 16, 2020. Retrieved August 15, 2022.
  12. "U.S. Census website". United States Census Bureau. Retrieved January 31, 2008.
  13. Leip, David. "Dave Leip's Atlas of U.S. Presidential Elections". uselectionatlas.org. Retrieved April 27, 2018.

41°19′52″N93°06′08″W / 41.33111°N 93.10222°W / 41.33111; -93.10222