Member(Residence) Party Years Cong Electoral history District location District established March 4, 1789 Thomas Tudor Tucker (Charleston ) Anti-Administration March 4, 1789 – 1st 2nd Elected in 1788 .Re-elected in 1790 . 1789–1793 South Carolina congressional districts 1st district, "Charleston"
2nd district, "Beaufort-Orangeburg"
3rd district, "Georgetown-Cheraw"
4th district, "Camden"
5th district, "Ninety-Six"
Alexander Gillon (Charleston ) Anti-Administration March 4, 1793 – 3rd Elected in 1793 . 1793–1797 Vacant October 6, 1794 – Robert Goodloe Harper (Charleston ) Pro-Administration February 9, 1795 – 3rd 4th 5th 6th Elected October 13–14, 1794 to finish Gillon's term and elected the same day to the next term .Re-elected in 1796 .Re-elected in 1798 . Federalist March 4, 1795 – 1797–1803 1796 election results by district William Butler (Mount Willing ) Democratic-Republican March 4, 1801 – 7th Elected in 1800 . 2nd district . Richard Winn (Winnsboro ) Democratic-Republican March 4, 1803 – 8th 9th 10th 11th 12th Redistricted from the 4th district and re-elected in 1803 .Re-elected in 1804 .Re-elected in 1806 .Re-elected in 1808 .Re-elected in 1810 . 1803–1813 David R. Evans (Winnsboro ) Democratic-Republican March 4, 1813 – 13th Elected in 1812 . 1813–1823 William Woodward (Monticello ) Democratic-Republican March 4, 1815 – 14th Elected in 1814 . Starling Tucker (Mountain Shoals ) Democratic-Republican March 4, 1817 – 15th 16th 17th Elected in 1816 .Re-elected in 1818 .Re-elected in 1818 .Re-elected in 1820 . 9th district . George McDuffie (Willington ) Democratic-Republican (Jackson) March 4, 1823 – 18th 19th 20th 21st 22nd 23rd Redistricted from the 6th district and re-elected in 1823 .Re-elected in 1824 .Re-elected in 1826 .Re-elected in 1828 .Re-elected in 1830 .Re-elected in 1833 .Re-elected in 1834 .Governor of South Carolina . 1823–1833 Jacksonian March 4, 1825 – Nullifier March 4, 1831 – 1833–1843 [ data missing ] Vacant 1834 – 23rd Francis W. Pickens (Edgefield ) Nullifier December 8, 1834 – 23rd 24th 25th 26th 27th Elected to finish McDuffie's term .Also elected to the next full term .Re-elected in 1836 .Re-elected in 1838 .Re-elected in 1840 . Democratic March 4, 1839 – Armistead Burt (Willington ) Democratic March 4, 1843 – 28th 29th 30th 31st 32nd Elected in 1843 .Re-elected in 1844 .Re-elected in 1846 .Re-elected in 1848 .Re-elected in 1850 . 1843–1853 [ data missing ] James L. Orr (Anderson ) Democratic March 4, 1853 – 33rd 34th 35th Redistricted from the 2nd district and re-elected in 1853 .Re-elected in 1854 .Re-elected in 1856 1853–1860 [ data missing ] John D. Ashmore (Anderson ) Democratic March 4, 1859 – 36th Elected in 1858 .Re-elected in 1860 but resigned due to Civil War. District inactive December 21, 1860 – 36th 37th Civil War District dissolved March 4, 1863 District re-established March 4, 1875 Robert Smalls (Beaufort ) Republican March 4, 1875 – 44th 45th Elected in 1874 .Re-elected in 1876 . 1875–1883 [ data missing ] George D. Tillman (Edgefield ) Democratic March 4, 1879 – 46th 47th Elected in 1878 .Re-elected in 1880 . Robert Smalls (Beaufort ) Republican July 19, 1882 – 47th Won contested election. John J. Hemphill (Chester ) Democratic March 4, 1883 – 48th 49th 50th 51st 52nd Elected in 1882 .Re-elected in 1884 .Re-elected in 1886 .Re-elected in 1888 .Re-elected in 1890 . 1883–1893 [ data missing ] Thomas J. Strait (Lancaster ) Democratic March 4, 1893 – 53rd 54th 55th Elected in 1892 .Re-elected in 1894 .Re-elected in 1896 . 1893–1903 [ data missing ] David E. Finley (Yorkville ) Democratic March 4, 1899 – 56th 57th 58th 59th 60th 61st 62nd 63rd 64th Elected in 1898 .Re-elected in 1900 .Re-elected in 1902 .Re-elected in 1904 .Re-elected in 1906 .Re-elected in 1908 .Re-elected in 1910 .Re-elected in 1912 .Re-elected in 1914 .Re-elected in 1916 but died before next term began. 1903–1913 [ data missing ] 1913–1923 [ data missing ] Vacant January 26, 1917 – 64th Paul G. McCorkle (Yorkville ) Democratic February 21, 1917 – Elected to finish Finley's term in the 64th Congress . William F. Stevenson (Cheraw ) Democratic March 4, 1917 – 65th 66th 67th 68th 69th 70th 71st 72nd Elected to finish Finley's term in the 65th Congress .Re-elected in 1918 .Re-elected in 1920 .Re-elected in 1922 .Re-elected in 1924 .Re-elected in 1926 .Re-elected in 1928 .Re-elected in 1930 . 1923–1933 [ data missing ] James P. Richards (Lancaster ) Democratic March 4, 1933 – 73rd 74th 75th 76th 77th 78th 79th 80th 81st 82nd 83rd 84th Elected in 1932 .Re-elected in 1934 .Re-elected in 1936 .Re-elected in 1938 .Re-elected in 1940 .Re-elected in 1942 .Re-elected in 1944 .Re-elected in 1946 .Re-elected in 1948 .Re-elected in 1950 .Re-elected in 1952 .Re-elected in 1954 . 1933–1943 [ data missing ] 1943–1953 [ data missing ] 1953–1963 [ data missing ] Robert W. Hemphill (Chester ) Democratic January 3, 1957 – 85th 86th 87th 88th Elected in 1956 .Re-elected in 1958 .Re-elected in 1960 .Re-elected in 1962 .United States District Court for the District of South Carolina . 1963–1973 [ data missing ] Vacant May 1, 1964 – 88th Thomas S. Gettys (Rock Hill ) Democratic November 3, 1964 – 88th 89th 90th 91st 92nd 93rd Elected to finish Hemphill's term .Also elected to the next full term .Re-elected in 1966 .Re-elected in 1968 .Re-elected in 1970 .Re-elected in 1972 . 1973–1983 [ data missing ] Kenneth L. Holland (Gaffney ) Democratic January 3, 1975 – 94th 95th 96th 97th Elected in 1974 .Re-elected in 1976 .Re-elected in 1978 .Re-elected in 1980 . John Spratt (York ) Democratic January 3, 1983 – 98th 99th 100th 101st 102nd 103rd 104th 105th 106th 107th 108th 109th 110th 111th Elected in 1982 .Re-elected in 1984 .Re-elected in 1986 .Re-elected in 1988 .Re-elected in 1990 .Re-elected in 1992 .Re-elected in 1994 .Re-elected in 1996 .Re-elected in 1998 .Re-elected in 2000 .Re-elected in 2002 .Re-elected in 2004 .Re-elected in 2006 .Re-elected in 2008 . 1983–1993 [ data missing ] 1993–2003 [ data missing ] 2003–2013 2003 - 2013
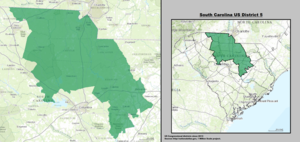
Mick Mulvaney (Lancaster ) Republican January 3, 2011 – 112th 113th 114th 115th Elected in 2010 .Re-elected in 2012 .Re-elected in 2014 .Re-elected in 2016 .Office of Management and Budget . 2013–2023 Static map of 2013-23 congressional district Vacant February 16, 2017 – 115th Ralph Norman (Rock Hill ) Republican June 20, 2017 – 115th 116th 117th 118th 119th Elected to finish Mulvaney's term .Re-elected in 2018 .Re-elected in 2020 .Re-elected in 2022 .Re-elected in 2024 .Governor of South Carolina . 2023–2033