Ethnicity
African Americans
 Former President Barack Obama
 Former Vice President Kamala Harris
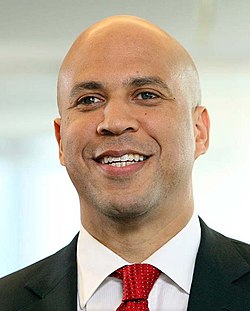
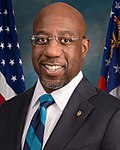 Senator Raphael Warnock


Originally, the Republican Party was favored by African Americans after the end of the civil war and emancipation of enslaved African Americans. This trend started to gradually change in the 1930s, with Franklin D. Roosevelt's New Deal programs that gave economic relief to all minorities including African Americans and Hispanics. Support for the civil rights movement in the 1960s by Democratic presidents John F. Kennedy and Lyndon B. Johnson helped give the Democrats even larger support among the Black community, although their position also alienated the Southern white population. Starting around this time, African Americans were alienated from the Republican Party by the Southern strategy, particularly by Richard Nixon. [1] Today, African Americans have stronger support for the Democratic Party than any group has for either party, voting 93% Democratic in the 2012 presidential election, [2] 89% Democratic in the 2016 presidential election, [3] and 87% Democratic in the 2020 presidential election. [4] Prominent Black American Democrats include President Barack Obama, Vice President Kamala Harris, former Supreme Court Justice Thurgood Marshall, Senators Raphael Warnock and Cory Booker, former Senator Carol Moseley Braun, former Governors Douglas Wilder and Deval Patrick, Representatives Shirley Chisholm, John Lewis, Elijah Cummings and Jim Clyburn, and Mayor Brandon Johnson.
Asian Americans
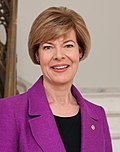
 Senator Tammy Duckworth
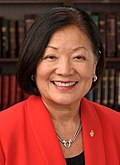
 Senator Mazie Hirono
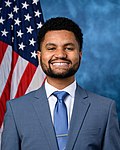
 Senator Andy Kim
 Representative Mark Takano
 Representative Ro Khanna


The Democratic Party also has considerable support in the small yet growing Asian American population. The Asian American population had been a stronghold of the Republican Party until the United States presidential election of 1992 in which George H. W. Bush won 55% of the Asian American vote, compared to Bill Clinton winning 31% and Ross Perot winning 15%. Originally, the majority of Asian Americans consisted of strongly anti-communist Vietnamese refugees, Chinese Americans, Taiwanese Americans, Korean Americans, and Filipino Americans. The Republican Party's socially conservative, fervently anti-communist position strongly resonated with this original demographic. The Democratic Party made gains among the Asian American population starting in 1996 and in 2006 won 62% of the Asian American vote. Exit polls after the 2008 presidential election indicated that Democrat Barack Obama had won 62% of the Asian American vote. [5] In the 2012 presidential election, 73% of the Asian American electorate voted for Obama's reelection. [6]
According to a survey taken by the Times of India, Obama had the support of 85% of Indian Americans, 68% of Chinese Americans, and 57% of Filipino Americans in 2012. [7] The Asian American community's increasing number of young voters has also helped to erode traditionally Republican voting blocs such as Vietnamese Americans, making the community increasingly a Democratic stronghold. Prominent Asian American Democrats include Senators Mazie Hirono and Tammy Duckworth, former senators Daniel Inouye and Daniel Akaka, former Governor and Secretary of Commerce Gary Locke, and Representatives Judy Chu, Doris Matsui, and Andy Kim.
Hispanic and Latino Americans
 Senator Catherine Cortez Masto
 Senator Alex Padilla
 Representative Pete Aguilar
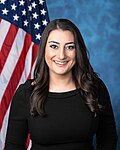
 Representative Alexandria Ocasio-Cortez


The Hispanic American population, particularly the large Mexican American population in the Southwest and the large Puerto Rican, Dominican, and Central American populations in the Northeast, have been strongholds for the Democratic Party. Hispanic Democrats commonly favor liberal views on immigration. In the 1996 presidential election, Democratic president Bill Clinton received 72% of the Hispanic vote.
After a period of incremental gains under George W. Bush, the Republican Party's support among Hispanics seriously eroded after a heated and acrimonious debate within the party during the 109th Congress over immigration reform. Nationwide protests helped galvanize Hispanic political participation, and in the 2006 elections, Democrats increased their share of the Hispanic vote to 69%. [8] This trend continued in 2008, as Barack Obama carried the Latino vote with 67%. [9] Obama expanded his share of the Latino vote to 71% in the 2012 presidential election.
Native Americans
 Former Secretary Deb Haaland
 Representative Sharice Davids


The Democratic Party also has strong support among certain tribes of the Native American population. [42] Though now a small percentage of the population (virtually non-existent in some regions), most Native American precincts vote Democratic in margins exceeded only by African Americans. [43]
Modern-day Democratic Native American politicians include former Congressman and former United States Under Secretary of the Army Brad Carson of Oklahoma, Lieutenant Governor Byron Mallott of Alaska, Principal Chief Bill John Baker of the Cherokee Nation, and Governor Bill Anoatubby of the Chickasaw Nation.
In 2018, Democrats Deb Haaland of New Mexico and Sharice Davids of Kansas became the first Native American women ever elected to Congress. [44] Democrat Peggy Flanagan was also elected in 2018 and currently serves as Lieutenant Governor of Minnesota. Flanagan is the second Native American woman to be elected to statewide executive office in U.S. history and the highest-ranking Native woman to be elected to executive office. [45]


