In 1802, Spain returned most of the land to France, but keeping title to about 7,500 square miles. In 1803, most of the land for modern day Kansas was acquired by the United States from France as part of the 828,000 square mile Louisiana Purchase for 2.83 cents per acre.
The first railroad in Greenwood County was built through that territory in 1879.[5]
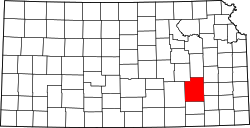
Geography
According to the U.S. Census Bureau, the county has a total area of 1,153 square miles (2,990km2), of which 1,143 square miles (2,960km2) is land and 9.3 square miles (24km2) (0.8%) is water.[6] It is the fifth-largest county in Kansas by area.
U.S. Decennial Census[8] 1790-1960[9] 1900-1990[10] 1990-2000[11] 2010-2020[1]
As of the 2000 census,[12] there were 7,673 people, 3,234 households, and 2,153 families residing in the county. The population density was 7 peopleper square mile (2.7 people/km2). There were 4,273 housing units at an average density of 4 per square mile (1.5/km2). The racial makeup of the county was 96.53% White, 0.83% Native American, 0.14% Black or African American, 0.10% Asian, 0.81% from other races, and 1.58% from two or more races. Hispanic or Latino of any race were 1.72% of the population.
There were 3,234 households, out of which 27.10% had children under the age of 18 living with them, 56.50% were married couples living together, 6.60% had a female householder with no husband present, and 33.40% were non-families. 30.30% of all households were made up of individuals, and 16.80% had someone living alone who was 65 years of age or older. The average household size was 2.31 and the average family size was 2.86.
In the county, the population was spread out, with 23.70% under the age of 18, 6.50% from 18 to 24, 23.20% from 25 to 44, 23.70% from 45 to 64, and 22.80% who were 65 years of age or older. The median age was 43 years. For every 100 females there were 95.50 males. For every 100 females age 18 and over, there were 91.50 males.
The median income for a household in the county was $30,169, and the median income for a family was $38,140. Males had a median income of $27,021 versus $19,356 for females. The per capita income for the county was $15,976. About 8.20% of families and 12.50% of the population were below the poverty line, including 16.20% of those under age 18 and 10.10% of those age 65 or over.
Government
Greenwood county is often carried by Republican Candidates. The last time a Democratic candidate has carried this county was in 1936 by Franklin D. Roosevelt.
Presidential elections
Presidential election results
United States presidential election results for Greenwood County, Kansas[13]
Greenwood County was a prohibition, or "dry", county until the Kansas Constitution was amended in 1986 and voters approved the sale of alcoholic liquor by the individual drink with a 30% food sales requirement.[14]
Greenwood County is divided into fifteen townships. The city of Eureka is considered governmentally independent and is excluded from the census figures for the townships. In the following table, the population center is the largest city (or cities) included in that township's population total, if it is of a significant size.
↑ "Map of Wet and Dry Counties". Alcoholic Beverage Control, Kansas Department of Revenue. November 2006. Archived from the original on October 8, 2007. Retrieved December 28, 2007.
This page is based on this Wikipedia article Text is available under the CC BY-SA 4.0 license; additional terms may apply. Images, videos and audio are available under their respective licenses.