This is a list of notable performances of third party and independent candidates in United States mayoral elections.
It is rare for candidates, other than those of the six parties which have succeeded as major parties (Federalist Party, Democratic-Republican Party, National Republican Party, Democratic Party, Whig Party, Republican Party), to take large shares of the vote in elections.
Listed below are mayoral elections in which a third party or independent candidate won or were reasonably close to receiving 5.0% of the vote (greater than 4.95%). Winners are shown in bold. All elections are organized by state. These lists do not however include non-partisan elections, where the political affiliations of the candidates are not shown on the ballot, leaving no real major or minor party candidates.
Year | City | Party | Nominee | # Votes | % Votes | Place |
---|---|---|---|---|---|---|
1979 | Tucson [1] | Independent | John Vargas | 18,784 | 39.69 / 100 | 2nd |
1991 | Tucson | Libertarian | Gay Lynn Goetzke | 8,172 | 10.86 / 100 | 3rd |
1995 | Tucson | Libertarian | Ed Kahn | 6,738 | 9.21 / 100 | 3rd |
1999 | Tucson | Libertarian | Ed Kahn | 4,834 | 5.61 / 100 | 3rd |
2007 | Tucson | Green | Dave Croteau | 17,962 | 28.08 / 100 | 2nd |
2019 | Tucson | Independent | Ed Ackerley | 33,673 | 39.69 / 100 | 2nd |
2020 | Mesa | No party preference | Verl Farnsworth | 30,452 | 33.5 / 100 | 2nd |
2023 | Tucson [2] | Independent | Ed Ackerley | 5,289 | 6.74 / 100 | 3rd |
Year | City | Party | Nominee | # Votes | % Votes | Place |
---|---|---|---|---|---|---|
1889 | San Diego | Citizens' Non-Partisan | Douglas Gunn | 1,817 | 58.41 / 100 | Elected |
1893 | San Diego | Independent | William H. Carlson | 1,219 | 46.78 / 100 | Elected |
People's | John Castle | 210 | 8.06 / 100 | 4th | ||
1895 | San Diego | Independent | William H. Carlson | 1,090 | 33.93 / 100 | Re-elected |
People's | Daniel Stone | 1,015 | 31.59 / 100 | 2nd | ||
1897 | San Diego | Independent | William H. Carlson | 623 | 17.48 / 100 | Lost re-election 3rd |
People's | Abram C. Mouser | 328 | 9.2 / 100 | 4th | ||
Independent | Henry Sweeney | 251 | 7.04 / 100 | 5th | ||
1901 | San Diego | Socialist | Frank Simpson | 157 | 5.55 / 100 | 3rd |
1901 | San Francisco | Union Labor | Eugene Schmitz | 21,776 | 40.71 / 100 | Elected |
1902 | Los Angeles | Union Labor | George McGahan | 3,211 | 16.31 / 100 | 3rd |
1903 | San Diego | Socialist | Frank Simpson | 219 | 7.3 / 100 | 3rd |
1903 | San Francisco | Union Labor | Eugene Schmitz | 26,016 | 43.87 / 100 | Re-elected |
1905 | San Diego | Independent | John L. Sehon | 2,018 | 52.66 / 100 | Elected |
Socialist | W. J. Kirkwood | 438 | 11.43 / 100 | 3rd | ||
1905 | San Francisco | Union Labor | Eugene Schmitz | 40,191 | 56.58 / 100 | Re-elected |
1906 | Los Angeles | Nonpartisan | Lee Gates | 8,465 | 27.0 / 100 | 2nd |
Public Ownership | Stanley Wilson | 8,465 | 12.37 / 100 | 4th | ||
1909 | San Francisco | Union Labor | P. H. McCarthy | 29,455 | 45.86 / 100 | Elected |
1925 | Los Angeles | Independent | Miles S. Gregory | 9,540 | 5.95 / 100 | 3rd |
1973 | Los Angeles | Independent | Thomas Reddin | 83,930 | 12.70 / 100 | 4th |
2003 | San Francisco | Green | Matt Gonzalez | 40,714 (first round) 119,329 (second round) | 19.57 / 100 (first round)47.19 / 100 (second round) | 2nd |
Year | City | Party | Nominee | # Votes | % Votes | Place |
---|---|---|---|---|---|---|
1929 | Bridgeport [3] | Socialist | Jasper McLevy | 1,968 | 5.21 / 100 | 3rd |
1931 | Bridgeport [4] | Socialist | Jasper McLevy | 15,294 | 35.58 / 100 | 2nd |
1933 | Bridgeport [5] | Socialist | Jasper McLevy | 22,445 | 48.64 / 100 | Elected |
1935 | Bridgeport [6] | Socialist | Jasper McLevy | 24,267 | 55.74 / 100 | Re-elected |
1937 | Bridgeport [7] | Socialist | Jasper McLevy | 26,538 | 67.10 / 100 | Re-elected |
1939 | Bridgeport [8] | Socialist | Jasper McLevy | 23,113 | 57.50 / 100 | Re-elected |
1941 | Bridgeport [9] | Socialist | Jasper McLevy | 22,225 | 68.00 / 100 | Re-elected |
1943 | Bridgeport [10] | Socialist | Jasper McLevy | 18,033 | 65.36 / 100 | Re-elected |
1945 | Bridgeport [11] | Socialist | Jasper McLevy | 23,202 | 55.31 / 100 | Re-elected |
1947 | Bridgeport [12] | Socialist | Jasper McLevy | 20,007 | 55.31 / 100 | Re-elected |
1949 | Bridgeport [13] | Socialist | Jasper McLevy | 28,849 | 53.63 / 100 | Re-elected |
1951 | Bridgeport [14] | Socialist | Jasper McLevy | 25,781 | 53.67 / 100 | Re-elected |
1953 | Bridgeport [15] | Socialist | Jasper McLevy | 24,443 | 51.26 / 100 | Re-elected |
1955 | Bridgeport [16] | Socialist | Jasper McLevy | 24,253 | 47.19 / 100 | Re-elected |
1957 | Bridgeport [17] | Socialist | Jasper McLevy | 24,219 | 45.04 / 100 | Lost re-election 2nd |
1959 | Bridgeport [18] | Socialist | Jasper McLevy | 14,479 | 27.93 / 100 | 2nd |
1961 | Bridgeport [19] | Socialist | William S. Visokay | 10,807 | 21.12 / 100 | 3rd |
1963 | Bridgeport [20] | Socialist | William S. Visokay | 5,334 | 12.20 / 100 | 3rd |
1971 | Bridgeport [21] | Socialist | Albert Perrocco | 4,959 | 10.78 / 100 | 3rd |
1973 | Bridgeport [22] | Socialist | Albert Perrocco | 2,175 | 5.18 / 100 | 3rd |
1975 | Bridgeport [23] | Socialist | Albert Perrocco | 3,200 | 8.44 / 100 | 3rd |
1981 | Hartford [24] | Independent | Robert F. Ludgin | 6,867 | 26.73 / 100 | 2nd |
1995 | Hartford [25] | Independent | Elizabeth Horton Sheff | 1,788 | 14.95 / 100 | 2nd |
1997 | Bridgeport [26] | Reform | Robert K. Pavlick | 976 | 5.98 / 100 | 3rd |
Hartford [27] | Independent | Kenneth A. Mink | 999 | 10.10 / 100 | 2nd | |
2001 | Hartford [28] | Independent | Robert F. Ludgin | 1,863 | 16.10 / 100 | 2nd |
2003 | Hartford [29] | Libertarian | Richard Lion | 564 | 5.62 / 100 | 3rd |
2007 | Hartford [30] | Independent | I. Charles Matthews | 4,556 | 34.14 / 100 | 2nd |
Independent | Minnie Gonzalez | 996 | 7.46 / 100 | 3rd | ||
New Haven [31] | Green | Ralph Ferrucci | 1,428 | 11.70 / 100 | 3rd | |
2009 | New Haven [32] | Green | Ralph Ferrucci | 1,720 | 16.54 / 100 | 2nd |
Independent | Angela Whatley | 670 | 6.44 / 100 | 3rd | ||
2011 | New Haven [33] | Independent | Jeffrey Kerekes | 6,901 | 44.65 / 100 | 2nd |
2013 | New Haven [34] | Independent | Justin Elicker | 9,425 | 45.34 / 100 | 2nd |
2015 | Bridgeport | Independent | Mary Jane Foster | 6,029 | 29.81 / 100 | 2nd |
New Haven | Independent | Ronald Smith | 1,070 | 8.81 / 100 | 2nd | |
2017 | Stamford | Independent | John J. Zito, Jr. | 1,260 | 6.73 / 100 | 3rd |
2021 | Stamford | Independent | Bobby Valentine | 14,060 | 47.5 / 100 | 2nd |
2023 | Bridgeport | Independent Party | John Gomes | 5,550 | 40.0 / 100 | 2nd |
Independent | Lamond Daniels | 1,836 | 13.2 / 100 | 3rd | ||
2024 | Bridgeport | Independent Party | John Gomes | 4,131 | 38.1 / 100 | 2nd |
Year | City | Party | Nominee | # Votes | % Votes | Place |
---|---|---|---|---|---|---|
2000 | Wilmington [35] | Independent Party of Delaware | Sandra Poppiti | 4,476 | 18.78 / 100 | 2nd |
2016 | Wilmington | Independent Party of Delaware | Steven Washington | 1,905 | 6.99 / 100 | 3rd |
Year | City | Party | Nominee | # Votes | % Votes | Place |
---|---|---|---|---|---|---|
2022 | Washington | Independent | Rodney "Red" Grant | 28,467 | 14.9 / 100 | 2nd |
Year | City | Party | Nominee | # Votes | % Votes | Place |
---|---|---|---|---|---|---|
1983 | Gary [36] | Socialist Workers | Marie Head | 1,238 | 6.47 / 100 | 2nd |
1995 | Gary [37] | Independent | Marion Williams | 5,482 | 18.11 / 100 | 2nd |
Indianapolis [38] | Libertarian | Steve Dillion | 7,175 | 6.47 / 100 | 3rd | |
2011 | Gary [39] | Independent | LaVetta Sparks-Wade | 995 | 7.47 / 100 | 2nd |
2015 | Gary [40] | Independent | Eddie Tarver | 1,581 | 15.64 / 100 | 2nd |
2019 | Terre Haute [41] | Independent | Pat Goodwin | 4,962 | 40.02 / 100 | 2nd |
Year | City | Party | Nominee | # Votes | % Votes | Place |
---|---|---|---|---|---|---|
1879 | Chicago | Socialist Labor | Ernest Schmidt | 11,829 | 20.39 / 100 | 3rd |
1887 | Chicago | Labor | Robert S. Nelson | 23,490 | 31.27 / 100 | 2nd |
1891 | Chicago | Reform | Hempstead Washburne | 46,957 | 28.84 / 100 | Elected |
Independent Democrat | Carter Harrison Sr. | 42,931 | 26.36 / 100 | 3rd | ||
Citizens | Elmer Washburn | 24,027 | 14.75 / 100 | 4th | ||
1897 | Chicago | Independent Republican | John Maynard Harlan | 69,730 | 7.02 / 100 | 2nd |
1899 | Chicago | Municipal Ownership | John Peter Altgeld | 47,169 | 15.43 / 100 | 3rd |
1905 | Chicago | Socialist | John Collins | 23,034 | 7.02 / 100 | 3rd |
1911 | Chicago | Socialist | William E. Rodriguez | 24,825 | 6.77 / 100 | 3rd |
1919 | Chicago | Independent | Maclay Hoyne | 110,851 | 16.05 / 100 | 3rd |
Labor | John Fitzpatrick | 55,990 | 8.11 / 100 | 4th | ||
1923 | Chicago | Socialist | William A. Cunnea | 41,186 | 5.97 / 100 | 3rd |
1927 | Chicago | People's Ownership Smash Crime Rings | John Dill Robertson | 51,347 | 5.14 / 100 | 3rd |
1935 | Chicago | Third | Newton Jenkins | 87,726 | 8.34 / 100 | 3rd |
1987 | Chicago | Solidarity | Edward Vrdolyak | 468,493 | 41.96 / 100 | 2nd |
1989 | Chicago | Harold Washington | Timothy C. Evans | 428,105 | 41.12 / 100 | 2nd |
1991 | Chicago | Harold Washington | R. Eugene Pincham | 160,302 | 25.13 / 100 | 2nd |
1995 | Chicago | Independent | Roland Burris | 217,315 | 36.25 / 100 | 2nd |
Year | City | Party | Nominee | # Votes | % Votes | Place |
---|---|---|---|---|---|---|
2021 | Cedar Rapids | Independent | Brad Hart | 7,308 | 28.1 / 100 | Lost re-election 3rd |
Year | City | Party | Nominee | # Votes | % Votes | Place |
---|---|---|---|---|---|---|
2021 | New Orleans | No party preference | Leilani Heno | 6,605 | 8.8 / 100 | 3rd |
2022 | Shreveport | Independent | Mario Chavez | 9,458 | 18.3 / 100 | 3rd |
Year | City | Party | Nominee | # Votes | % Votes | Place |
---|---|---|---|---|---|---|
2005 | Annapolis [42] | Independent | Gilbert Renaut | 2,764 | 36.44 / 100 | 2nd |
2016 | Baltimore | Write-in | Sheila Dixon | 49,716 | 22.3 / 100 | 2nd |
Green | Joshua Harris | 22,204 | 9.9 / 100 | 4th | ||
2020 | Baltimore | Independent | Bob Wallace | 47,275 | 20.2 / 100 | 2nd |
Year | City | Party | Nominee | # Votes | % Votes | Place |
---|---|---|---|---|---|---|
1846 | Boston [43] | Native American | Jerome V. C. Smith | 735 | 12.35 / 100 | 3rd |
1848 | Boston [44] | Free Soil | Bradford Sumner | 929 | 11.91 / 100 | 3rd |
Native American | Jerome V. C. Smith | 417 | 5.35 / 100 | 4th | ||
1849 | Boston [45] | Free Soil | Bradford Sumner | 349 | 6.20 / 100 | 3rd |
1851 | Boston [46] | Native American | Jerome V. C. Smith | 2,736 | 34.30 / 100 | 2nd |
1852 | Boston [47] | Native American | Jerome V. C. Smith | 5,021 | 41.94 / 100 | Elected |
1855 | Boston [48] | Native American | Nathaniel B. Shurtleff | 5,390 | 41.95 / 100 | 2nd |
1903 | Boston | Socialist | George W. Galvin | 5,205 | 6.7 / 100 | 3rd |
1905 | Boston | Populist | Henry S. Dewey | 11,608 | 12.5 / 100 | 3rd |
Year | City | Party | Nominee | # Votes | % Votes | Place |
---|---|---|---|---|---|---|
2021 | Saint Paul | Independent | Dino Guerin | 7,454 | 12.6 / 100 | 2nd |
Independent | Paul Langenfeld | 5,298 | 9.0 / 100 | 3rd | ||
Independent | Bill Hosko | 3,423 | 5.8 / 100 | 4th | ||
Year | City | Party | Nominee | # Votes | % Votes | Place |
---|---|---|---|---|---|---|
2021 | Jackson | Independent | Les Tannehill | 2,536 | 13.4 / 100 | 2nd |
Independent | Charlotte Reeves | 1,697 | 8.9 / 100 | 3rd |
Year | City | Party | Nominee | # Votes | % Votes | Place |
---|---|---|---|---|---|---|
1999 | Woodbridge [49] | Independent | John Vrtaric | 1,012 | 10.31 / 100 | 3rd |
2005 | Atlantic City [50] | Independent | Joseph Polillo | 1,162 | 20.45 / 100 | 2nd |
2008 | Atlantic City [51] | Independent | Joseph Polillo | 2,448 | 22.84 / 100 | 2nd |
2009 | Atlantic City [52] | Independent | Joseph Polillo | 706 | 12.08 / 100 | 3rd |
Independent | Dennis M. Mason | 289 | 4.95 / 100 | 4th |
Year | City | Party | Nominee | # Votes | % Votes | Place |
---|---|---|---|---|---|---|
1836 | New York City | Equal Rights | Alexander Ming Jr. | 2,712 | 10.31 / 100 | 3rd |
Native American | Samuel Morse | 1,496 | 5.69 / 100 | 4th | ||
1837 | New York City | Equal Rights | Moses Jacques | 4,239 | 12.1 / 100 | 3rd |
1844 | New York City | Native American | James Harper | 24,510 | 48.68 / 100 | Elected |
1845 | New York City | Native American | James Harper | 17,485 | 35.67 / 100 | 2nd |
1846 | New York City | Native American | William B. Cozzens | 8,372 | 17.97 / 100 | 3rd |
1854 | New York City | American | James W. Barker | 18,547 | 31.1 / 100 | 2nd |
Independent Democrat | Wilson G. Hunt | 15,397 | 25.82 / 100 | 3rd | ||
1856 | New York City | American | Isaac O. Barker | 25,182 | 32.39 / 100 | 2nd |
Independent Democrat | James S. Libby | 4,684 | 6.03 / 100 | 4th | ||
1859 | New York City | Mozart Hall [53] | Fernando Wood | 29,940 | 38.25 / 100 | Elected |
1861 | New York City | Mozart Hall [53] | Fernando Wood | 24,187 | 32.52 / 100 | 3rd |
1863 | New York City | Reform Democrat | Charles Godfrey Gunther | 29,121 | 40.96 / 100 | Elected |
1865 | New York City | Mozart Hall [53] | John Hecker | 10,390 | 12.73 / 100 | 3rd |
McKeon Democracy | Charles Godfrey Gunther | 6,758 | 8.28 / 100 | 4th | ||
1867 | New York City | Mozart Hall [53] | Fernando Wood | 22,837 | 21.88 / 100 | 2nd |
1872 | New York City | Reform Democrat | James O'Brien | 31,121 | 23.88 / 100 | 3rd |
1874 | New York City | Liberal Democrat | Oswald Ottendorfer | 24,226 | 18.45 / 100 | 3rd |
1878 | New York City | New York County Democracy [54] | Edward Cooper | 79,986 | 56.02 / 100 | Elected |
1884 | New York City | New York County Democracy [54] | William Russell Grace | 96,288 | 42.13 / 100 | Elected |
1886 | New York City | United Labor [55] | Henry George | 68,110 | 31.01 / 100 | 2nd |
1888 | New York City | New York County Democracy [54] | Abram Hewitt | 71,979 | 26.42 / 100 | 3rd |
1895 | Brooklyn | Reform Democrat | Edward M. Shepard | 9,510 | 5.66 / 100 | 3rd |
1897 | New York City | Citizens Union | Seth Low | 151,540 | 28.83 / 100 | 2nd |
1905 | New York City | Municipal Ownership | William Randolph Hearst | 224,929 | 37.16 / 100 | 2nd |
1909 | New York City | Civic Alliance [56] | William Randolph Hearst | 154,187 | 25.88 / 100 | 3rd |
1913 | Buffalo [57] | Progressive | John Lord O'Brian | 23,757 | 35.24 / 100 | 2nd |
New York City | Socialist | Charles Edward Russell | 32,205 | 5.12 / 100 | 3rd | |
1915 | Schenectady [58] | Socialist | George R. Lunn | 6,069 | 40.81 / 100 | Elected |
1917 | New York City | Fusion | John Purroy Mitchel | 155,497 | 23.1 / 100 | 2nd |
Socialist | Morris Hillquit | 145,332 | 21.59 / 100 | 3rd | ||
1921 | New York City | Socialist | Jacob Panken | 82,607 | 7.06 / 100 | 3rd |
1929 | Buffalo [59] | Socialist | Frank Perkins | 8,785 | 5.64 / 100 | 3rd |
New York City | Socialist | Norman Thomas | 175,697 | 12.29 / 100 | 3rd | |
1932 | New York City | Socialist | Morris Hillquit | 249,887 | 12.37 / 100 | 3rd |
Independent (Write-In) | Joseph V. McKee | 234,372 | 11.6 / 100 | 4th | ||
1933 | New York City | Recovery | Joseph V. McKee | 609,053 | 28.3 / 100 | 2nd |
1937 | Buffalo | Erie County Pole [60] | Joseph Kaszubowski | 11,392 | 5.54 / 100 | 3rd |
1945 | Buffalo | People's | Frank X. Schwab | 35,257 | 19.8 / 100 | 3rd |
New York City | No Deal [61] | Newbold Morris | 408,408 | 20.6 / 100 | 3rd | |
1949 | New York City | American Labor | Vito Marcantonio | 356,625 | 13.76 / 100 | 3rd |
1950 | New York City | Experience [62] | Vincent R. Impellitteri | 1,161,175 | 44.21 / 100 | Re-elected |
1953 | New York City | Liberal | Rudolph Halley | 467,104 | 21.16 / 100 | 3rd |
1957 | Buffalo | Independent | Elmer Lux | 45,759 | 23.82 / 100 | 3rd |
1961 | Buffalo | Citizens | Frank A. Sedita | 62,196 | 31.56 / 100 | 2nd |
New York City | Citizens | Lawrence E. Gerosa | 321,604 | 13.26 / 100 | 3rd | |
1965 | New York City | Conservative | William F. Buckley Jr. | 341,226 | 13.36 / 100 | 3rd |
1967 | Yonkers | Conservative | Nicholas DiCostanzo | 5,802 | 6.99 / 100 | 3rd |
1969 | New York City | Liberal | John Lindsay | 1,012,633 | 42.36 / 100 | Re-elected |
Yonkers | Conservative | Matthew Hollohan | 4,249 | 5.42 / 100 | 3rd | |
1973 | New York City | Liberal | Albert H. Blumenthal | 262,600 | 15.4 / 100 | 3rd |
Conservative | Mario Biaggi | 186,977 | 10.96 / 100 | 4th | ||
1977 | Albany [63] | Liberal | Howard C. Nolan | 2,446 | 7.37 / 100 | 3rd |
Buffalo | Conservative | James D. Griffin | 57,642 | 41.97 / 100 | Elected | |
New York City | Liberal | Mario Cuomo | 587,913 | 40.97 / 100 | 2nd | |
1981 | Buffalo | Liberal | Alfred Coppola | 7,869 | 9.81 / 100 | 2nd |
New York City | Unity [64] | Frank J. Barbaro | 162,719 | 13.31 / 100 | 2nd | |
Conservative | John A. Esposito | 60,100 | 4.92 / 100 | 3rd | ||
Syracuse [65] | Conservative | Melvin N. Zimmer | 2,772 | 5.49 / 100 | ||
1983 | Yonkers | Conservative | Carlo Calvi | 7,736 | 13.74 / 100 | 3rd |
Independent Taxpayers | Charles A. Cola | 6,764 | 7.97 / 100 | 4th | ||
1985 | New York City | Liberal | Carol Bellamy | 113,471 | 10.2 / 100 | 2nd |
1989 | Buffalo | Independent (Write-In) | Wilbur P. Trammell | 11,033 | 16.27 / 100 | 2nd |
Liberal | William B. Hoyt | 9,632 | 14.2 / 100 | 3rd | ||
Rochester | Independent | John G. Erb | 5,503 | 14.21 / 100 | 3rd | |
1991 | Yonkers | Independent | Angelo Martinelli | 13,093 | 28.22 / 100 | 3rd |
1993 | Buffalo | Conservative | Eugene M. Fahey | 7,566 | 14.29 / 100 | 3rd |
Rochester | Independent | Kevin B. Murray | 2,489 | 6.37 / 100 | 3rd | |
1997 | Albany [66] | Liberal | John McEneny | 4,462 | 21.41 / 100 | 2nd |
Buffalo | Right to Life | James D. Griffin | 16,539 | 23.15 / 100 | 2nd | |
Liberal | James Pitts | 11,424 | 15.99 / 100 | 3rd | ||
2001 | Syracuse [67] | Green | Jennifer Daniels | 2,442 | 7.60 / 100 | 3rd |
2003 | New Rochelle [68] | Working Families | Linda Levine | 2,121 | 14.55 / 100 | 3rd |
Yonkers | Independence | Michael J. Spano | 2,570 | 7.03 / 100 | 3rd | |
2005 | Albany [69] | Green | Alice Green | 5,548 | 8.74 / 100 | 2nd |
Rochester | Working Families | Tim Mains | 3,786 | 10.36 / 100 | 3rd | |
2009 | Albany [70] | Working Families | Corey Ellis | 4,801 | 29.19 / 100 | 2nd |
New York City | Independent | Michael Bloomberg | 585,470 | 50.7 / 100 | Re-elected | |
Syracuse [71] | Conservative (NY) | Otis Jennings | 2,448 | 10.42 / 100 | 3rd | |
2011 | Rochester | Working Families | William A. Johnson Jr. | 10,732 | 42.21 / 100 | 2nd |
Green | Alex White | 2,221 | 8.74 / 100 | 3rd | ||
Yonkers | Independence | Carlo Calvi | 3,015 | 10.26 / 100 | 3rd | |
2013 | Rochester | Independence | Thomas Richards | 13,415 | 39.46 / 100 | 2nd |
Green | Alex White | 1,784 | 5.25 / 100 | 3rd | ||
2015 | New Rochelle [72] | Independence | James A. O'Toole | 3,548 | 38.30 / 100 | 2nd |
2017 | Buffalo | Reform | Mark J. F. Schroeder | 11,446 | 26.09 / 100 | 2nd |
Syracuse | Independence | Ben Walsh | 13,584 | 53.21 / 100 | Elected | |
2021 | Albany | Independence | Gregory J. Aidala | 2,374 | 16.9 / 100 | 3rd |
Buffalo | Write-in | Byron Brown | 38,108 | 59.4 / 100 | Re-elected | |
Syracuse | Independence | Ben Walsh | 13,584 | 59.6 / 100 | Re-elected | |
Year | City | Party | Nominee | # Votes | % Votes | Place |
---|---|---|---|---|---|---|
1965 | Cleveland [73] | Independent | Carl Stokes | 87,716 | 36.66 / 100 | 2nd |
Independent | Ralph A. McAllister | 22,650 | 9.47 / 100 | 4th | ||
1971 | Cleveland [74] | Independent | Arnold R. Pinkey | 72,785 | 31.76 / 100 | 2nd |
2013 | Youngstown [75] | Independent | DeMaine J. Kitchen | 4,582 | 43.26 / 100 | 2nd |
2017 | Youngstown [76] | Independent | Sean McKinney | 5,127 | 45.44 / 100 | 2nd |
Independent | Janet Tarpley | 723 | 6.41 / 100 | 3rd |
Year | City | Party | Nominee | # Votes | % Votes | Place |
---|---|---|---|---|---|---|
1911 | Oklahoma City [77] | Socialist | Oscar Ameringer | 1,876 | 22.7 / 100 | 3rd |
Year | City | Party | Nominee | # Votes | % Votes | Place |
---|---|---|---|---|---|---|
1852 | Philadelphia | Independent | William Badger | 4,328 | 31.99 / 100 | 2nd |
1874 | Philadelphia | Independent | Alexander McClure | 49,133 | 44.97 / 100 | 2nd |
1915 | Philadelphia | Franklin | George D. Porter | 88,135 | 33.96 / 100 | 2nd |
1919 | Philadelphia | Charter | Joseph S. McLaughlin | 17,900 | 6.34 / 100 | 3rd |
1927 | Philadelphia | Citizens | J. Hampton Moore | 128,611 | 29.29 / 100 | 2nd |
1975 | Philadelphia | Independent | Charles W. Bowser | 138,783 | 24.61 / 100 | 2nd |
1979 | Philadelphia | Consumer's | Lucien E. Blackwell | 103,620 | 17.38 / 100 | 3rd |
1983 | Philadelphia | Independent | Thomas Leonard | 57,146 | 7.97 / 100 | 2nd |
2001 | Harrisburg [78] | Green | Diane F. White | 1,070 | 17.50 / 100 | 2nd |
2009 | Scranton [79] | Independent | Gary A. DiBileo | 6,058 | 41.69 / 100 | 3rd |
2013 | Allentown [80] | Independent | W. Michael Donovan | 3,602 | 38.13 / 100 | 2nd |
Harrisburg [81] | Independent | Aaron Johnson | 1,334 | 18.31 / 100 | 3rd | |
Year | City | Party | Nominee | # Votes | % Votes | Place |
---|---|---|---|---|---|---|
1990 | Providence [82] | Independent | Buddy Cianci | 16,416 | 34.99 / 100 | Elected |
Independent | Frederick Lippitt | 16,099 | 34.32 / 100 | 2nd | ||
1994 | Providence [83] | Independent | Buddy Cianci | 20,510 | 55.47 / 100 | Re-elected |
Independent | Paul Jabour | 14,955 | 40.44 / 100 | 2nd | ||
1998 | Providence [84] | Independent | Buddy Cianci | 23,746 | 34.99 / 100 | Re-elected |
2004 | Warwick [85] | Independent | Carlo E. Pisaturo, Jr. | 2,623 | 6.73 / 100 | 3rd |
2008 | Pawtucket [86] | Independent | Donald R. Grebien | 10,478 | 46.14 / 100 | 2nd |
2010 | Providence [87] | Independent | Jonathan Scott | 6,006 | 17.91 / 100 | 2nd |
2012 | Warwick [88] | Independent | John Kirby | 6,917 | 18.41 / 100 | 2nd |
2014 | Providence [89] | Independent | Buddy Cianci | 17,306 | 45.04 / 100 | 2nd |
Warwick [90] | Independent | Kevin C. Eisemann | 1,870 | 6.22 / 100 | 3rd | |
2016 | Pawtucket [91] | Independent | John T. Arcaro | 5,090 | 24.51 / 100 | 2nd |
2018 | Pawtucket [92] | Independent | David F. Norton | 4,737 | 28.59 / 100 | 2nd |
Providence [93] | Independent | Dianne S. Witman | 14,016 | 33.11 / 100 | 2nd | |
2020 | Warwick [94] | Independent | Frank Picozzi | 26,625 | 59.12 / 100 | Elected |
Year | City | Party | Nominee | # Votes | % Votes | Place |
---|---|---|---|---|---|---|
1975 | Charleston [95] | Independent | J. Kenneth Rentiers | 1,602 | 10.71 / 100 | 3rd |
Independent | George Fuller | 1,017 | 6.80 / 100 | 4th | ||
1999 | Charleston [96] | Independent | Maurice Washington | 5,126 | 28.89 / 100 | 2nd |
Year | City | Party | Nominee | # Votes | % Votes | Place |
---|---|---|---|---|---|---|
1981 | Burlington | Independent | Bernie Sanders | 4,030 | 43.43 / 100 | Elected |
Independent | Richard Bove | 1,091 | 11.76 / 100 | 3rd | ||
1983 | Burlington | Independent | Bernie Sanders | 6,942 | 52.12 / 100 | Re-elected |
1985 | Burlington | Independent | Bernie Sanders | 5,760 | 56.09 / 100 | Re-elected |
Independent | Diane Gallagher | 1,234 | 12.02 / 100 | 3rd | ||
1987 | Burlington | Independent | Bernie Sanders | 6,759 | 55.89 / 100 | Re-elected |
1989 | Burlington | Independent | Peter Clavelle | 5,626 | 56.11 / 100 | Elected |
1993 | Burlington | Independent | Peter Clavelle | 4,579 | 46.49 / 100 | Lost re-election 2nd |
1995 | Burlington | Independent | Peter Clavelle | N/A | N/A | Elected |
1999 | Burlington | Progressive | Peter Clavelle | 5,829 | 60.32 / 100 | Re-elected as Progressive |
2001 | Burlington | Progressive | Peter Clavelle | 3,426 | 55.18 / 100 | Re-elected |
2003 | Burlington | Progressive | Peter Clavelle | 9,270 | 63.69 / 100 | Re-elected |
Independent | Unknown (Write-In) | 2,660 | 18.28 / 100 | 2nd | ||
2006 | Burlington | Progressive | Bob Kiss | 4,761 | 41.29 / 100 | Elected |
2009 | Burlington | Progressive | Bob Kiss | 2,585 | 28.8 / 100 | 2nd |
Independent | Dan Smith | 1,306 | 14.55 / 100 | 4th | ||
Progressive | Bob Kiss | 2,981 | 33.76 / 100 | 2nd | ||
4,313 | 51.5 / 100 | Re-elected | ||||
2012 | Burlington | Independent | Wanda Hines | 506 | 5.03 / 100 | 3rd |
2015 | Burlington | Progressive | Steven Goodkind | 1,716 | 22.35 / 100 | 2nd |
Independent | Greg Guma | 508 | 6.62 / 100 | 3rd | ||
2018 | Burlington | Progressive | Carina Driscoll | 4,155 | 34.96 / 100 | 2nd |
Independent | Infinite Culcleasure | 1,910 | 16.07 / 100 | 3rd | ||
2021 | Burlington | Progressive | Max Tracy | 6,060 | 42.1 / 100 | 2nd |
Independent | Ali Dieng | 1,830 | 12.7 / 100 | 3rd | ||
2024 | Burlington | Progressive | Emma Mulvaney-Stanak | 7,612 | 51.4 / 100 | Elected |
Year | City | Party | Nominee | # Votes | % Votes | Place |
---|---|---|---|---|---|---|
1961 | Alexandria [97] | Independent | Frank E. Mann | 4,122 | 55.20 / 100 | Elected |
1967 | Alexandria [98] | Independent | Fitzhugh Lee Opie | 3,738 | 39.57 / 100 | 2nd |
1996 | Alexandria [99] | Independent | Charles Stanard Severance | 490 | 8.59 / 100 | 2nd |
2000 | Alexandria [100] | Independent | Robert R. Peavey | 6,223 | 36.72 / 100 | 2nd |
2003 | Alexandria [101] | Independent | Townsend A. Van Fleet | 1,315 | 6.58 / 100 | 3rd |
2012 | Alexandria [102] | Independent | Andrew MacDonald | 25,988 | 39.91 / 100 | 2nd |
Year | City | Party | Nominee | # Votes | % Votes | Place |
---|---|---|---|---|---|---|
1902 | Milwaukee | Socialist | Howard Tuttle | 8,373 | 14.4 / 100 | 3rd |
1910 | Milwaukee [103] | Socialist | Emil Seidel | 27,622 | 46.5 / 100 | Elected |
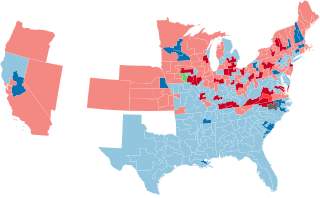
The 1908 United States House of Representatives elections were held for the most part on November 3, 1908, with Oregon, Maine, and Vermont holding theirs early in either June or September. They coincided with the 1908 United States presidential election, which William Howard Taft won. Elections were held for all 391 seats of the United States House of Representatives, representing 46 states, to serve in the 61st United States Congress.
The 1906 United States House of Representatives elections were held for the most part on November 6, 1906, with Oregon, Maine, and Vermont holding theirs early in either June or September. They occurred in the middle of President Theodore Roosevelt's second term. Elections were held for 386 seats of the United States House of Representatives, representing 45 states, to serve in the 60th United States Congress.
The 1904 United States House of Representatives elections were held for the most part on November 8, 1904, with Oregon, Maine, and Vermont holding theirs early in either June or September. They coincided with the election to a full term of President Theodore Roosevelt. Elections were held for 386 seats of the United States House of Representatives, representing 45 states, to serve in the 59th United States Congress.
The 1902 United States House of Representatives elections were held for the most part on November 4, 1902, with Oregon, Maine, and Vermont holding theirs early in either June or September. They occurred in the middle of President Theodore Roosevelt's first term, about a year after the assassination of President William McKinley in September 1901. Elections were held for 386 seats of the United States House of Representatives, representing 45 states, to serve in the 58th United States Congress.
The 1896 United States House of Representatives elections were held for the most part on November 3, 1896, with Oregon, Maine, and Vermont holding theirs early in either June or September. They coincided with the election of President William McKinley. Elections were held for 357 seats of the United States House of Representatives, representing 45 states, to serve in the 55th United States Congress. The size of the House increased by one seat after Utah gained statehood on January 4, 1896. Special elections were also held throughout the year.
The 1894 United States House of Representatives elections were held from June 4, 1894, to November 6, 1894, with special elections throughout the year. Elections were held to elect representatives from all 356 congressional districts across each of the 44 U.S. states at the time, as well as non-voting delegates from the inhabited U.S. territories. The winners of this election served in the 54th Congress, with seats apportioned among the states based on the 1890 United States census.
The 1886 United States House of Representatives elections were held for the most part on November 2, 1886, with three states holding theirs early between June and September. They occurred in the middle of President Grover Cleveland's first term. Elections were held for 325 seats of the United States House of Representatives, representing 38 states, to serve in the 50th United States Congress. Special elections were also held throughout the year.
The 1884 United States House of Representatives elections were held for the most part on November 4, 1884, with four states holding theirs early between June and October. They coincided with the election of President Grover Cleveland. Elections were held for 325 seats of the United States House of Representatives, representing 38 states, to serve in the 49th United States Congress. Special elections were also held throughout the year.
The 1882 United States House of Representatives elections were held for the most part on November 7, 1882, with five states holding theirs early between June and October. They occurred during President Chester A. Arthur's term. Elections were held for 325 seats of the United States House of Representatives, representing 38 states, to serve in the 48th United States Congress. They were the first elections after reapportionment following the 1880 United States census, increasing the size of the House. Special elections were also held throughout the year.
The 1868–69 United States House of Representatives elections were held on various dates in various states between June 1, 1868, and August 2, 1869. Each state set its own date for its elections to the House of Representatives before or after the first session of the 41st United States Congress convened on March 4, 1869. They coincided with the 1868 United States presidential election, which was won by Ulysses S. Grant. Elections were held for all 243 seats, representing 37 states. All of the former Confederate states were represented in Congress for the first time since they seceded from the Union.
The 1846–47 United States House of Representatives elections were held on various dates in various states between August 2, 1846, and November 2, 1847. Each state set its own date for its elections to the House of Representatives. 228 elected members representing 29 states took their seats when the first session of the 30th United States Congress convened December 6, 1847. The new states of Iowa and Texas elected their first representatives during this election cycle. These elections were held during President James K. Polk's term.
The 1844–45 United States House of Representatives elections were held on various dates in various states between July 1, 1844, and November 4, 1845. Each state set its own date for its elections to the House of Representatives. 224 elected members representing 27 states took their seats when the first session of the 29th United States Congress convened on December 1, 1845. The new state of Florida elected its first representative during this election cycle, while one vacancy in New Hampshire's delegation remained unfilled for the duration of the 29th Congress.
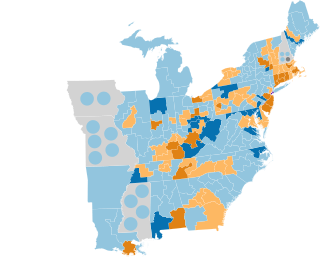
The 1834–35 United States House of Representatives elections were held on various dates in various states between July 7, 1834, and November 5, 1835. Each state set its own date for its elections to the House of Representatives before the first session of the 24th United States Congress convened on December 7, 1835. They were held during President Andrew Jackson's second term. Elections were held for 240 seats that represented 24 states, as well as the at-large-district seat for the pending new state of Michigan.
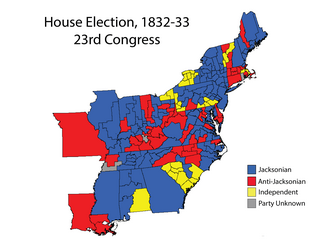
The 1832–33 United States House of Representatives elections were held on various dates in various states between July 2, 1832, and October 7, 1833. Each state set its own date for its elections to the House of Representatives before the first session of the 23rd United States Congress convened on December 2, 1833. They were held concurrently with the 1832 presidential election, in which Democrat Andrew Jackson was re-elected. The congressional reapportionment based on the 1830 United States census increased the size of the House to 240 seats.
The 1830–31 United States House of Representatives elections were held on various dates in various states between July 5, 1830, and October 3, 1831. Each state set its own date for its elections to the House of Representatives before the first session of the 22nd United States Congress convened on December 5, 1831. Elections were held for all 213 seats, representing 24 states.
This is a list detailing the electoral history of the Libertarian Party in the United States, sorted by office. The list currently consists of candidates who ran for partisan office.
This is a list detailing the electoral history of the Conservative Party in New York, sorted by year. The list currently consists of candidates who ran for partisan office, either those who ran on the Conservative Party label or were endorsed by the party. In the case of endorsements, the vote tallied is that which the candidate received under that label.
There were six special elections to the United States House of Representatives in 1885 during the 48th and 49th Congresses.